Abstract
MEIS2 has an important role in development and organogenesis, and is implicated in the pathogenesis of human cancer. The molecular basis of MEIS2 action in tumorigenesis is not clear. Here, we show that MEIS2 is highly expressed in human neuroblastoma cell lines and is required for neuroblastoma cell survival and proliferation. Depletion of MEIS2 in neuroblastoma cells leads to M-phase arrest and mitotic catastrophe, whereas ectopic expression of MEIS2 markedly enhances neuroblastoma cell proliferation, anchorage-independent growth, and tumorigenicity. Gene expression profiling reveals an essential role of MEIS2 in maintaining the expression of a large number of late cell-cycle genes, including those required for DNA replication, G2-M checkpoint control and M-phase progression. Importantly, we identify MEIS2 as a transcription activator of the MuvB-BMYB-FOXM1 complex that functions as a master regulator of cell-cycle gene expression. Further, we show that FOXM1 is a direct target gene of MEIS2 and is required for MEIS2 to upregulate mitotic genes. These findings link a developmentally important gene to the control of cell proliferation and suggest that high MEIS2 expression is a molecular mechanism for high expression of mitotic genes that is frequently observed in cancers of poor prognosis.
Myeloid ecotropic insertion site 2 (MEIS2) is a member of the three amino-acid loop extension (TALE) family of homeodomain-containing transcription factors that function as regulators of cell proliferation and differentiation during development, and are involved in proximal-distal limb patterning, skeletal muscle differentiation, and the development of hindbrain, lens, and retina.1, 2, 3, 4, 5, 6, 7, 8 All mammalian MEIS proteins (MEIS1–3) contain a conserved Hth (homothorax) domain originally identified in the Drosophila Hth protein, which mediates the interaction with other homeodomain proteins and binds to DNA sequences containing a conserved TGACAG motif. MEIS2 also has a C-terminal transcriptional activation domain, which is required for full activation of transcription by homeodomain protein complexes containing MEIS2.9
Accumulated evidence suggests an oncogenic role for MEIS proteins in the development of human cancers. The MEIS1 gene is amplified and overexpressed in ovarian cancers compared with normal ovarian surface epithelium.10, 11 In lung cancer, MEIS1/2-mediated downregulation of TGF-β type II receptor expression has been suggested as a major mechanism for inactivation of transforming growth factor β (TGF-β)-induced tumor suppressor function.12 In leukemia, it has been shown that MEIS1 cooperates with HOXA9 in transforming mouse bone marrow cells, leading to acute myeloid leukemia.13 In addition, MEIS1/2 expression is essential for maintaining myeloid cell lines in an undifferentiated, proliferating state by inhibiting myeloid differentiation.14, 15
Amplification or high-level expression of MEIS1 and MEIS2 has been also detected in primary tumors and cell lines of neuroblastoma,16, 17 a common childhood malignant tumor of the sympathetic nervous system.18, 19 However, the functional significance of MEIS genes in neuroblastoma is not clear. In this study, we investigated the function of MEIS2 in neuroblastoma cells and the underlying molecular mechanism. Our investigation uncovered a critical role of MEIS2 in the control of late cell-cycle genes through transcriptional activation of FOXM1 and its associated proteins that function as a master regulator of cell-cycle gene expression.20, 21
Results
MEIS2 is essential for the survival of neuroblastoma cells
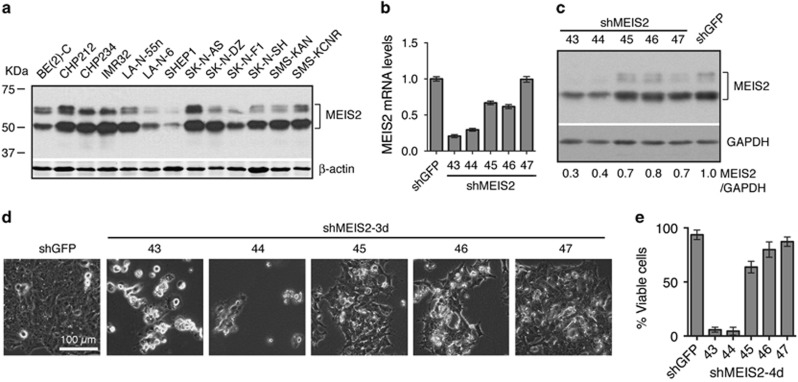
Human cells express 7 MEIS2 protein isoforms (a–d and f–h) composed of 306–477 amino acids and one non-coding RNA product, MEIS2e (Supplementary Figure S1). Consistent with previous reports,16, 17 immunoblot analysis of a panel of 13 human neuroblastoma cell lines revealed that they all expressed significant levels of MEIS2 isoforms with apparent molecular weight of 46–60 kDa (Figure 1a). To examine the functional significance of high-level MEIS2 expression, we silenced MEIS2 expression in the neuroblastoma cell line BE(2)-C cells using small-hairpin RNA (shRNA). Among the five shMEIS2 constructs tested, two (shMEIS2-43 and-44) were highly effective in knockdown of MEIS2 expression (>60%), as determined by quantitative RT-PCR (qRT-PCR) (Figure 1b) and immunoblotting (Figure 1c). MEIS2 depletion in BE(2)-C cells resulted in a marked reduction in cell survival, with > 90% of the cells losing viability within 4 days of infection with lentiviruses expressing either shMEIS2-43 or shMEIS2-44 (Figures 1d and e). We obtained essentially the same results with three additional neuroblastoma cell lines, SK-N-DZ, SK-N-FI, and SHEP1 (Supplementary Figure S2). Collectively, these findings indicate that high-level expression of MEIS2 is essential for the survival of neuroblastoma cells.
Figure 1.
MEIS2 is essential for neuroblastoma cell survival. (a) Immunoblotting of MEIS2 in a panel of 13 human neuroblastoma cell lines. β-Actin levels are shown as a loading control. (b and c) qRT-PCR (b) and immunoblot (c) analyses of MEIS2 expression in BE(2)-C cells infected with lentiviruses expressing either shGFP or shMEIS2. Error bars (b) represent S.D. (n=3). GAPDH (c) serves as a loading control. (d) Micrographs of BE(2)-C cells infected for 3 days with lentiviruses expressing either shGFP or shMEIS2. (e) Trypan blue exclusion assay of viable BE(2)-C cells infected for 4 days with lentiviruses expressing either shGFP or shMEIS2
MEIS2 depletion induces mitotic catastrophe
We next investigated the nature of cell death induced by MEIS2 depletion. We performed several assays to determine whether these cells died by apoptosis. BE(2)-C cells infected with lentiviruses expressing either shMEIS2-43 or shMEIS2-44 showed no sign of genomic DNA fragmentation or cleavage of pro-caspase 3 (Supplementary Figures S3a and b), two hallmarks of apoptosis.22 We also generated BE(2)-C cells overexpressing BCL-2 (Supplementary Figure S3c), a well-characterized anti-apoptotic protein.23 BCL-2 overexpression failed to protect BE(2)-C cells from shMEIS2-43-induced cell death (Supplementary Figure S3d). Similarly, treatment of BE(2)-C cells expressing either shMEIS2-43 or shMEIS2-44 with the cell permeable pan-caspase inhibitor zVAD-FMK failed to prevent cell death although it was highly effective in protecting cells from Fas-mediated apoptosis (Supplementary Figure S3e). Together, these data indicate that MEIS2 depletion induces predominantly non-apoptotic cell death in neuroblastoma cells.
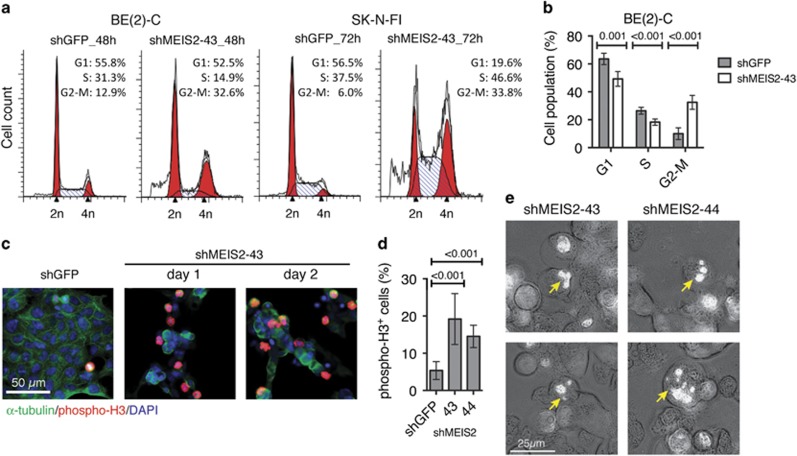
We noted that following the infection with lentiviruses expressing either shMEIS2-43 or shMEIS2-44, there was a dramatic increase in the number of cells that appeared round and refractile (Supplementary Figure S4a), which morphologically resembled the cells treated with Nocodazole (Supplementary Figure S4b), an anti-cancer agent that induces M-phase arrest by interfering with the polymerization of microtubules. We confirmed that MEIS2 depletion in both BE(2)-C and SK-N-FI cells induced M-phase arrest by cell-cycle analysis (Figures 2a and b) and by immunofluorescence staining for phosphorylated histone H3 at Ser10 (phospho-H3, Figures 2c and d), a marker for mitotic cells.24 In addition, Hoechst 33342 staining of nuclei revealed chromatin condensation and micronucleation (Figure 2e; Supplementary Figure S4c). Micronucleation results from asymmetric distribution of chromosomes or chromosome fragmentation and is a morphological feature of mitotic catastrophe.25, 26 Thus, MEIS2 depletion in neuroblastoma cells triggers non-apoptotic cell death with morphologic features of mitotic catastrophe.
Figure 2.
MEIS2 depletion induces M-phase arrest and mitotic catastrophe. (a and b) Cell-cycle analysis (a) and quantification (b) showing that MEIS2 depletion induces M-phase arrest in BE(2)-C and SK-N-F1 cells. Error bars (b) represent S.D. (n=3). (c and d) Immunofluorescence staining (c) and quantification (d) of phospho-histone H3+ M-phase BE(2)-C cells following infection with lentiviruses expressing either shGFP or shMEIS2-43. Error bars (d) represent S.D. Approximately 400–1000 cells (DAPI positive) were counted from at least 10 random × 630 fields. (e) Hoechst 33342 staining of nuclei showing chromatin condensation and micronucleation (arrows) in BE(2)-C cells following infection with lentiviruses expressing shMEIS2-43 or shMEIS2-44. Data (b and d) were analyzed with two-tailed Student's t-test with the P-values indicated
MEIS2 depletion induces mitotic spindle aberrations and centrosome amplification
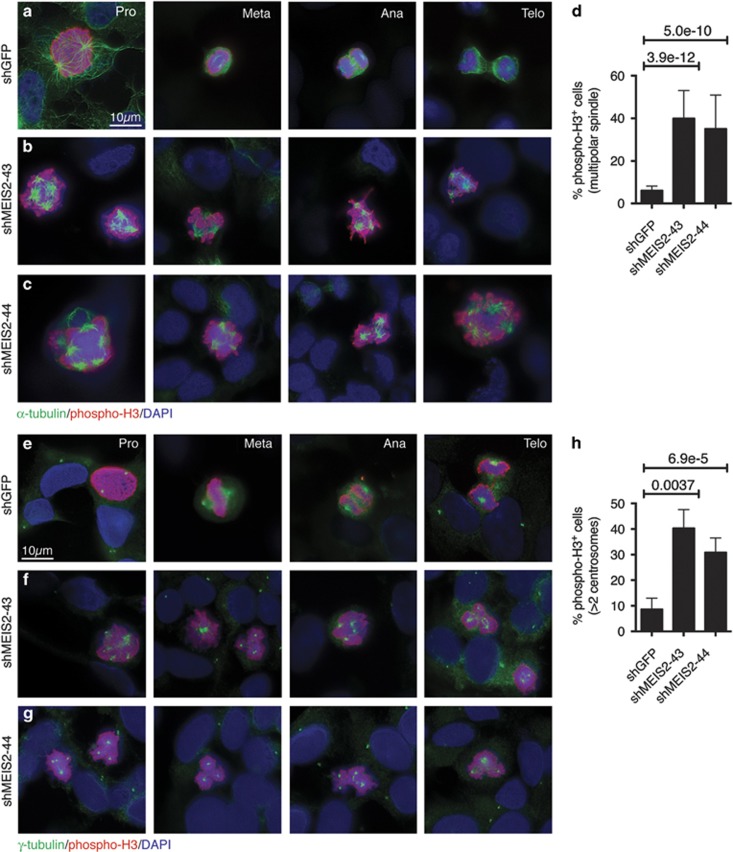
Mitotic catastrophe is generally thought to result from aberrant mitosis such as disruption of the mitotic spindle function or structure that ensures the correct segregation of chromosomes between daughter cells.26, 27 Therefore, we further characterized these mitotic cells by co-immunofluorescence staining with antibodies against phospho-H3 and α-tubulin, a component of mitotic spindles.28 A majority of control mitotic cells displayed a typical bipolar spindle and they were found at different stages of mitosis: prophase, metaphase, anaphase, and telophase (Figure 3a). By contrast, very few mitotic cells with MEIS2 depletion underwent cytokinesis and ∼40% of them displayed multiple spindle poles (Figures 3b–d). Given the critical role of the centrosome in mitotic spindle organization,29 we also examined the structure of centrosomes in the mitotic cells by co-immunofluorescence staining for phospho-H3 and γ-tubulin, a component of the centrosome.30 More than 90% of control phospho-H3+ cells contained two centrosomes (Figures 3e and h), whereas between 30 and 40% of phospho-H3+ cells with MEIS2 depletion displayed more than two centrosomes (Figures 3f–h). Thus, MEIS2 depletion triggered centrosome amplification, leading to the formation of multipolar spindles and, consequently, mitotic catastrophe.
Figure 3.
MEIS2 depletion induces multipolar mitotic spindles and centrosome amplification. (a–c) Immunofluorescence staining for M-phase BE(2)-C cells (phospho-H3+) and mitotic spindles (α-tubulin) following infection with lentiviruses expressing shGFP (a), shMEIS2-43 (b), or shMEIS2-44 (c). (d) Quantification of M-phase BE(2)-C cells (phospho-H3+) with multipolar spindles. (e–g) Immunofluorescence staining for M-phase BE(2)-C cells (phospho-H3+) and centrosomes (γ-tubulin) following infection with lentiviruses expressing shGFP (e), shMEIS2-43 (f), or shMEIS2-44 (g). (h) Quantification of M-phase BE(2)-C cells (phospho-H3+) with more than two centrosomes. Error bars (d and h) represent S.D. Approximately 400–1000 cells (DAPI positive) were counted from at least 10 random × 630 fields. Data (d and h) were analyzed with two-tailed Student's t-test with the P-values indicated. Pro, prophase; Meta, metaphase; Ana, anaphase; and Telo, telophase
MEIS2 depletion leads to global downregulation of late cell-cycle genes
To gain a molecular understanding of MEIS2 depletion-induced mitotic catastrophe, we conducted microarray gene expression profiling of BE(2)-C cells at 48 h after infection with lentiviruses expressing either shGFP or shMEIS2-43. The profiling analysis identified a total of 1206 genes that were differentially expressed (≥ +1.5 and ≤−1.5 fold, P<0.01), with 546 genes being upregulated and 660 genes downregulated (Supplementary Table S2). Gene ontology (GO) analysis of the 546 genes upregulated by shMEIS-43 revealed no clear explanation for the phenotype of M-phase arrest and mitotic catastrophe induced by MEIS2 depletion (Supplementary Table S3).
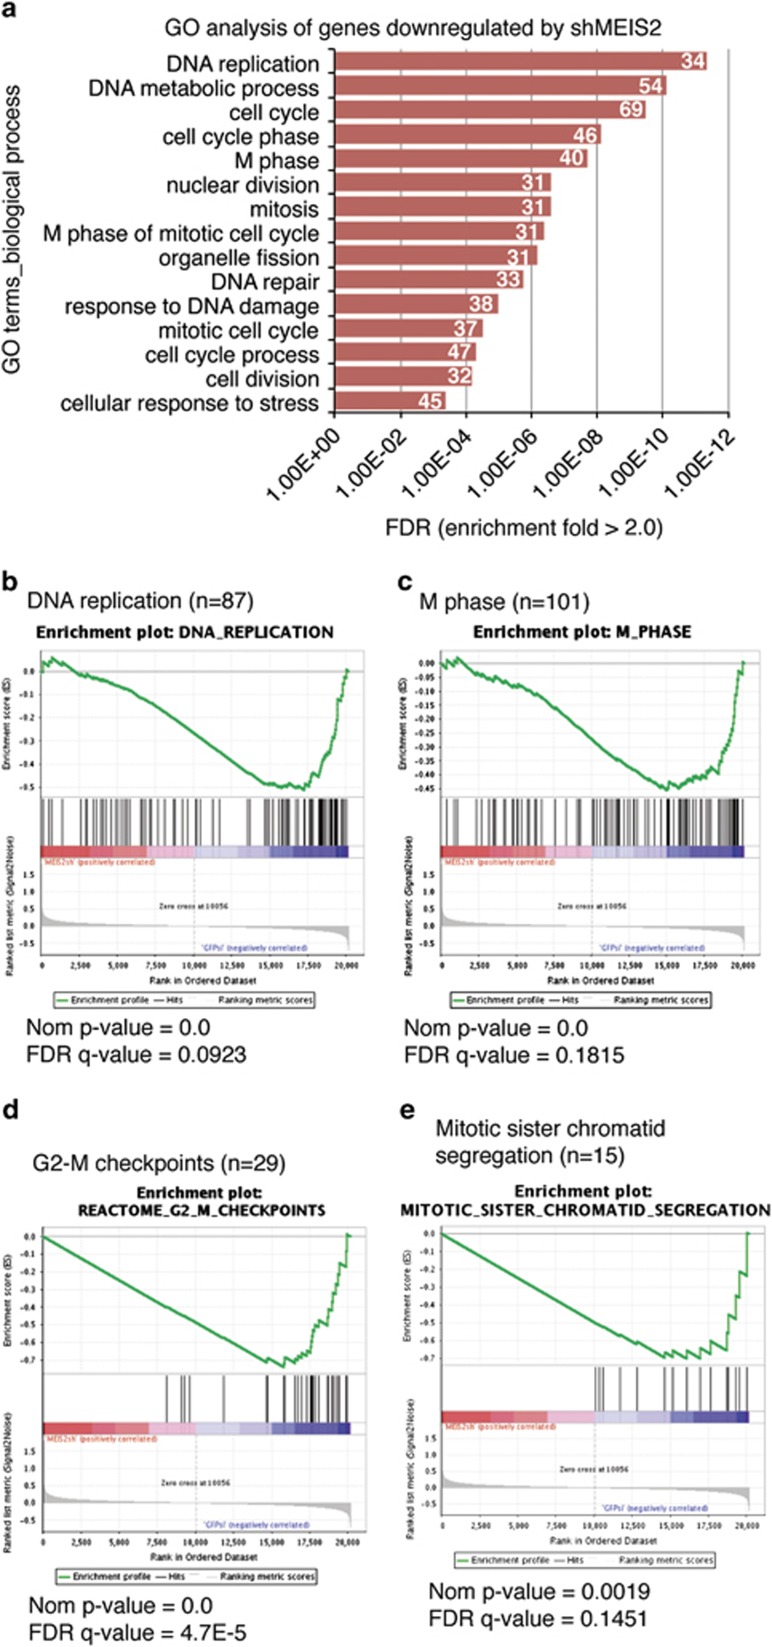
By contrast, GO analysis of the 660 downregulated genes revealed that they were remarkably enriched for genes that control the cell cycle (Figure 4a; Supplementary Table S4, enrichment fold≥2.0; FDR ≤1%), with 34 genes being involved in DNA replication and 40 genes in the M phase (Figure 4a). Similarly, GSEA showed that among the genes downregulated by shMEIS2-43, those regulating DNA replication (Figure 4b) and mitosis (Figure 4c) were significantly enriched. Particularly interesting is the downregulation of genes that control the G2-M checkpoint (Figure 4d; Supplementary Figure S5a) and mitotic sister chromatid segregation (Figure 4e; Supplementary Figure S5b). It is known that defects in the G2-M checkpoint control and mitotic sister chromatid segregation are major causes of mitotic catastrophe.31, 32 These gene expression profiling data suggest that MEIS2 depletion triggers aberrant mitosis and mitotic catastrophe by transcriptional repression of a large number of genes critical for DNA replication, G2-M checkpoint control, and M-phase progression. Thus, MEIS2 at its steady-state levels has an essential role in the transcriptional activation of key cell-cycle genes, at least in neuroblastoma cells.
Figure 4.
MEIS2 depletion leads to global downregulation of late cell-cycle genes. (a) GO analysis of the genes downregulated by shMEIS2-43 in BE(2)-C cells (FDR<1%). The number of genes for each biological process category is indicated. (b–e) GSEA showing significant enrichment of the gene sets involved in DNA replication (b), M phase (c), G2-M checkpoints (d), and mitotic sister chromatid segregation (e), with a majority of these genes being downregulated in response to MEIS2 depletion
MEIS2 targets the MuvB-BMYB-FOXM1 complex for transcriptional control of M-phase progression
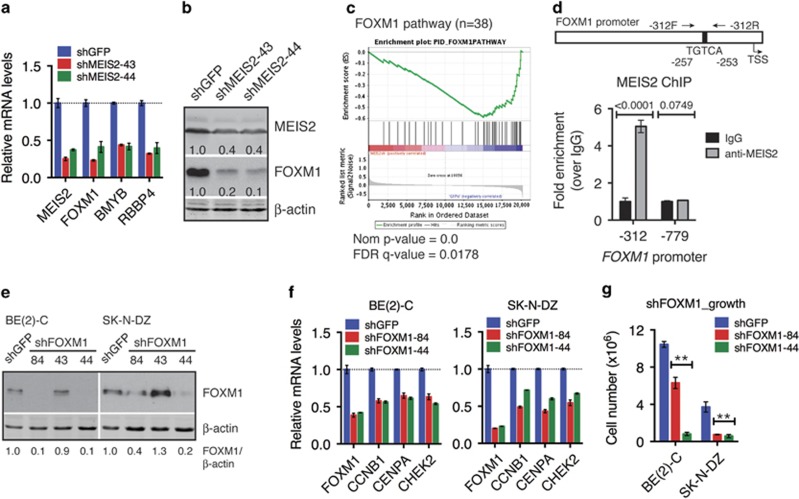
It has been reported recently that the MuvB (multi-vulval class B) complex, which is composed of LIN9, LIN37, LIN52, LIN54, and RBBP4, has an essential role in coordinating the expression of cell-cycle genes for orderly cell-cycle progression.21 The MuvB complex recruits BMYB, also known as MYBL2, to the promoters of S-phase cell-cycle genes to activate their transcription, and the MuvB-BMYB complex subsequently recruits Forkhead box protein M1 (FOXM1) to the promoters of G2-M phase cell-cycle genes for their activation.21, 33, 34 Our microarray profiling revealed that the expression of RBBP4, BMYB, and FOXM1 was significantly downregulated following MEIS2 depletion (Supplementary Tables S2 and S4). We confirmed the result by qRT-PCR (Figure 5a). Also, immunoblot analysis revealed a significant decrease in FOXM1 protein levels following MEIS2 knockdown (Figure 5b). Moreover, canonic pathway analysis of shMEIS2-responisve genes by GESA revealed that the FOXM1 pathway gene set was significantly enriched (Figure 5c). Among the 38 pathway genes, the expression levels of 25 genes, including FOXM1, were significantly reduced following MEIS2 depletion as determined by microarray profiling (Supplementary Figure S6a). The downregulation of FOXM1 target genes was also confirmed by qRT-PCR (Supplementary Figure 6b). It is known that cells with FOXM1 depletion display mitotic spindle defects, centrosome amplification, chromosome mis-segregation, failure of cytokinesis, and mitotic catastrophe,35, 36, 37 which are essentially the same phenotypes displayed by neuroblastoma cells with MEIS2 depletion as described above. In addition, it has been reported recently that FOXM1 is overexpressed in primary neuroblastoma tumors and is essential for the tumorigenicity of neuroblastoma cells.38 Consistent with the report, we found that high FOXM1 expression is significantly associated with poor prognosis and advanced tumor stages in neuroblastoma patients (Supplementary Figures S6c and d).
Figure 5.
MEIS2 targets the MuvB-BMYB-FOXM1 complex for transcriptional control of M-phase progression. (a) qRT-PCR analysis of mRNA expression of MEIS2, FOXM1, BMYB, and RBBP4 in BE(2)-C cells infected with lentiviruses expressing either shGFP or shMEIS2. (b) Immunoblotting of MEIS2 and FOXM1 in BE(2)-C cells infected with lentiviruses expressing either shGFP or shMEIS2. β-Actin levels are shown as a loading control. MEIS2 and FOXM1 levels were quantified against β-actin. (c) GSEA showing marked downregulation of the FOXM1 pathway genes in BE(2)-C cells with MEIS2 depletion. (d) ChIP-qPCR analysis showing MEIS2 binding to the FOXM1 promoter region (−312 to −158) containing a consensus TGIF/MEIS2-binding sequence TGTCA. Error bars, S.D. (n=3). (e) Immunoblotting of FOXM1 in BE(2)-C and SK-N-DZ cells with or without FOXM1 knockdown. β-Actin levels are shown as a loading control. (f) qRT-PCR analysis of mRNA expression of key FOXM1 target genes in BE(2)-C and SK-N-DZ cells with or without FOXM1 knockdown. (g) Growth assay of BE(2)-C and SK-N-DZ cells with or without FOXM1 knockdown. Error bars, S.D. (n=3). **P<0.001. Data (d and g) were analyzed with two-tailed Student's t-test
Chromatin immunoprecipitation (ChIP)-qPCR analysis showed specific interaction of endogenous MEIS2 with the FOXM1 promoter region spanning from −312 to −158 (5.1-fold enrichment relative to IgG control), which contains a consensus TGIF/MEIS2-binding sequence TGTCA39 257 bp upstream of the transcription start site (TSS) (Figure 5d). The same ChIP-qPCR assay revealed no significant association of MEIS2 with the promoter regions of RBBP4 and BMYB (data not shown). These findings, in combination with gene expression data, indicate that FOXM1 is a direct target gene of MEIS2, whereas the expression of RBBP4 and BMYB appears to be indirectly regulated by MEIS2.
In agreement with previous findings,35, 36, 37 shRNA-mediated depletion of FOXM1 in BE(2)-C and SK-N-DZ cells (Figure 5e) resulted in marked downregulation of known FOXM1 target genes (Figure 5f) and loss of cell viability as a result of mitotic catastrophe (Figure 5g; Supplementary Figures S7a and b). Similarly, treatment of BE(2)-C and SK-N-DZ cells with siomycin A or thiostrepton, specific inhibitors of FOXM1,40, 41, 42 led to cell death with morphological features of mitotic catastrophe (Supplementary Figure S7c). Thus, FOXM1 depletion or inhibition in neuroblastoma cells fully recapitulated the phenotype of MEIS2 depletion at both molecular and cellular levels. Collectively, these data suggest that MEIS2 depletion-induced mitotic catastrophe results from the downregulation of FOXM1, RBBP4 and BMYB, which in turn leads to the downregulation of mitotic genes and disruption of M-phase progression.
MEIS2 promotes the proliferation and tumorigenicity of neuroblastoma cells
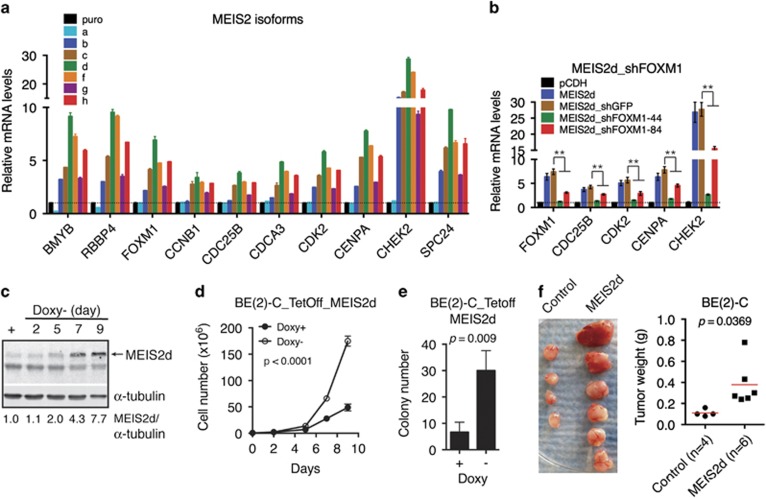
Increased expression of mitotic genes is a common feature of cancers of advanced stages.21 Given that MEIS2 is essential for maintaining the expression of FOXM1, BMYB, and RBBP4, we examined the functional significance of increased MEIS2 expression in neuroblastoma cells. Transient overexpression of individual MEIS2 isoforms, with the exception of MEIS2a, increased mRNA expression of RBBP4, BMYB, and FOXM1, as well as their downstream target genes (Figure 6a). Importantly, FOXM1 depletion by shRNA significantly abolished the ability of MEIS2d to upregulate the expression of mitotic genes (Figure 6b), demonstrating that FOXM1 is an essential mediator of MEIS2 action in neuroblastoma cells. We chose MEIS2d for further functional studies, because it appeared to be the isoform most effective in transactivation of cell-cycle genes (Figure 6a). We established BE(2)-C cells with inducible expression of MEIS2d in the absence of doxycycline (Figure 6c). Induction of MEIS2d significantly enhanced neuroblastoma cell proliferation in culture (Figure 6d; Supplementary Figure S8), anchorage-independent growth in soft agar (Figure 6e), and tumorigenicity in immunodeficient mice (Figure 6f). These findings demonstrate an oncogenic activity of MEIS2 in neuroblastoma cells.
Figure 6.
MEIS2 enhances the proliferation and tumorigenicity of neuroblastoma cells. (a) qRT-PCR analysis of mRNA expression of RBBP4, BMYB, FOXM1 and their target genes in BE(2)-C cells transfected with plasmids expressing individual MEIS2 isoforms. Error bars, S.D. (n=3). (b) qRT-PCR analysis of mRNA expression of FOXM1 and its key target genes in BE(2)-C cells co-transfected with an MEIS2d-expessing plasmid along with constructs expressing shGFP, shFOXM1-44, or shFOXM1-84. Error bars, S.D. (n=3). **P<0.01. (c) Immunoblotting of MEIS2d in BE(2)-C_tetoff_MEIS2d cells with or without doxycycline (Doxy). α-Tubulin levels are shown as a loading control. (d and e) Growth (d) and soft agar (e) assays of BE(2)-C_tetoff_MEIS2d in the presence or absence of Doxy. (f) Xenograft assay of BE(2)-C_tetoff_GFP and BE(2)-C_tetoff_MEIS2d cells. Tumor weight was analyzed by scatter plot with horizontal lines indicating the mean. Data (b, d, e, and f) were analyzed with two-tailed Student's t-test with the P-values indicated
Discussion
In this report, we present evidence for an essential role of MEIS2, an important regulator of development, in the control of cell-cycle progression in neuroblastoma cells. We show that depletion of MEIS2 in neuroblastoma cells induces mitotic spindle aberrations, centrosome amplification, and M-phase arrest, leading to mitotic catastrophe, whereas ectopic MEIS2 expression enhances the proliferation and tumorigenicity of neuroblastoma cells. At the molecular level, MEIS2 depletion decreases the expression of late cell-cycle or mitotic genes, whereas MEIS2 overexpression increases their expression. We further provide evidence for MEIS2 as a key transcription activator of the MuvB-BMYB-FOXM1 complex, which functions as a master regulator of cell-cycle gene expression,21 thereby linking MEIS2 to the transcriptional control of cell-cycle genes and cell proliferation (Figure 7). Collectively, these findings suggest an oncogenic activity of MEIS2 in neuroblastoma pathogenesis and shed light on the molecular mechanism for the biological function of MEIS2 in development.
Figure 7.
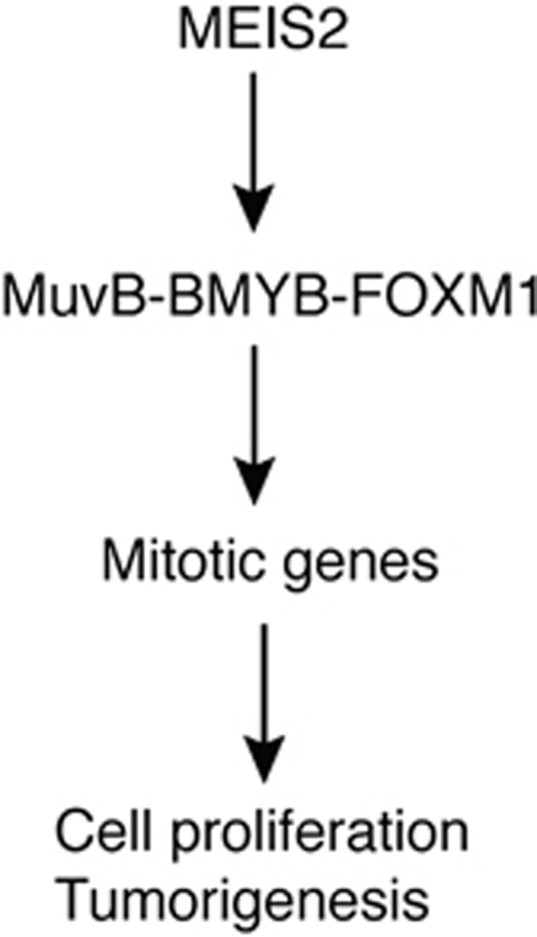
Model for MEIS2 transcriptional activation of the MuvB-RBBP4-FOXM1 complex to promote mitotic gene expression, cell proliferation, and tumorigenesis
Cell-cycle progression is tightly linked to development that leads to the generation of a mature multicellular organism from the zygote. Accumulated evidence indicates a crucial role of cell-cycle genes in cell fate determination.43 However, the molecular mechanisms by which development genes regulate cell-cycle progression are less clear. It has been shown previously that RNAi-mediated knockdown of Meis2 in chick and mouse retinal progenitor cells inhibits cell proliferation, suggesting that Meis2 is essential for maintaining the progenitor cells in a rapidly proliferating state.5 Our results suggest a molecular mechanism for MEIS2 to promote cell proliferation during development by transcriptional activation of cell-cycle genes.
FOXM1 was originally identified as a transcription factor that activates the expression of many mitotic genes and is essential for execution of the mitotic program.35, 36, 37 High FOXM1 expression is a common feature of many types of cancers and is associated with poor prognosis.20, 21 FOXM1 is also overexpressed in primary neuroblastoma tumors and is essential for the tumorigenicity of neuroblastoma cells.38 Our study reveals that higher FOXM1 expression is significantly associated with advanced stages of neuroblastoma and decreased survival of neuroblastoma patients. The molecular mechanism underlying FOXM1 overexpression in various cancers is not well understood.21 We show that MEIS2 is essential for maintaining the expression of FOXM1 in neuroblastoma cells and FOXM1 is a direct target gene of MEIS2, suggesting that high-level expression of MEIS2 is a major mechanism underlying FOXM1 overexpression in neuroblastoma.
The identification of FOXM1 as a direct target gene of MEIS2 also offers a molecular explanation for the mitotic catastrophe phenotype induced by MEIS2 depletion. Mitosis is an ordered series of events, leading to equal distribution of duplicated chromosomes and centrosomes between the two daughter cells. Mitotic catastrophe can be triggered by aberrant mitosis resulting from defective G2-M checkpoint control, which promotes premature entry into mitosis,31 or from disruption of the mitotic machinery that ensures the correct segregation of chromosomes between daughter cells.32 FOXM1 target genes include those encoding protein components of both G2-M checkpoint (e.g., CDC25B and CHEK2) and the mitotic machinery for chromosome segregation (e.g., CENPA, CENPB, and CENPF). A majority of FOXM1 target genes, including CDC25B, CHEK2, CENPA, CENPB, and CENPF, were significantly downregulated in neuroblastoma cells with MEIS2 depletion. Their downregulation could disrupt the G2-M checkpoint control, the assembly of kinetochore, and the attachment of mitotic spindle microtubules to sister chromatids, thereby triggering mitotic catastrophe. Moreover, loss of FOXM1 also leads to centrosome amplification and mitotic catastrophe,36 a phenotype fully recapitulated by MEIS2 depletion. Together, these findings suggest that FOXM1 downregulation is a major mechanism for MEIS2 depletion-induced mitotic catastrophe. Nevertheless, overexpression of FOXM1 alone failed to rescue the cell death phenotype induced by MEIS2 depletion (data not shown). This is probably because MEIS2 is also required for the expression of BMYB and RBBP4, which form a complex with FOXM1 in transcriptional activation of mitotic genes.21
Finally, a key finding of our study is the identification of MEIS2 as an upstream transcription activator of BMYB and RBBP4 expression: MEIS2 depletion decreased their mRNA expression, whereas MEIS2 overexpression activated their transcription. We found no significant binding of MEIS2 to the promoters of BMYB and RBBP4, suggesting that MEIS2 activates their transcription indirectly. BMYB is a sequence-specific DNA-binding protein, and RBBP4 is a component of the MuvB complex that has an essential role in coordinating the expression of cell-cycle genes by sequentially interacting with and recruiting BMYB and FOXM1 to their target genes required for S- and M-phase progression, respectively.21 Dysregulation of the MuvB-BMYB-FOXM1 complex is frequently observed in cancers with poor prognosis and is thought to promote cancer progression by upregulating the expression of mitotic genes.21 The identification of MEIS2 as a transcription activator of the complex provides a molecular mechanism for the aberrant activation of mitotic genes in cancer cells and suggests a general oncogenic activity for MEIS2 in cancer development.
Materials and Methods
Cell lines and culture
The human neuroblastoma cell lines BE(2)-C (CRL-2268; ATCC, Manassas, VA, USA), SK-N-DZ (CRL-2149; ATCC), SK-N-F1 (CRL-2141; ATCC), and SHEP144 cells were cultured in a 1 : 1 mixture of DMEM and Ham's nutrient mixture F12 supplemented with 10% fetal bovine serum (Invitrogen, Carlsbad, CA, USA). Cells were examined and phase-contrast images captured using an Axio Observer microscope and the software AxioVision (Carl Zeiss MicroImaging, Thornwood, NY, USA).
Overexpression and RNA interference
The cDNA molecules coding for various human MEIS2 isoforms were generated by reverse transcription using total RNA prepared from the human neuroblastoma cell line BE(2)-C, verified by sequencing, and cloned into the lentiviral expression vector pCDH-CMV-MCS-puro (SBI, Mountain View, CA, USA). The Retro-X Tet-Off Advanced Inducible Gene Expression System (Clontech, Mountain View, CA, USA) was used to generate BE(2)-C cells with inducible MEIS2d expression in the absence of doxycycline. Myc-tagged human MEIS2d was generated by PCR using pCDH-puro-MEIS2d, verified by sequencing, and subcloned into pRetroX-Tight-pur. pLKO.1-based lentiviral constructs expressing shRNA to MEIS2 (clone ID: TRCN0000016043, TRCN0000016044, TRCN0000016045, TRCN0000016046, and TRCN0000016047) were purchased from Open Biosystems (Huntsville, AL, USA) and to FOXM1 (clone ID: TRCN0000273984, TRCN0000015543, TRCN0000015544, TRCN0000015545, and TRCN0000015546) from Sigma-Aldrich (St. Louis, MO, USA). pLKO.1-shGFP (Addgene, Cambridge, MA, USA) was used as a control. Retroviruses and lentiviruses were produced in 293FT cells using the packaging plasmids pHDM-G and pMD.MLVogp (retroviruses) or pLP1, pLP2, and pLP/VSVG (lentiviruses).
Cell-cycle and survival assays
For cell-cycle analysis, cells were fixed in 70% ethanol, incubated with ribonuclease A (Sigma-Aldrich), and stained with 20 μg/ml propidium iodide (Invitrogen). Samples were analyzed using a FACSCalibur system and ModFitLT V3.2.1 software (BD Bioscience, San Jose, CA, USA). Cell viability was measured by trypan blue exclusion assay. Genomic DNA fragmentation assay was performed as previously described.45
Immunoblotting and Immunofluorescence
Immunoblotting was conducted according to standard procedures using the following primary antibodies: rabbit anti-BCL2 (sc-783, 1 : 200), rabbit anti-caspase 3 (sc-7148, 1 : 200), rabbit anti-Flag (F7425, 1 : 1000; Sigma-Aldrich), rabbit anti-FOXM1 (sc-502, 1 : 100), rabbit anti-GAPDH (sc-25778, 1 : 3000), mouse anti-MEIS2 (sc-81986, 1 : 400), rabbit anti-β-actin (600-401-886, 1 : 2000; Rockland Immunochemicals, Gilbertsville, PA, USA), and mouse anti-α-tubulin (B-5-1-2, 1 : 5000; Sigma-Aldrich). Unless indicated, all primary antibodies were purchased from Santa Cruz Biotechnology (Dallas, TX, USA). Horseradish peroxidase-conjugated goat anti-mouse and goat anti-rabbit IgG (Santa Cruz Biotechnology) were used as secondary antibodies. Proteins were visualized using a SuperSignal West Pico chemiluminescence kit (Pierce, Rockford, IL, USA) and quantified using ImageJ (version 1.47d, NIH, Bethesda, MD, USA). Films were exposed for various times for quantification of target proteins within their linear range of detection. For visualization and quantification with the Odyssey system, goat anti-mouse IRDye 800, anti-rabbit IRDye 800, anti-mouse IRDye 680, and anti-rabbit IRDye 680 were used as secondary antibodies (LI-COR Biosciences, Lincoln, NE, USA). For immunofluorescence, cells were fixed for 10 min either with 4% paraformaldehyde at room temperature or with a 1 : 1 mixture of acetone and methanol for at −20 °C (for γ-tubulin), and stained with mouse anti-α-tubulin (B-5-1-2, 1 : 2000), mouse anti-γ-tubulin (GTU-88, 1 : 1000; Sigma-Aldrich), and rabbit anti-phospho-histone H3 (06-570, 1 : 200; Millipore, Billerica, MA, USA). All secondary fluorescence antibodies were from Molecular Probes (Grand Island, NY, USA) and used at 1 : 800 dilutions for goat anti-mouse (Alexa Fluor 488) and goat anti-rabbit (Alexa Fluor 594). Nuclei were stained with DAPI. Fluorescent images were captured with a fluorescence microscope and the software AxioVision (Carl Zeiss Axio Observer, Carl Zeiss Microscopy, Thornwood, NY, USA).
Microarray gene expression profiling
Total RNA was isolated using Trizol (Invitrogen) from three replicate samples of BE(2)-C cells infected with lentiviruses expressing either shGFP or shMEIS2-43 for 48 h. Affymetrix microarray was performed using the Human Gene 1.0 ST microarray chip (Agilent Technologies, Santa Clara, CA, USA). Data were normalized, significance determined by ANOVA, and fold change calculated with the Partek Genomics Suite (Partek Inc., St. Louis, MO, USA). GO analysis was performed with DAVID46 for all differentially expressed genes (≥+1.5 and ≤−1.5 fold, P<0.01). Microarray data were also analyzed by gene set enrichment analysis (GSEA).47 The microarray data have been deposited in the NCBI Gene Expression Omnibus (GEO) with the accession number GSE56003 (http://www.ncbi.nlm.nih.gov/geo/query/acc.cgi?acc=GSE56003).
Quantitative RT-PCR
Total RNA was isolated from three replicate samples using Trizol. Reverse transcription was performed using SuperScript II Reverse Transcriptase (Invitrogen). Quantitative real-time PCR was performed using a RT2 SYBR green/Fluorescein PCR master mix (SABiosciences, QIAGEN, Valencia, CA, USA) on an iQ5 real-time PCR system (Bio-Rad, Hercules, CA, USA) with primers against BMYB (MYBL2), CCNB1, CDC25A, CDC25B, CDCA3, CDK2, CENPA, CHEK1, CHEK2, FOXM1, MEIS2, RBBP4, SPC24, and B2M (β2 microglobulin) (Supplementary Table S1). All primer pairs were verified by melting curve analysis following qRT-PCR, with each primer pair showing a single desired amplification peak. All samples were normalized to B2M mRNA levels.
Chromatin immunoprecipitation-qPCR
Each ChIP sample used 4 × 10⁷ BE(2)-C cells. Cross-linked chromatin DNA was sheared through sonication and immunoprecipitated using mouse anti-MEIS2 (sc-81986) or normal mouse IgG (sc-2025), all from Santa Cruz Biotechnology, according to the published procedure.48 ChIP genomic DNA samples were assayed in triplicate by PCR using an iQ5 real-time PCR system (Bio-Rad) and primer sets that cover the following FOXM1 promoter regions: FOXM1p-779 (−540 to −779), TGCTGGGATTACAGGCGTGAG, CTCCCGAAGCCAAGCCTTCGG; FOXM1p-312 (−158 to −312), GTGTCGCCTGGCGTGACCAGC, AAGAAGTGGCCGTGGGGCCGG.
Soft agar and xenograft assays
Cells (1000/well) were mixed with 0.3% Noble agar in DMEM growth medium and plated onto six-well plates containing a solidified bottom layer (0.6% Noble agar in DMEM growth medium). After 14 days, colonies were stained with 5 mg/ml MTT (Sigma-Aldrich), photographed and counted. For xenograft assay, 6-week-old female NOD.SCID/NCr mice (NCI, Frederick, MD, USA) were injected subcutaneously at both flanks with 5 × 10⁶ BE(2)-C_tetoff or BE(2)-C_tetoff_MEIS2d cells in 200 μl serum-free DMEM. Eighteen days after injection, tumors were removed and weighed. All animal experiments were pre-approved by the Institutional Animal Care and Use Committee of Georgia Regents University.
Analyses of patient data
Patient data used in this study were described previously.49 Gene expression data sets were obtained from the Oncogenomics Database (http://pob.abcc.ncifcrf.gov/cgi-bin/JK).50 Kaplan–Meier analysis was conducted online, and the resulting survival curves and P-values (log-rank test) were downloaded. All cutoff values for separating high and low expression groups were determined by the online Oncogenomics algorithm.50
Statistical analysis
For immunofluorescence staining, ∼400–1000 cells (DAPI positive) were counted from at least 10 random × 630 fields, and the percentages of phospho-histone H3+ cells without or with multipolar spindles or centrosomes were determined. Statistics were determined with unpaired, two-tailed Student's t-test using Prism 6.01 for Mac (GraphPad Software, La Jolla, CA, USA), and a P–value of <0.05 is considered to be statistically significant.
Acknowledgments
We thank Drs Eiko Kitamura, Sam Chang, and LesleyAnn Hawthorn at the Georgia Regents University Cancer Center Genomics Core for assistance in Microarray profiling and data analysis. This work was supported by a National Natural Science Foundation of China grant 81201981 to YZ and the NIH grant R01CA124982 and DoD grant W81XWH-12-1-0613 to H-FD.
Glossary
- ChIP
chromatin immunoprecipitation
- FDR
false discovery rate
- FOXM1
Forkhead box protein M1
- GSEA
gene set enrichment analysis
- GO
gene ontology
- Hth
homothorax
- MEIS2
Myeloid ecotropic insertion site 2
- MuvB
multi-vulval class B
- MYBL2/BMYB
v-myb avian myeloblastosis viral oncogene homolog-like 2
- qPCR
quantitative reverse transcription PCR
- RBBP4
retinoblastoma binding protein 4
- shRNA
small-hairpin RNA
- TALE
three amino-acid loop extension
- TGF-β
transforming growth factor β
The authors declare no conflict of interest.
Footnotes
Supplementary Information accompanies this paper on Cell Death and Disease website (http://www.nature.com/cddis)
Edited by G Raschellà
Supplementary Material
References
- Berkes CA, Bergstrom DA, Penn BH, Seaver KJ, Knoepfler PS, Tapscott SJ. Pbx marks genes for activation by MyoD indicating a role for a homeodomain protein in establishing myogenic potential. Mol Cell. 2004;14:465–477. doi: 10.1016/s1097-2765(04)00260-6. [DOI] [PubMed] [Google Scholar]
- Bessa J, Tavares MJ, Santos J, Kikuta H, Laplante M, Becker TS, et al. meis1 regulates cyclin D1 and c-myc expression, and controls the proliferation of the multipotent cells in the early developing zebrafish eye. Development. 2008;135:799–803. doi: 10.1242/dev.011932. [DOI] [PubMed] [Google Scholar]
- Capdevila J, Tsukui T, Esteban CR, Zappavigna V, Belmonte JCI. Control of vertebrate limb outgrowth by the proximal factor MEIS2 and distal antagonism of BMPs by gremlin. Mol Cell. 1999;4:839–849. doi: 10.1016/s1097-2765(00)80393-7. [DOI] [PubMed] [Google Scholar]
- Dibner C, Elias S, Frank D. XMeis3 protein activity is required for proper hindbrain patterning in Xenopus laevis embryos. Development. 2001;128:3415–3426. doi: 10.1242/dev.128.18.3415. [DOI] [PubMed] [Google Scholar]
- Heine P, Dohle E, Bumsted-O'Brien K, Engelkamp D, Schulte D. Evidence for an evolutionary conserved role of homothorax/Meis1/2 during vertebrate retina development. Development. 2008;135:805–811. doi: 10.1242/dev.012088. [DOI] [PubMed] [Google Scholar]
- Mercader N, Leonardo E, Azpiazu N, Serrano A, Morata G, Martinez-A C, et al. Conserved regulation of proximodistal limb axis development by Meis1/Hth. Nature. 1999;402:425–429. doi: 10.1038/46580. [DOI] [PubMed] [Google Scholar]
- Vlachakis N, Choe SK, Sagerstrom CG. Meis3 synergizes with Pbx4 and Hoxb1b in promoting hindbrain fates in the zebrafish. Development. 2001;128:1299–1312. doi: 10.1242/dev.128.8.1299. [DOI] [PubMed] [Google Scholar]
- Zhang X, Friedman A, Heaney S, Purcell P, Maas RL. Meis homeoproteins directly regulate Pax6 during vertebrate lens morphogenesis. Genes Dev. 2002;16:2097–2107. doi: 10.1101/gad.1007602. [DOI] [PMC free article] [PubMed] [Google Scholar]
- Hyman-Walsh C, Bjerke GA, Wotton D. An autoinhibitory effect of the homothorax domain of Meis2. FEBS J. 2010;277:2584–2597. doi: 10.1111/j.1742-464X.2010.07668.x. [DOI] [PMC free article] [PubMed] [Google Scholar]
- Welsh JB, Zarrinkar PP, Sapinoso LM, Kern SG, Behling CA, Monk BJ, et al. Analysis of gene expression profiles in normal and neoplastic ovarian tissue samples identifies candidate molecular markers of epithelial ovarian cancer. Proc Natl Acad Sci. 2001;98:1176–1181. doi: 10.1073/pnas.98.3.1176. [DOI] [PMC free article] [PubMed] [Google Scholar]
- Israeli O, Goldring-Aviram A, Rienstein S, Ben-Baruch G, Korach J, Goldman B, et al. In silico chromosomal clustering of genes displaying altered expression patterns in ovarian cancer. Cancer Genet Cytogenet. 2005;160:35–42. doi: 10.1016/j.cancergencyto.2004.11.011. [DOI] [PubMed] [Google Scholar]
- Halder SK, Cho YJ, Datta A, Anumanthan G, Ham AJ, Carbone DP, et al. Elucidating the mechanism of regulation of transforming growth factor beta Type II receptor expression in human lung cancer cell lines. Neoplasia. 2011;13:912–922. doi: 10.1593/neo.11576. [DOI] [PMC free article] [PubMed] [Google Scholar]
- Kroon E, Krosl J, Thorsteinsdottir U, Baban S, Buchberg AM, Sauvageau G. Hoxa9 transforms primary bone marrow cells through specific collaboration with Meis1a but not Pbx1b. EMBO J. 1998;17:3714–3725. doi: 10.1093/emboj/17.13.3714. [DOI] [PMC free article] [PubMed] [Google Scholar]
- Fujino T, Yamazaki Y, Largaespada DA, Jenkins NA, Copeland NG, Hirokawa K, et al. Inhibition of myeloid differentiation by Hoxa9, Hoxb8, and Meis homeobox genes. Exp Hematol. 2001;29:856–863. doi: 10.1016/s0301-472x(01)00655-5. [DOI] [PubMed] [Google Scholar]
- Calvo KR, Knoepfler PS, Sykes DB, Pasillas MP, Kamps MP. Meis1a suppresses differentiation by G-CSF and promotes proliferation by SCF: Potential mechanisms of cooperativity with Hoxa9 in myeloid leukemia. Proc Natl Acad Sci. 2001;98:13120–13125. doi: 10.1073/pnas.231115398. [DOI] [PMC free article] [PubMed] [Google Scholar]
- Spieker N, van Sluis P, Beitsma M, Boon K, van Schaik BDC, van Kampen AHC, et al. The MEIS1 oncogene is highly expressed in neuroblastoma and amplified in cell line IMR32. Genomics. 2001;71:214–221. doi: 10.1006/geno.2000.6408. [DOI] [PubMed] [Google Scholar]
- Geerts D, Schilderink N, Jorritsma G, Versteeg R. The role of the MEIS homeobox genes in neuroblastoma. Cancer Lett. 2003;197:87–92. doi: 10.1016/s0304-3835(03)00087-9. [DOI] [PubMed] [Google Scholar]
- Brodeur GM. Neuroblastoma: biological insights into a clinical enigma. Nat Rev Cancer. 2003;3:203–216. doi: 10.1038/nrc1014. [DOI] [PubMed] [Google Scholar]
- Maris JM. Recent advances in neuroblastoma. N Engl J Med. 2010;362:2202–2211. doi: 10.1056/NEJMra0804577. [DOI] [PMC free article] [PubMed] [Google Scholar]
- Koo CY, Muir KW, Lam EW. FOXM1: from cancer initiation to progression and treatment. Biochim Biophys Acta. 2012;1819:28–37. doi: 10.1016/j.bbagrm.2011.09.004. [DOI] [PubMed] [Google Scholar]
- Sadasivam S, DeCaprio JA. The DREAM complex: master coordinator of cell cycle-dependent gene expression. Nat Rev Cancer. 2013;13:585–595. doi: 10.1038/nrc3556. [DOI] [PMC free article] [PubMed] [Google Scholar]
- Kepp O, Galluzzi L, Lipinski M, Yuan J, Kroemer G. Cell death assays for drug discovery. Nat Rev Drug Discov. 2011;10:221–237. doi: 10.1038/nrd3373. [DOI] [PubMed] [Google Scholar]
- Adams JM, Cory S. The Bcl-2 apoptotic switch in cancer development and therapy. Oncogene. 2007;26:1324–1337. doi: 10.1038/sj.onc.1210220. [DOI] [PMC free article] [PubMed] [Google Scholar]
- Hans F, Dimitrov S. Histone H3 phosphorylation and cell division. Oncogene. 2001;20:3021–3027. doi: 10.1038/sj.onc.1204326. [DOI] [PubMed] [Google Scholar]
- Vakifahmetoglu H, Olsson M, Zhivotovsky B. Death through a tragedy: mitotic catastrophe. Cell Death Differ. 2008;15:1153–1162. doi: 10.1038/cdd.2008.47. [DOI] [PubMed] [Google Scholar]
- Vitale I, Galluzzi L, Castedo M, Kroemer G. Mitotic catastrophe: a mechanism for avoiding genomic instability. Nat Rev Mol Cell Biol. 2011;12:385–392. doi: 10.1038/nrm3115. [DOI] [PubMed] [Google Scholar]
- Jordan MA, Wilson L. Microtubules as a target for anticancer drugs. Nat Rev Cancer. 2004;4:253–265. doi: 10.1038/nrc1317. [DOI] [PubMed] [Google Scholar]
- Piperno G, LeDizet M, Chang XJ. Microtubules containing acetylated alpha-tubulin in mammalian cells in culture. J Cell Biol. 1987;104:289–302. doi: 10.1083/jcb.104.2.289. [DOI] [PMC free article] [PubMed] [Google Scholar]
- Nigg EA, Stearns T. The centrosome cycle: Centriole biogenesis, duplication and inherent asymmetries. Nat Cell Biol. 2011;13:1154–1160. doi: 10.1038/ncb2345. [DOI] [PMC free article] [PubMed] [Google Scholar]
- Luders J, Stearns T. Microtubule-organizing centres: a re-evaluation. Nat Rev Mol Cell Biol. 2007;8:161–167. doi: 10.1038/nrm2100. [DOI] [PubMed] [Google Scholar]
- Castedo M, Perfettini JL, Roumier T, Andreau K, Medema R, Kroemer G. Cell death by mitotic catastrophe: a molecular definition. Oncogene. 2004;23:2825–2837. doi: 10.1038/sj.onc.1207528. [DOI] [PubMed] [Google Scholar]
- Galluzzi L, Vitale I, Abrams JM, Alnemri ES, Baehrecke EH, Blagosklonny MV, et al. Molecular definitions of cell death subroutines: recommendations of the Nomenclature Committee on Cell Death 2012. Cell Death Differ. 2012;19:107–120. doi: 10.1038/cdd.2011.96. [DOI] [PMC free article] [PubMed] [Google Scholar]
- Down CF, Millour J, Lam EW, Watson RJ. Binding of FoxM1 to G2/M gene promoters is dependent upon B-Myb. Biochim Biophys Acta. 2012;1819:855–862. doi: 10.1016/j.bbagrm.2012.03.008. [DOI] [PubMed] [Google Scholar]
- Sadasivam S, Duan S, DeCaprio JA. The MuvB complex sequentially recruits B-Myb and FoxM1 to promote mitotic gene expression. Genes Dev. 2012;26:474–489. doi: 10.1101/gad.181933.111. [DOI] [PMC free article] [PubMed] [Google Scholar]
- Laoukili J, Kooistra MR, Bras A, Kauw J, Kerkhoven RM, Morrison A, et al. FoxM1 is required for execution of the mitotic programme and chromosome stability. Nat Cell Biol. 2005;7:126–136. doi: 10.1038/ncb1217. [DOI] [PubMed] [Google Scholar]
- Wonsey DR, Follettie MT. Loss of the forkhead transcription factor FoxM1 causes centrosome amplification and mitotic catastrophe. Cancer Res. 2005;65:5181–5189. doi: 10.1158/0008-5472.CAN-04-4059. [DOI] [PubMed] [Google Scholar]
- Wang IC, Chen YJ, Hughes D, Petrovic V, Major ML, Park HJ, et al. Forkhead box M1 regulates the transcriptional network of genes essential for mitotic progression and genes encoding the SCF (Skp2-Cks1) ubiquitin ligase. Mol Cell Biol. 2005;25:10875–10894. doi: 10.1128/MCB.25.24.10875-10894.2005. [DOI] [PMC free article] [PubMed] [Google Scholar]
- Wang Z, Park HJ, Carr JR, Chen YJ, Zheng Y, Li J, et al. FoxM1 in tumorigenicity of the neuroblastoma cells and renewal of the neural progenitors. Cancer Res. 2011;71:4292–4302. doi: 10.1158/0008-5472.CAN-10-4087. [DOI] [PMC free article] [PubMed] [Google Scholar]
- Yang Y, Hwang CK, D'Souza UM, Lee S-H, Junn E, Mouradian MM. Three-amino acid extension loop homeodomain proteins Meis2 and TGIF differentially regulate transcription. J Biol Chem. 2000;275:20734–20741. doi: 10.1074/jbc.M908382199. [DOI] [PubMed] [Google Scholar]
- Bhat UG, Zipfel PA, Tyler DS, Gartel AL. Novel anticancer compounds induce apoptosis in melanoma cells. Cell Cycle (Georgetown, Tex) 2008;7:1851–1855. doi: 10.4161/cc.7.12.6032. [DOI] [PubMed] [Google Scholar]
- Kwok JM, Myatt SS, Marson CM, Coombes RC, Constantinidou D, Lam EW. Thiostrepton selectively targets breast cancer cells through inhibition of forkhead box M1 expression. Mol Cancer Ther. 2008;7:2022–2032. doi: 10.1158/1535-7163.MCT-08-0188. [DOI] [PubMed] [Google Scholar]
- Hegde NS, Sanders DA, Rodriguez R, Balasubramanian S. The transcription factor FOXM1 is a cellular target of the natural product thiostrepton. Nat Chem. 2011;3:725–731. doi: 10.1038/nchem.1114. [DOI] [PubMed] [Google Scholar]
- Budirahardja Y, Gönczy P. Coupling the cell cycle to development. Development. 2009;136:2861–2872. doi: 10.1242/dev.021931. [DOI] [PubMed] [Google Scholar]
- Cui H, Li T, Ding HF. Linking of N-Myc to death receptor machinery in neuroblastoma cells. J Biol Chem. 2005;280:9474–9481. doi: 10.1074/jbc.M410450200. [DOI] [PubMed] [Google Scholar]
- Cui H, Schroering A, Ding HF. p53 mediates DNA damaging drug-induced apoptosis through a caspase-9-dependent pathway in SH-SY5Y neuroblastoma cells. Mol Cancer Ther. 2002;1:679–686. [PubMed] [Google Scholar]
- Huang DW, Sherman BT, Lempicki RA. Systematic and integrative analysis of large gene lists using DAVID bioinformatics resources. Nat Protoc. 2008;4:44–57. doi: 10.1038/nprot.2008.211. [DOI] [PubMed] [Google Scholar]
- Subramanian A, Tamayo P, Mootha VK, Mukherjee S, Ebert BL, Gillette MA, et al. Gene set enrichment analysis: a knowledge-based approach for interpreting genome-wide expression profiles. Proc Natl Acad Sci USA. 2005;102:15545–15550. doi: 10.1073/pnas.0506580102. [DOI] [PMC free article] [PubMed] [Google Scholar]
- Wang X, Choi JH, Ding J, Yang L, Ngoka LC, Lee EJ, et al. HOXC9 directly regulates distinct sets of genes to coordinate diverse cellular processes during neuronal differentiation. BMC Genomics. 2013;14:830. doi: 10.1186/1471-2164-14-830. [DOI] [PMC free article] [PubMed] [Google Scholar]
- Oberthuer A, Berthold F, Warnat P, Hero B, Kahlert Y, Spitz R, et al. Customized oligonucleotide microarray gene expression-based classification of neuroblastoma patients outperforms current clinical risk stratification. J Clin Oncol. 2006;24:5070–5078. doi: 10.1200/JCO.2006.06.1879. [DOI] [PubMed] [Google Scholar]
- Chen QR, Song YK, Wei JS, Bilke S, Asgharzadeh S, Seeger RC, et al. An integrated cross-platform prognosis study on neuroblastoma patients. Genomics. 2008;92:195–203. doi: 10.1016/j.ygeno.2008.05.014. [DOI] [PMC free article] [PubMed] [Google Scholar]
Associated Data
This section collects any data citations, data availability statements, or supplementary materials included in this article.


