

Abstract
Background
Cerebrospinal fluid (CSF) has been used to identify biomarkers of neurological disease. CSF protein biomarkers identified by high-throughput methods, however, require further validation. While Western blotting (WB) is well-suited to this task, the lack of a validated loading control for CSF WB limits the method’s accuracy.
New Method
We investigated the use of total protein (TP) as a CSF WB loading control. Using iodine-based reversible membrane staining, we determined the linear range and consistency of the CSF TP signal. We then spiked green fluorescent protein (GFP) into CSF to create defined sample-to-sample differences in GFP levels that were measured by WB before and after TP loading correction. Levels of CSF complement C3 and cystatin C measured by WB with TP loading correction and ELISA in amyotrophic lateral sclerosis and healthy control CSF samples were then compared.
Results
CSF WB with the TP loading control accurately detected defined differences in GFP levels and corrected for simulated loading errors. Individual CSF sample Western blot and ELISA measurements of complement C3 and cystatin C were significantly correlated and the methods showed a comparable ability to detect between-groups differences.
Comparison with Existing Method
CSF TP staining has a greater linear dynamic range and sample-to-sample consistency than albumin, a commonly used CSF loading control. The method accurately corrects for simulated errors in loading and improves the sensitivity of CSF WB compared to using no loading control.
Conclusions
The TP staining loading control improves the sensitivity and accuracy of CSF WB results.
Keywords: cerebrospinal fluid, loading control, total protein stain, Western blot
1. Introduction
Western blotting (WB) is an antibody-based technique for the identification of protein targets transferred to a membrane following separation by polyacrylamide gel electrophoresis (PAGE). Refinements to the technique, including the use of fluorescently labeled antibodies [1, 2], imaging with high dynamic range detectors such as CCDs and photodiode arrays, and the application of morphological image processing to gels and blots [3, 4] allow multiplexed detection and quantitative measurement of proteins in biological samples.
These advances make WB a valuable tool for protein quantification and the validation of biomarkers obtained via high-throughput methods such as mass-spectrometry. While these high-throughput methods are a sensitive, unbiased means of identifying protein biomarkers, validation of putative markers by a complementary technique is imperative, as inadequate validation can lead to poor biomarker performance in a clinical setting [5-7]. The enzyme linked immunosorbent assay (ELISA) remains the “gold standard” for biomarker validation and is one of the most-widely used techniques for this purpose [8, 9]. Frequently, however, high-quality ELISA kits for newly defined candidate markers are not commercially available and developing and validating an ELISA “in-house” is time-consuming, expensive, technically challenging, and dependent on the availability of at least two highly sensitive and specific antibodies to the protein of interest. By contrast, PAGE/WB is a simple, relatively inexpensive method capable of detecting multiple forms of a given protein target, such as multimeric forms or cleavage products. These advantages, combined with the aforementioned refinements to the sensitivity and quantitative performance of the method make it a useful approach for the study of CSF proteins and the initial validation of candidate protein biomarkers.
To ensure accurate, reproducible WB results, proper correction for technical error, normalization, and processing of the data is essential. Traditionally, WB experiments have used expression levels of so-called “housekeeping genes” as loading controls to correct for differences in protein concentration or errors in loading. The assumption of this method is that the housekeeping genes (often, beta-actin, beta-tubulin, or GAPDH) are highly expressed at relatively constant levels across cells, tissues, and disease/injury types. Increasingly, however, the validity of this assumption in the analysis of cultured cells [10-12], tissue types [11, 13, 14, 15], and disease/injury states [11, 13, 14, 16, 17] has been criticized. As none of the above housekeeping proteins are considered secreted proteins, their validity as loading controls for WB of biological fluids can likewise be questioned. In place of the housekeeping proteins, normalization to total protein (TP) has emerged as a reliable loading control [4, 13, 15, 18-24]. Following PAGE, TP stains can be used directly on the gel or following transfer to a PVDF or nitrocellulose membrane. In general, these stains are linear over several orders of magnitude, correlate well with total protein levels obtained by the BCA or Bradford assays, accurately correct for errors in loading, and are reversible [4, 13, 15,18-24].
The aforementioned methods have been largely applied to WB experiments measuring protein levels in cultured cells or tissue homogenates. Whether they apply equally well to biological fluids used for biomarker discovery and validation, which typically have individual protein abundances spanning several orders of magnitude and high levels of proteins such as albumin, is unclear. One biological fluid of particular interest in the study of biomarkers of neurological disease is cerebrospinal fluid (CSF). CSF is a clear fluid that surrounds the brain and spinal cord. It arises from the secretory epithelium of the choroid plexus in the brain’s 3rd and 4th ventricles. A normal, adult human carries approximately 150 ml of CSF and this volume is turned over 3-4 times per day. The protein content of CSF varies from approximately 0.3 to 1.3 μg/μl and the most abundant CSF protein is albumin [25-27]. CSF has been used to define protein biomarkers for a host of neurological disorders, including Alzheimer’s disease (AD) [28], frontotemporal lobar degeneration (FTLD) [29], Parkinson’s disease [30], amyotrophic lateral sclerosis (ALS) [31], multiple sclerosis [32], various forms of CNS tumors [33], and schizophrenia [34], among others.
Despite its obvious utility to neurological disease biomarker research, a validated methodology and loading control for CSF biomarker validation by PAGE/WB does not exist. Previous studies using PAGE/WB of CSF samples have used a variety of loading controls, including albumin [35], transthyretin [36], and transferrin [37]. Others have used no loading control or equal CSF volume loading [38, 39]. A validated loading control for CSF WB would improve the accuracy of the obtained results. An ideal CSF loading control should be able to correct for individual differences in total protein concentration, which can be large when examining CSF from healthy and diseased individuals. Moreover, because CSF samples are obtained by invasive lumbar puncture and are often scarce in quantity, an ideal loading control should also be amenable to multiplexed PAGE/WB analysis. With these considerations in mind, we investigated the utility of TP as a loading control for CSF WB. We first defined the linear range of detection for CSF TP by gel and membrane stain. Subsequently, we used simulated experiments in which the amounts of CSF total protein and spiked green fluorescent protein (GFP) were varied individually and in tandem to evaluate total protein loading’s corrective performance. Lastly, we extend the method to the validation of two candidate biomarkers of ALS, cystatin C and complement C3 (C3). Collectively, the results demonstrate that iodine-based TP membrane staining is a reliable, reversible loading control that improves the accuracy of CSF WB.
2. Materials and Methods
2.1 CSF Samples
Lumbar puncture was used to obtain CSF samples from subjects at the University of Pittsburgh Medical Center (UPMC) upon informed patient consent. This study was approved by the UPMC institutional review board. After collection, samples were spun at 3000 rpm at 4°C for 10 minutes to remove any cells or debris. Samples were then aliquoted in small volumes and stored in low protein binding polypropylene tubes at −80°C with in 2 hours of collection. Only CSF samples without visible blood were centrifuged and hemoglobin levels in all final CSF samples were measured by ELISA to eliminate those with evidence of significant levels of hemoglobin (> 200 ng/ml), reflecting blood contamination [40, 41].
The protein concentration of all samples was measured using the BCA assay (Thermo Scientific; Rockford, IL). To minimize inter-sample variability for the evaluation of total protein staining as a loading control, we pooled CSF samples for our initial experiments. Eight pooled samples comprised of CSF from healthy, ALS, and AD subjects were created. The protein content of the pooled CSF samples ranged from 0.46 μg/μl to 0.78 μg/μl. To assess the linearity of CSF total protein, we concentrated selected pooled CSF samples using Amicon Ultra 3K cutoff columns (Millipore; Darmstadt, Germany) to permit loading higher amounts of total protein on PAGE mini gels. In some experiments, recombinant, purified GFP (Abcam; Cambridge, MA) was spiked into pooled CSF samples in nanogram amounts. For experiments measuring levels of the ALS candidate biomarkers cystatin C and C3, ten individual healthy and ten ALS subject samples were used. The protein content of these samples ranged from 0.45 μg/μl to 1.3 μg/μl and a total of 5 μg was loaded per lane for each sample.
2.2 PAGE/Electrophoretic Transfer
Prior to PAGE, CSF samples were added to a mixture containing 4x LDS sample loading buffer (2% lithium dodecyl sulfate, 10% glycerol, 200 mM Tris; pH 8.4) and DTT (50 mM final concentration). The samples were diluted with PBS to ensure equal loading volumes and heated at 70°C for 10 minutes. Samples were run on 4-12% NuPAGE Bis-Tris gradient mini gels (Life Technologies; Grand Island, NY) at 150 V using MOPS buffer (50 mM MOPS, 50 mM Tris, 0.1% SDS, 1 mM EDTA; pH 7.7). Following completion of the PAGE run, samples were transferred to Immobilon FL PVDF membrane (Millipore; Darmstadt, Germany) using Towbin buffer (192 mM glycine, 25 mM Tris). To optimize the transfer of CSF high and low molecular weight proteins, we used a ramped overnight transfer strategy, previously shown to result in improved transfer of diverse molecular weight protein mixtures to membranes [42]. Membranes were transferred at a constant 8 V for 6 hours, then a constant 16 V for 6 hours. This ramped approach improved the transfer of CSF proteins as compared to common transfer strategies (e.g., 100 V for 1 hour, or 20 V for 12-16 hours; data not shown).
2.3 Total Protein Staining
Total protein (TP) staining was performed on PAGE gels and PVDF membranes following transfer. For TP gel staining, gels were stained with Bio-Safe Coomassie (Bio-Rad; Hercules, CA) overnight at room temperature. PVDF membranes were stained for 30 minutes at 4°C w ith Blot FastStain (G-Biosciences; St. Louis, MO), a proprietary, reversible TP stain for PVDF membranes, according to the manufacturer’s instructions. Blot FastStain is a reversible total protein stain based on iodine binding that produces purple bands. Stained gels and membranes were scanned on an Odyssey CLx imager (Licor; Lincoln, NE) at 169 μm resolution. All processed images were free of pixel saturation. PVDF membranes were de-stained in ultrapure water until no bands could be detected at the highest intensity setting of the Odyssey CLx imager.
2.4 Western Blot
PVDF membranes were blotted using the Benchpro automated Western blot (WB) processing system (Life Technologies; Grand Island, NY). Membranes were blocked for 1 hour in Licor blocking buffer (Licor; Lincoln, NE), incubated in primary antibodies overnight, washed with PBS, incubated in secondary antibodies for 1 hour, washed with PBS, and imaged on the Odyssey Clx. The following primary antibodies were used: rabbit-anti-GFP (1:2,000; Life Technologies; Grand Island, NY; RRID: AB_221569), chicken-anti-GFP (1:2,500; Aves Labs; Tigard, OR; RRID: AB_10000240), mouse-anti-albumin (1: 5,000; Proteintech Labs; Chicago, IL; RRID: AB_11042320), rabbit-anti-cystatin C (1:2,000; Proteintech Labs; Chicago, IL; RRID: AB_2088058), and chicken-anti-C3 (1:3,000; Encor Biotechnology; Gainesville, FL). Secondary antibodies (1:10,000) were produced in goat to the species of the primary antibody and were conjugated with IRdye fluorophores visible in the 700 and 800 channels of the CLx imager. Images were acquired on the CLx imager at 169 μm resolution and all processed images were free of pixel saturation.
2.5 ELISA
Sandwich ELISAs were used to quantitate levels of cystatin C and C3. Cystatin C ELISAs (Biovendor; Asheville, NC) were performed according to the manufacturer’s instructions. C3 ELISAs were performed as previously described [43].
2.6 Image Processing and Data Analysis
All gel and membrane images were processed in ImageJ (National Institutes of Health; Bethesda, MD). Images were background subtracted using a rolling ball algorithm [3, 44]. Relative quantitation was performed to obtain integrated density values according to published guidelines [44, 45]. Individual values were relatively scaled to allow membrane to membrane comparisons by summing all values from a membrane and dividing each individual value by this total [46]. Quantitative protein measurements from ELISAs were obtained by fitting a linear equation to the standard curve and using this equation to calculate unknown values. Between-groups comparisons were made using the independent samples T-test with Sidak correction for multiple comparisons [47]. Correlation between values obtained by ELISA and WB were made by Pearson correlation. Data were analyzed using Excel 2010 (Microsoft; Tacoma, WA). Final figures were constructed in Illustrator CS5 (Adobe Systems; Mountainview, CA).
3. Results
3.1 CSF Total Protein Staining Signal is Linear and Consistent by Gel or Membrane Stain
To characterize the CSF total protein (TP) stain signal, we first determined the signal linearity, detection limit, and saturation limit of CSF TP by gel and membrane stain. These signals were compared to that obtained by Western blot (WB) for albumin, a previously used loading control for CSF WB [35] and the most abundant CSF protein. The results of these experiments are shown in Figure 1. The CSF TP staining signal is linear (R2 > 0.99) from 0.25 μg of total CSF protein to 20 μg by Coomassie gel stain and from 0.25 μg to 16 μg for PVDF membrane stain. By contrast, several points in total protein-albumin WB signal relationship showed clear departures from linearity (R2 = 0.97), and a higher degree of error. Following statistical analysis of the untransformed data, we used a square root transformation of values along both axes to visualize all points on the graphs in Figure 1A-C clearly. For comparison, the range of 0.25 μg to 20 μg is shown with the untransformed values for the three methods (Figure 1D). The detection limits (approximately 10 and 35 ng for gel and membrane stain, respectively) and saturation range (between 40 and 50 μg total protein for both) of each method are shown in Supplemental Figure 1.
Figure 1.

CSF Total Protein (TP) Linearity. (A) Left, Representative Coomassie stained gel of a serial dilution of increasing amounts of CSF TP ranging from 0.25 μg to 40 μg from the same sample. Right, quantification of the TP signal. Square root transformed TP amount (x axis) and sum total normalized, square root transformed integrated density (y axis) are plotted in a line-connected XY scatter graph. Data are shown as the mean ± SD for triplicate experiments using separate pooled samples. (B) Same as (A), but for PVDF membrane stain. (C) Same as (A and B), but for albumin Western blot. (D) Comparison of the untransformed values obtained by each method over the range of 0.25-20 μg total protein loading. Data are shown as the mean ± SD for triplicate experiments using separate pooled samples.
We also evaluated the sample to sample consistency of the CSF TP signal by loading identical protein amounts from each of our 8 pooled CSF samples. The results of quadruplicate experiments are shown in Figure 2. The coefficient of variation (CV; calculated as [standard deviation/mean] × 100) was used as a measure of consistency. By gel and membrane stain, CSF TP signal shows a low degree of variability, with a CV of approximately 5% by either method. The consistency of the albumin signal by WB was considerably lower, with a CV of 15.08%. This result was consistent with the data of Figure 1, where TP by gel or membrane stain showed a low degree of error, even when loading large amounts of protein (compare error bars in Figure 1D).
Figure 2.
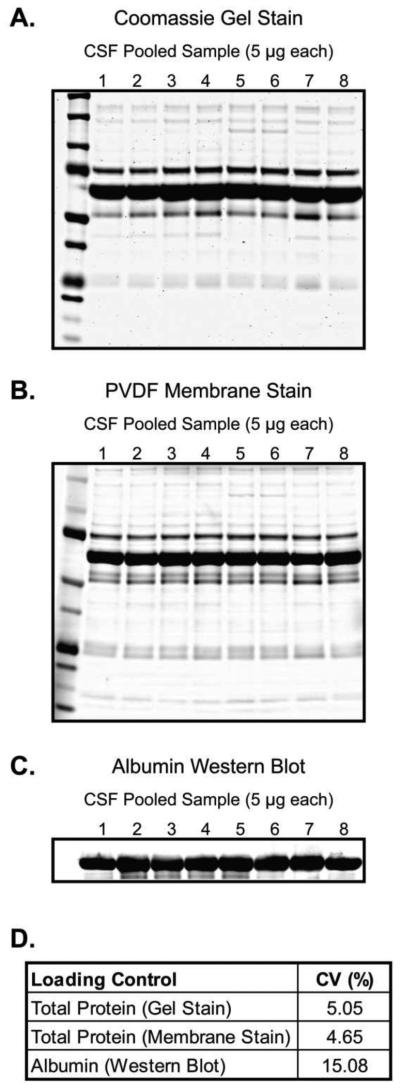
CSF Total Protein Consistency. The consistency of the CSF total protein signal was evaluated by loading 5 μg of CSF total protein from 8 separate pooled samples and measuring the resultant integrated density. (A) Representative Coomassie stained gel. (B) Same as (A), but for PVDF membrane stain. (C) Same as (A and B), but for albumin WB. (D) Summary of results. The CV ([standard deviation/mean] × 100) of quadruplicate experiments was determined.
3.2 CSF Total Protein Is An Effective Loading Control
To evaluate the performance of CSF TP staining as a loading control, we performed simulated experiments in which CSF TP and spiked-in GFP were varied in tandem and then individually. Because GFP is not found in human CSF, we could control the amount of the protein present in our pooled samples and the sample-to-sample differences in TP and GFP. We compared our measurements of individual sample TP and GFP levels to the defined, “true” values as an evaluation of the performance of TP loading correction. As gel and PVDF membrane total protein staining performed comparably (Figure 1D), results from GFP spiking experiments are shown only with the PVDF membrane stain as a loading control. This allowed for reversible detection of total protein, multiplexed blotting using two anti-GFP antibodies, and accounts for variability introduced by the electrophoretic transfer process.
The results of these experiments are presented in Figure 3. For the first experiment, we simulated extreme error in loading by varying the amount of CSF TP and GFP in tandem. In this experiment the ratio of GFP to total protein was constant across an 8 fold change in TP and GFP (1.25-10 μg total protein; 25-200 ng GFP; Figure 3A). The TP and GFP signal was linear across this range of values (R2 > 0.99 for both). Correction with an ideal loading control in this example should produce identical values for all samples when the data are normalized by sum total. As shown in Figure 3A, correction by TP signal is able to correct for the loading error (m = 0.0002 in the y = mx + b equation, where m expected = 0) and produced relatively consistent values (range = 0.19 to 0.22 for the expected 0.2 corrected value). The corrective performance is inversely related to the amount of TP, with the worst performance occurring at the highest amount of TP.
Figure 3.

Corrective Performance of CSF Total Protein (TP) Loading Control. (A) Left, Representative images of in-tandem varying spiked GFP and CSF TP. Right, quantification of the corrected (red squares) and uncorrected (green triangles) normalized integrated density values obtained for each band. (B) Left, representative images of a serially diluted CSF TP stained membrane and equal loading GFP WB are shown. Right, quantification of the resultant uncorrected and corrected normalized integrated density values against the true value based on GFP concentration. (C) Left, representative images of a constant TP stained membrane and two-fold difference loaded GFP WB are shown. Right, the resultant fold-difference obtained from the uncorrected and corrected values is plotted against the true two-fold difference for triplicate experiments. Plots in (A) and (B) represent the mean ± SD of triplicate experiments.
In the second simulation experiment, we varied the amount of TP (2.5-10 μg), but kept the amount of GFP constant (100 ng). This experiment simulates a WB experiment where different concentrations of a protein are found across samples. Loading by total protein followed by correction with an appropriate loading control should, therefore, lead to observable differences in measured values across samples. As shown in Figure 3B, TP loading correction results in values that approximate the true observed differences. By contrast, the uncorrected values are similar (range = 0.24-0.27 for the expected uncorrected value of 0.25). We observed declining performance of the loading control at the upper range of TP, consistent with the previous experiment.
For the final simulation experiment, we loaded constant amounts of TP (5 μg; CSF TP plus GFP) and created a two-fold difference in GFP across samples (100-200 ng). Figure 3C shows that the uncorrected values obtained from this experiment underestimate the true fold difference (1.64, 36% error). TP loading correction, however, allows more accurate determination of fold differences across samples (1.93, 7% error). Collectively, these experiments show that CSF TP can correct for errors in loading and permits accurate detection of true differences in protein abundance.
3.3 Application to the Study of Candidate ALS CSF Biomarkers
In the final phase of this study, we compared the performance of WB and TP staining to ELISA in the measurement of levels of two candidate ALS biomarkers, complement C3 (C3) and cystatin C [43, 48-51], in CSF from five ALS and five healthy control subjects for each protein. To permit comparisons across blots and platforms, we first multiplied the concentration of C3 or cystatin C obtained by ELISA by the volume of CSF loaded for each sample (5 μg TP) to generate “true” values for each subject. Next, these values and obtained WB values were normalized by sum total normalization [46]. To do so, all values for a given blot or ELISA were summed and each data point divided by this value. This scales all values from 0-1, with the number corresponding to each data point’s proportion of the total signal. The resultant values were used to compare individual CSF sample measurements and relative between-groups differences of total protein, C3, and cystatin C obtained by each method.
For C3, we performed WB in triplicate and ELISAs in quadruplicate for five ALS and five healthy control CSF samples. The results of these experiments are shown in Figure 4A-D. Using TP staining of the PVDF membrane, we did not detect significant differences between-groups (p = .13; Figure 4A, D). By WB corrected by TP loading and ELISA, we detected a significant increase in total C3 levels in the CSF of ALS patients compared to controls (p = 0.01 by WB; p = 0.03 by ELISA; Figure 4B, D). We then assessed the correlation of the ELISA and WB results on a sample to sample basis. In general, there was a high degree of agreement between the two methodologies (Pearson r = 0.90; average error = 14.39%; Figure 4C) and the total protein corrected values showed a greater degree of correlation than the uncorrected values (r = 0.90 and 0.673, respectively; Table 1). C3 is extensively proteolytically cleaved to generate fragments with cell signaling functions. Electrophoretic separation via PAGE permits examination of the individual C3 fragments, in addition to total C3 levels. Using this information, we also found that levels of C3α were not significantly different between-groups (p = 0.07), while levels of C3β were statistically significant between-groups (p = 0.028; Figure 4B, D).
Figure 4.

Application of Total Protein (TP) Loading Correction to Candidate ALS CSF Biomarkers. (A) Representative TP stained membrane of 5 μg total loading for 5 healthy control and 5 ALS CSF samples. (B) Representative WB of complement C3 in the CSF of above healthy control and ALS CSF samples. (C) Plot comparing normalized, relative individual subject C3 levels obtained by ELISA and TP corrected WB from the above CSF samples. (D) Plot comparing normalized, relative between-groups differences for TP, C3α, C3β, total C3 WB, and total C3 ELISA. * = corrected p < 0.05. (E-H) Same as (A-D), respectively, but for cystatin C in a second set of 5 ALS and 5 healthy control CSF samples. Plots A-D represent the mean ± SD of triplicate WB experiments, E-H quadruplicate WB experiments, and all plots show quadruplicate ELISA results.
Table 1.
Summary of Complement C3 and Cystatin C data. A summary of group data obtained by ELISA and WB is shown. ELISA/WB Proportion = the mean indicated group proportion of the total signal, p ELISA/WB = the Sidak-corrected, independent samples t-test p value for the between-groups healthy control-ALS comparison, % WB error = the average percentage error for the WB-ELISA comparison of each sample, ELISA-WB r = the Pearson correlation coefficient of the ELISA-WB values obtained for each sample, TPLC = total protein loading control corrected value, No TPLC = value obtained with no total protein loading control correction, p r = the p value of the correlation coefficient indicated in the ELISA-WB r column.
| ELISA Proportion | WB Proportion | p ELISA | p WB | % WB Error | ELISA-WB r | p r | |||
| Complement C3 | Control | ALS | Control | ALS | TPLC | TPLC | |||
| Total C3 | 0.0751 | 0.125 | 0.0772 | 0.123 | 0.03 | 0.01 | 14.39 | 0.9 | > 0.001 |
| C3α | n/a | n/a | 0.0827 | 0.117 | n/a | 0.07 | No TPLC | No TPLC | |
| C3β | n/a | n/a | 0.0405 | 0.159 | n/a | 0.028 | 0.673 | 0.0329 | |
| Total Protein | 0.1 | 0.1 | 0.109 | 0.0903 | 0 | 0.13 | |||
| ELISA Proportion | WB portion | p ELISA | p WB | % WB Error | ELISA-WB r | p r | |||
| Cystatin C | Control | ALS | Control | ALS | TPLC | TPLC | |||
| Total Cystatin C | 0.134 | 0.659 | 0.118 | 0.0817 | 0.013 | 0.038 | 31.24 | 0.654 | 0.04 |
| Total Protein | 0.1 | 0.1 | 0.0982 | 0.101 | 0 | 0.79 | No TPLC | No TPLC | |
| 0.507 | 0.134 | ||||||||
Cystatin C ELISAs and WBs were performed in quadruplicate for a second set of five ALS and five healthy control CSF samples. These results are shown in Figure 4E-H. By PVDF membrane stain, we did not detect significant differences in TP signal between-groups (p = 0.79; Figure 4E, H). A significant decrease in cystatin C was, however, observed in the ALS group compared to the control group by ELISA (p = .013) and TP corrected WB (p = 0.038; Figure 4F, H). While the agreement between platforms was not as strong as that obtained for C3, we still observed significant correspondence between the two methods (Pearson r = 0.654, p = 0.040); average error = 31.24%). As with C3, correction of the WB signal by total protein staining improved the correlation of WB and ELISA results (rcorrected = 0.654, runcorrected = 0.507; Table 1). Removing ALS sample 2, which had unexpectedly high WB signal and error (161%) reduces the overall average error to 15.06% (Figure 4G). The data from these and the C3 experiments are summarized in Table 1.
4. Discussion
Total protein (TP) staining has emerged as a reliable and accurate loading control for Western blots (WB) of cell and tissue lysates [4, 13, 15,18-24]. Whether it is similarly useful for the blotting of cerebrospinal fluid (CSF) has not been investigated. Moreover, while a variety of CSF WB loading controls have been used previously [35-39], their linearity, consistency, and corrective performance have not been evaluated directly. Here, we define the linearity and consistency of CSF TP gel and membrane staining, assess its corrective performance as a loading control in simulated experiments, and compare its performance to results obtained by ELISA for the validation of two candidate ALS biomarkers.
Previous studies have demonstrated an extensive linear range of TP staining, often spanning several orders of magnitude, using a variety of reagents [4, 13, 15,18-24]. In the present study, we observe a lower saturation range (between 40-50 μg; Figure S1) and upper limit to the linear range (16 μg by PVDF membrane stain and up to 20 μg by Coomassie gel stain versus between 4-8 μg by albumin; Figure 1D). This result is not surprising, however, as albumin is estimated to comprise at least 60% of the protein content of CSF [52, 53]. Thus, saturation of the albumin signal occurs rapidly, limiting the overall linearity of the CSF TP signal. Nevertheless, it should be noted that the linear range we observe extends from volumes of less than 1 μl of CSF to the maximum permissible on a mini-gel for typical CSF TP concentrations by either PVDF membrane or gel stain. Staining a duplicated Coomassie gel has been suggested as a corrective control for Western blots previously [13] and we demonstrate the larger dynamic range of this method relative to PVDF membrane staining, consistent with prior reports [4]. We, however, recommend using the membrane stain as a loading control. Membrane staining accounts for inconsistencies and loss of protein caused by the transfer of proteins from the gel to the membrane. Moreover, using a reversible membrane stain obviates the need to run a duplicate gel.
The sample to sample consistency is also an important consideration when choosing a loading control for WB. Using pooled samples, we found that the consistency of CSF TP signal by gel or membrane stain was high (approximately 5% CV by either method; Figure 2D). Likewise, we observed very low variability from gel to gel by either method while assessing the linearity of CSF TP (Figure 1A, B). By contrast, the TP staining pattern for our individual ALS and healthy control samples was more variable (Figure 4A, E). Several factors could account for this. First, our pooled CSF samples were largely homogenous in terms of their TP content, spanning less than a two-fold range, unlike the individual ALS and healthy control samples, which spanned a three-fold range. Thus, technical errors and instrument imprecision would be expected to produce larger variability in our individual samples as compared to the pooled samples. Second, our individual samples comprised ALS and healthy control subjects. Large differences in protein content (including albumin levels) between disease and control CSF samples are well documented [27, 54-57]. These differences are likely averaged out in the pooled samples, which comprise ALS, AD, and healthy control subjects. Importantly then, the results from our pooled samples likely reflect the true consistency of the method, as they are relatively unaffected by pre-analytical factors.
While albumin is the most abundant protein in CSF by several orders of magnitude, and thus a likely candidate for use as a loading control [35], we provide several compelling reasons to avoid using it for this purpose in CSF WB. First, by WB, the linear range and consistency of albumin is considerably less than that observed for CSF TP gel or membrane stain (Figures 1 and 2). This is likely due to saturating amounts of albumin on the surface of the membrane, resulting in a signal that is not reflective of the true protein content. In addition, using a TP stained gel or reversible membrane stain allows the user to analyze total protein and then examine multiple individual protein targets on the same membrane. This is a relevant consideration given that CSF sample volumes are often limited due to the nature of the collection procedure. CSF albumin levels have also been shown to change in response to various diseases [58-61], making its utility as a loading control questionable. Lastly, while the albumin band alone can be used for normalization following gel or membrane TP staining, its corrective performance and linear range is less than that of the TP signal collectively (data not shown).
The corrective performance of a loading control is a consideration of equal importance to its linearity and consistency. We evaluated the corrective performance of CSF TP as a loading control using simulated experiments in which known amounts of GFP were spiked into CSF. The amount of GFP and CSF TP were varied, first in tandem, and then separately (Figure 3A-C, respectively). The results of these experiments indicate that the CSF TP loading control is capable of correcting for large errors in sample loading (Figure 3A) and permits accurate detection of true differences in protein concentration and abundance (Figure 3B, C). The corrective performance of the total protein loading control began to deteriorate at the highest levels of CSF total protein (10 μg). Nevertheless, the range of corrective ability (8 fold; Figure 3A) vastly exceeds what would be expected by individual sample variability, technical error, or instrument variability when loading by TP amount or CSF volume.
After testing the ability of the TP stain to correct for errors in simulated experiments, we extended the approach to the study of candidate CSF biomarkers for ALS by blotting for C3 and cystatin C. Using sum total normalization, we converted values obtained by WB and ELISA to their corresponding relative proportions. While this results in the loss of quantitative information from the ELISAs, it permits a cross-platform comparison of the ability of each method to detect relative differences in protein abundance. Using the TP loading control, we observed significant correlation between the normalized ELISA and WB data and comparable sensitivity in detecting differences in target protein abundance (Figure 4; Table 1). Further, we highlight the utility of PAGE-based protein separation by showing a significant elevation of the C3β, but not C3α, fragment in ALS samples relative to controls. The performance of the TP corrected WB method was not as high when blotting for cystatin C, although much of the increased error was a result of an unexpectedly high value from a single ALS sample. Nevertheless, we still detected a significant reduction in cystatin C levels between-groups, consistent with previous studies [49-51]. While ELISA, by virtue of its greater dynamic range, sensitivity, and quantitative accuracy, will remain the preferred method for validating CSF biomarkers, our results demonstrate that WB can be a useful and economical method for the assessment of relative protein levels in CSF samples.
A variety of total protein stains have been used as loading controls for WB [4, 13, 15,18-24]. We predict that many of these will be suitable for CSF WB. The choice of stain will be predicated on study goals and available resources. Given the unique protein composition of CSF, which is at least 60% albumin [52, 53] and typically has a total protein concentration of at least 0.4 μg/μl, sensitivity and signal saturation are unlikely to be primary concerns. For a study seeking to probe low-abundance proteins in CSF by WB at typical linear detection levels (nanogram range), a microgram amount of CSF total protein will almost certainly be required, which is far greater than the nanogram amount detection limits of the stains characterized here and elsewhere [4, 13, 15,18-24]. Likewise, the saturation limit of the stains characterized here was only reached following concentration of CSF samples. Reversibility, conversely, is an important consideration, especially with human CSF samples, which are often of limited volume. The iodine-based stain used for this study was completely reversible within 10 minutes using distilled water washes, providing fast and mild destaining conditions. By contrast destaining is longer and harsher with stains such as Coomassie and Ponceau, and the more recently characterized Direct Blue 71 [19]. We observed a greater sensitivity of Coomassie gel staining of CSF total protein than PVDF membrane staining (Figure S1). This is likely due to the difficulty of electrophoretically transferring small amounts of CSF to PVDF membrane, however, as we observe a sensitivity of 2 ng by dot blot with the iodine-based stain used here (data not shown). This is comparable to the sensitivity of epicocconone based stains [15], which for their reversibility, sensitivity, and linear range are also useful total protein stains for TP loading control. Trihalo-based tryptophan fluorescence (stain-free) [4] has emerged as another promising means of using total protein as a loading control. The signal is linear over a range comparable to that observed here, although with lower sensitivity. The main drawback of the method appears to be the cost of the required gels and imaging system. The novel loading control evaluation method we present (Figure 3) will allow researchers to determine which total protein stain works best with their protein of interest, sample and membrane type, and image acquisition system. The method as presented could easily be adapted to cell or tissue lysates and GFP substituted for another protein known not to occur in the sample tested, if needed.
CSF has proven to be useful for the discovery of neurological disease biomarkers and basic research on the CNS. As recent efforts at defining the CSF proteome have illustrated, there is a diverse array of proteins found in both healthy and diseased CSF [37, 62, 63]. WB remains an indispensable technique for the study of protein mass, modifications, and relative abundance in the CSF. Recent studies have emphasized, however, that levels of CSF proteins can be relatively unstable and influenced by a variety of pre-analytical factors [64-67]. These observations and the range of total protein concentrations observed across diseases makes clear the need for a corrective loading control for CSF WB. We have demonstrated that CSF TP is a linear, consistent, and accurate loading control well-suited to this purpose.
Supplementary Material
Highlights.
CSF total protein (TP) gel and membrane staining is linear and consistent.
TP staining is an effective loading control for CSF Western blots (WB).
The TP loading control outperforms albumin as a CSF WB loading control.
The TP loading control improves the sensitivity and accuracy of CSF WB.
5. Acknowledgements
This work was supported by National Institutes of Health/National Institutes of Neurological Disorders and Stroke grants NS068179 and NS061867 to RB, National Institutes of Health/National Institutes of Neurological Disorders and Stroke grant F31NS080614-01 to MC, and by an award from the Achievement Rewards for College Scientists Foundation, Inc. Pittsburgh Chapter to MC.
We wish to acknowledge technical assistance from Chassidy Johnson and Mary Jensen of Licor Biosciences and thank all patients for their participation in this study.
Abbreviations
- TP
total protein
- WB
Western blot
- CSF
cerebrospinal fluid
- GFP
green fluorescent protein
Footnotes
Publisher's Disclaimer: This is a PDF file of an unedited manuscript that has been accepted for publication. As a service to our customers we are providing this early version of the manuscript. The manuscript will undergo copyediting, typesetting, and review of the resulting proof before it is published in its final citable form. Please note that during the production process errors may be discovered which could affect the content, and all legal disclaimers that apply to the journal pertain.
6. Conflict of Interest Statement
RB is a founder of Knopp Biosciences LLC and Iron Horse Diagnostics Inc., two companies focused on therapeutics and diagnostic assays for neurologic disorders including ALS.
7. References
- [1].Dubitsky A, DeCollibus D, Ortolano GA. Sensitive fluorescent detection of protein on nylon membranes. J Biochem Biophys Methods. 2002;51:47–56. doi: 10.1016/s0165-022x(01)00243-3. [DOI] [PubMed] [Google Scholar]
- [2].Gingrich JC, Davis DR, Nguyen Q. Multiplex detection and quantitation of proteins on western blots using fluorescent probes. Biotechniques. 2000;29:636–642. doi: 10.2144/00293pf02. [DOI] [PubMed] [Google Scholar]
- [3].Sternberg SR. Biomedial image processing. IEEE Trans Comput. 1983;32:22–34. [Google Scholar]
- [4].Taylor SC, Berkelman T, Yadav G, Hammond M. A defined methodology for reliable quantification of Western blot data. Mol Biotechnol. 2013;55:217–226. doi: 10.1007/s12033-013-9672-6. [DOI] [PMC free article] [PubMed] [Google Scholar]
- [5].Pepe MS, Etzioni R, Feng Z, Potter JD, et al. Phases of biomarker development for early detection of cancer. J Natl Cancer Inst. 2001;93:1054–1061. doi: 10.1093/jnci/93.14.1054. [DOI] [PubMed] [Google Scholar]
- [6].Barker PE. Cancer biomarker validation: standards and process: roles for the National Institute of Standards and Technology (NIST) Ann N Y Acad Sci. 2003;983:142–150. doi: 10.1111/j.1749-6632.2003.tb05969.x. [DOI] [PubMed] [Google Scholar]
- [7].Cummings J, Ward TH, Greystoke A, Ranson M, et al. Biomarker method validation in anticancer drug development. Br J Pharmacol. 2008;153:646–656. doi: 10.1038/sj.bjp.0707441. [DOI] [PMC free article] [PubMed] [Google Scholar]
- [8].Kohler K, Seitz H. Validation processes of protein biomarkers in serum-a cross platform comparison. Sensors. 2012;12:12710–12728. doi: 10.3390/s120912710. [DOI] [PMC free article] [PubMed] [Google Scholar]
- [9].Gao J, Garulacan LA, Storm SM, Opiteck GJ, et al. Biomarker discovery in biological fluids. Methods. 2005;35:291–302. doi: 10.1016/j.ymeth.2004.08.020. [DOI] [PubMed] [Google Scholar]
- [10].Greer S, Honeywell R, Geletu M, Arulanandam R, et al. Housekeeping genes; expression levels may change with density of cultured cells. J Immunol Methods. 2010;355:76–79. doi: 10.1016/j.jim.2010.02.006. [DOI] [PubMed] [Google Scholar]
- [11].Ferguson RE, Carroll HP, Harris A, Maher ER, et al. Housekeeping proteins: a preliminary study illustrating some limitations as useful references in protein expression studies. Proteomics. 2005;5:566–571. doi: 10.1002/pmic.200400941. [DOI] [PubMed] [Google Scholar]
- [12].Sikand K, Singh J, Ebron JS, Shukla GC. Housekeeping gene selection advisory: glyceraldehyde-3-phosphate dehydrogenase (GAPDH) and beta-actin are targets of miR-644a. PLoS One. 2012;7:e47510. doi: 10.1371/journal.pone.0047510. [DOI] [PMC free article] [PubMed] [Google Scholar]
- [13].Eaton SL, Roche SL, Llavero Hurtado M, Oldknow KJ, et al. Total protein analysis as a reliable loading control for quantitative fluorescent Western blotting. PLoS One. 2013;8:e72457. doi: 10.1371/journal.pone.0072457. [DOI] [PMC free article] [PubMed] [Google Scholar]
- [14].Perez-Perez R, Lopez JA, Garcia-Santos E, Camafeita E, et al. Uncovering suitable reference proteins for expression studies in human adipose tissue with relevance to obesity. PLoS One. 2012;7:e30326. doi: 10.1371/journal.pone.0030326. [DOI] [PMC free article] [PubMed] [Google Scholar]
- [15].Moritz CP, Marz SX, Reiss R, Schulenborg T, Friauf E. Epicocconone Staining: A Powerful Loading Control for Western Blots. Proteomics. 2014;14:162–168. doi: 10.1002/pmic.201300089. [DOI] [PubMed] [Google Scholar]
- [16].Liu NK, Xu XM. Beta-tubulin is a more suitable internal control than beta-actin in western blot analysis of spinal cord tissues after traumatic injury. J Neurotrauma. 2006;23:1794–1801. doi: 10.1089/neu.2006.23.1794. [DOI] [PubMed] [Google Scholar]
- [17].Krzystek-Korpacka M, Diakowska D, Bania J, Gamian A. Expression stability of common housekeeping genes is differently affected by bowel inflammation and cancer: implications for finding suitable normalizers for inflammatory bowel disease studies. Inflamm Bowel Dis. 2014;20:1147–1156. doi: 10.1097/MIB.0000000000000067. [DOI] [PubMed] [Google Scholar]
- [18].Welinder C, Ekblad L. Coomassie staining as loading control in western blot analysis. J Proteome Res. 2011;10:1416–1419. doi: 10.1021/pr1011476. [DOI] [PubMed] [Google Scholar]
- [19].Zeng L, Guo J, Xu HB, Huang R, et al. Direct Blue 71 staining as a destaining-free alternative loading control method for Western blotting. Electrophoresis. 2013;34:2234–2239. doi: 10.1002/elps.201300140. [DOI] [PubMed] [Google Scholar]
- [20].Gilda JE, Gomes AV. Stain-Free total protein staining is a superior loading control to beta-actin for Western blots. Anal Biochem. 2013;440:186–188. doi: 10.1016/j.ab.2013.05.027. [DOI] [PMC free article] [PubMed] [Google Scholar]
- [21].Aldridge GM, Podrebarac DM, Greenough WT, Weiler IJ. The use of total protein stains as loading controls: an alternative to high-abundance single-protein controls in semi-quantitative immunoblotting. J Neurosci Methods. 2008;172:250–254. doi: 10.1016/j.jneumeth.2008.05.00. [DOI] [PMC free article] [PubMed] [Google Scholar]
- [22].Rivero-Gutierrez B, Anzola A, Martinez-Augustin O, Sanchez de Medina F. Stain-free detection as loading control alternative to Ponceau and housekeeping protein immunodetection in Western blotting. Anal Biochem. 2014 doi: 10.1016/j.ab.2014.08.027. [DOI] [PubMed] [Google Scholar]
- [23].Romero-Calvo I, Ocon B, Martinez-Moya P, Suarez MD, et al. Reversible ponceau staining as a loading control alternative to actin in western lots. Anal Biochem. 2010;401:318–320. doi: 10.1016/j.ab.2010.02.036. [DOI] [PubMed] [Google Scholar]
- [24].Klein D, Kern RM, Sokol RZ. A method for quantification and correction of proteins after transfer to immobilization membranes. Biochem Mol Biol Int. 1995;36:59–66. [PubMed] [Google Scholar]
- [25].Conly JM, Ronald AR. Cerebrospinal fluid as a diagnostic body fluid. Am J Med. 1983;75:102–108. doi: 10.1016/0002-9343(83)90080-3. [DOI] [PubMed] [Google Scholar]
- [26].Cushing H. Studies on the Cerebro-Spinal Fluid : I. Introduction. J Med Res. 1914;31:1–19. [PMC free article] [PubMed] [Google Scholar]
- [27].Zappaterra MW, Lehtinen MK. The cerebrospinal fluid: regulator of neurogenesis, behavior, and beyond. Cell Mol Life Sci. 2012;69:2863–2878. doi: 10.1007/s00018-012-0957-x. [DOI] [PMC free article] [PubMed] [Google Scholar]
- [28].Rosenmann H. CSF biomarkers for amyloid and tau pathology in Alzheimer's disease. J Mol Neurosci. 2012;47:1–14. doi: 10.1007/s12031-011-9665-5. [DOI] [PubMed] [Google Scholar]
- [29].Hu WT, Watts K, Grossman M, Glass J, et al. Reduced CSF p-Tau181 to Tau ratio is a biomarker for FTLD-TDP. Neurology. 2013;81:1945–1952. doi: 10.1212/01.wnl.0000436625.63650.27. [DOI] [PMC free article] [PubMed] [Google Scholar]
- [30].LeWitt P. Recent advances in CSF biomarkers for Parkinson's disease. Parkinsonism Relat Disord. 2012;18(Suppl 1):S49–51. doi: 10.1016/S1353-8020(11)70017-7. [DOI] [PubMed] [Google Scholar]
- [31].Ranganathan S, Williams E, Ganchev P, Gopalakrishnan V, et al. Proteomic profiling of cerebrospinal fluid identifies biomarkers for amyotrophic lateral sclerosis. J Neurochem. 2005;95:1461–1471. doi: 10.1111/j.1471-4159.2005.03478.x. [DOI] [PMC free article] [PubMed] [Google Scholar]
- [32].Madeddu R, Farace C, Tolu P, Solinas G, et al. Cytoskeletal proteins in the cerebrospinal fluid as biomarker of multiple sclerosis. Neurol Sci. 2013;34:181–186. doi: 10.1007/s10072-012-0974-4. [DOI] [PubMed] [Google Scholar]
- [33].Kalinina J, Peng J, Ritchie JC, Van Meir EG. Proteomics of gliomas: initial biomarker discovery and evolution of technology. Neuro Oncol. 2011;13:926–942. doi: 10.1093/neuonc/nor078. [DOI] [PMC free article] [PubMed] [Google Scholar]
- [34].Schwarz E, Bahn S. Cerebrospinal fluid: identification of diagnostic markers for schizophrenia. Expert Rev Mol Diagn. 2008;8:209–216. doi: 10.1586/14737159.8.2.209. [DOI] [PubMed] [Google Scholar]
- [35].Suon S, Zhao J, Villarreal SA, Anumula N, et al. Systemic treatment with liver × receptor agonists raises apolipoprotein E, cholesterol, and amyloid-beta peptides in the cerebral spinal fluid of rats. Mol Neurodegener. 2010;5:44. doi: 10.1186/1750-1326-5-44. [DOI] [PMC free article] [PubMed] [Google Scholar]
- [36].Khwaja FW, Duke-Cohan JS, Brat DJ, Van Meir EG. Attractin is elevated in the cerebrospinal fluid of patients with malignant astrocytoma and mediates glioma cell migration. Clin Cancer Res. 2006;12:6331–6336. doi: 10.1158/1078-0432.CCR-06-1296. [DOI] [PubMed] [Google Scholar]
- [37].Light M, Minor KH, DeWitt P, Jasper KH, et al. Multiplex array proteomics detects increased MMP-8 in CSF after spinal cord injury. J Neuroinflammation. 2012;9:122. doi: 10.1186/1742-2094-9-122. [DOI] [PMC free article] [PubMed] [Google Scholar]
- [38].Castaneyra-Ruiz L, Gonzalez-Marrero I, Gonzalez-Toledo JM, Castaneyra-Ruiz A, et al. Aquaporin-4 expression in the cerebrospinal fluid in congenital human hydrocephalus. Fluids Barriers CNS. 2013;10:18. doi: 10.1186/2045-8118-10-18. [DOI] [PMC free article] [PubMed] [Google Scholar]
- [39].Ditzen C, Tang N, Jastorff AM, Teplytska L, et al. Cerebrospinal fluid biomarkers for major depression confirm relevance of associated pathophysiology. Neuropsychopharmacology. 2012;37:1013–1025. doi: 10.1038/npp.2011.285. [DOI] [PMC free article] [PubMed] [Google Scholar]
- [40].You JS, Gelfanova V, Knierman MD, Witzmann FA, et al. The impact of blood contamination on the proteome of cerebrospinal fluid. Proteomics. 2005;5:290–296. doi: 10.1002/pmic.200400889. [DOI] [PubMed] [Google Scholar]
- [41].Hong Z, Shi M, Chung KA, Quinn JF, et al. Dj-1 and alpha-synuclein in human cerebrospinal fluid as biomarkers of parkinson's disease. Brain. 2010;133:713–726. doi: 10.1093/brain/awq008. [DOI] [PMC free article] [PubMed] [Google Scholar]
- [42].Otter T, King SM, Witman GB. A two-step procedure for efficient electrotransfer of both high-molecular-weight (greater than 400,000) and low-molecular-weight (less than 20,000) proteins. Anal Biochem. 1987;162:370–377. doi: 10.1016/0003-2697(87)90406-4. [DOI] [PubMed] [Google Scholar]
- [43].Ganesalingam J, An J, Shaw CE, Shaw G, et al. Combination of neurofilament heavy chain and complement C3 as CSF biomarkers for ALS. J Neurochem. 2011;117:528–537. doi: 10.1111/j.1471-4159.2011.07224.x. [DOI] [PMC free article] [PubMed] [Google Scholar]
- [44].Ferreira T, Rasband WS. ImageJ User Guide — IJ□1.46. 2010-2012 imagej.nih.gov/ij/docs/guide/
- [45].Gassmann M, Grenacher B, Rohde B, Vogel J. Quantifying Western blots: pitfalls of densitometry. Electrophoresis. 2009;30:1845–1855. doi: 10.1002/elps.200800720. [DOI] [PubMed] [Google Scholar]
- [46].Degasperi A, Birtwistle MR, Volinsky N, Rauch J, et al. Evaluating strategies to normalise biological replicates of Western blot data. PLoS One. 2014;9:e87293. doi: 10.1371/journal.pone.0087293. [DOI] [PMC free article] [PubMed] [Google Scholar]
- [47].Sidák ZK. Rectangular confidence regions for the means of multivariate normal distributions. J Am Stat Assoc. 1967;62:626–633. [Google Scholar]
- [48].Goldknopf IL, Sheta EA, Bryson J, Folsom B, et al. Complement C3c and related protein biomarkers in amyotrophic lateral sclerosis and Parkinson's disease. Biochem Biophys Res Commun. 2006;342:1034–1039. doi: 10.1016/j.bbrc.2006.02.051. [DOI] [PubMed] [Google Scholar]
- [49].Wilson ME, Boumaza I, Lacomis D, Bowser R. Cystatin C: a candidate biomarker for amyotrophic lateral sclerosis. PLoS One. 2010;5:e15133. doi: 10.1371/journal.pone.0015133. [DOI] [PMC free article] [PubMed] [Google Scholar]
- [50].Tsuji-Akimoto S, Yabe I, Niino M, Kikuchi S, et al. Cystatin C in cerebrospinal fluid as a biomarker of ALS. Neurosci Lett. 2009;452:52–55. doi: 10.1016/j.neulet.2009.01.026. [DOI] [PubMed] [Google Scholar]
- [51].Ranganathan S, Williams E, Ganchev P, Gopalakrishnan V, et al. Proteomic profiling of cerebrospinal fluid identifies biomarkers for amyotrophic lateral sclerosis. J Neurochem. 2005;95:1461–1471. doi: 10.1111/j.1471-4159.2005.03478.x. [DOI] [PMC free article] [PubMed] [Google Scholar]
- [52].Roche S, Gabelle A, Lehmann S. Clinical proteomics of the cerebrospinal fluid: Towards the discovery of new biomarkers. Proteomics Clin Appl. 2008;2:428–436. doi: 10.1002/prca.200780040. [DOI] [PubMed] [Google Scholar]
- [53].Wong M, Schlaggar BL, Buller RS, Storch GA, et al. Cerebrospinal fluid protein concentration in pediatric patients: defining clinically relevant reference values. Arch Pediatr Adolesc Med. 2000;154:827–831. doi: 10.1001/archpedi.154.8.827. [DOI] [PubMed] [Google Scholar]
- [54].Katila O, Lappalainen A. Fluctuations in the total protein content of the cerebrospinal fluid in patients with neurosyphilis. Duodecim. 1960;76:61–68. [PubMed] [Google Scholar]
- [55].Papadopoulos NM, Hess WC, O'Doherty D, Mc LJ. A procedure for the determination of cerebrospinal fluid total protein and gamma globulin in neurologic disorders. Clin Chem. 1959;5:569–574. [PubMed] [Google Scholar]
- [56].Lush B, Crowley MF, Fletcher E, Buchan JF. Total and differential protein levels in the blood and cerebrospinal fluid in rheumatoid arthritis. Ann Rheum Dis. 1951;10:153–162. doi: 10.1136/ard.10.2.153. [DOI] [PMC free article] [PubMed] [Google Scholar]
- [57].Roberts-Thomson PJ, Esiri MM, Young AC, Maclennan IC. Cerebrospinal fluid immunoglobulin quotients, kappa/lambda ratios, and viral antibody titres in neurological disease. J Clin Pathol. 1976;29:1105–1115. doi: 10.1136/jcp.29.12.1105. [DOI] [PMC free article] [PubMed] [Google Scholar]
- [58].Ghasemzadeh N, Nyberg F, Hjerten S. Highly selective artificial gel antibodies for detection and quantification of biomarkers in clinical samples. II. Albumin in body fluids of patients with neurological disorders. J Sep Sci. 2008;31:3954–3958. doi: 10.1002/jssc.200800386. [DOI] [PubMed] [Google Scholar]
- [59].Li X, Miyajima M, Mineki R, Taka H, et al. Analysis of potential diagnostic biomarkers in cerebrospinal fluid of idiopathic normal pressure hydrocephalus by proteomics. Acta Neurochir (Wien) 2006;148:859–864. doi: 10.1007/s00701-006-0787-4. [DOI] [PubMed] [Google Scholar]
- [60].Sidor MM, Sakic B, Malinowski PM, Ballok DA, et al. Elevated immunoglobulin levels in the cerebrospinal fluid from lupus-prone mice. J Neuroimmunol. 2005;165:104–113. doi: 10.1016/j.jneuroim.2005.04.022. [DOI] [PMC free article] [PubMed] [Google Scholar]
- [61].Davidsson P, Sjogren M, Andreasen N, Lindbjer M, et al. Studies of the pathophysiological mechanisms in frontotemporal dementia by proteome analysis of CSF proteins. Brain Res Mol Brain Res. 2002;109:128–133. doi: 10.1016/s0169-328x(02)00549-1. [DOI] [PubMed] [Google Scholar]
- [62].Guldbrandsen A, Vethe H, Farag Y, Oveland E, et al. In-depth Characterization of the Cerebrospinal Fluid (CSF) Proteome Displayed Through the CSF Proteome Resource (CSF-PR) Mol Cell Proteomics. 2014;13:3152–3163. doi: 10.1074/mcp.M114.038554. [DOI] [PMC free article] [PubMed] [Google Scholar]
- [63].Schutzer SE, Liu T, Natelson BH, Angel TE, et al. Establishing the proteome of normal human cerebrospinal fluid. PLoS One. 2010;5:e10980. doi: 10.1371/journal.pone.0010980. [DOI] [PMC free article] [PubMed] [Google Scholar]
- [64].Simonsen AH, Bahl JM, Danborg PB, Lindstrom V, et al. Pre-analytical factors influencing the stability of cerebrospinal fluid proteins. J Neurosci Methods. 2013;215:234–240. doi: 10.1016/j.jneumeth.2013.03.011. [DOI] [PubMed] [Google Scholar]
- [65].Persichetti E, Chiasserini D, Parnetti L, Eusebi P, et al. Factors influencing the measurement of lysosomal enzymes activity in human cerebrospinal fluid. PLoS One. 2014;9:e101453. doi: 10.1371/journal.pone.0101453. [DOI] [PMC free article] [PubMed] [Google Scholar]
- [66].Toombs J, Paterson RW, Lunn MP, Nicholas JM, et al. Identification of an important potential confound in CSF AD studies: aliquot volume. Clin Chem Lab Med. 2013;51:2311–2317. doi: 10.1515/cclm-2013-0293. [DOI] [PubMed] [Google Scholar]
- [67].Toombs J, Paterson RW, Schott JM, Zetterberg H. Amyloid-beta 42 adsorption following serial tube transfer. Alzheimers Res Ther. 2014;6:5. doi: 10.1186/alzrt236. [DOI] [PMC free article] [PubMed] [Google Scholar]
Associated Data
This section collects any data citations, data availability statements, or supplementary materials included in this article.