Abstract
Bioluminescence imaging is a powerful technique to visualize and monitor biological processes in numerous systems. This unit describes two strategies for bioluminescence imaging that can be used to study bacterial infection in mice. One method is to express a luciferase gene in the bacteria; the second method is to use bacteria that express both a luciferase and β–lactamase along with a substrate containing caged luciferin, which is released by β–lactamase hydrolysis and reacts with luciferase to generate light. For both strategies, bioluminescent signals are imaged using an IVIS live animal imaging system. The bioluminescence images are analyzed to localize bioluminescent bacteria, quantify signal and to determine the wavelengths of the signals produced. The correlation of bacterial numbers with signal intensity in vivo can be determined, allowing a quantitative measure of bacterial numbers in mice in real time. Methods are described in detail to facilitate successful application of these emerging technologies in nearly any experimental system.
Keywords: Bioluminescence, Fluorescence, mice, in-vivo imaging
INTRODUCTION
For the study of pathogen infection, the major virtue of bioluminescence imaging is that infection process can be visualized and monitored in whole body of live animals over time (Hutchens and Luker, 2007). Two of the basic protocols in this unit discuss how one can use bioluminescence gene expressing bacteria to image bacterial infections in live mice. The third basic protocol in this unit combines luciferase expressing bacteria with a β-lactamase substrate: Bluco. Bluco is a type of caged luciferin, which can be released by β–lactamase hydrolysis. The released luciferin can be used by luciferase to produce light signal. This technique is called sequential reporter-enzyme luminescence (SRL). Many Mycobacteria, including BCG and M. tuberculosis have β–lactamases that can be detected by Bluco, provided that luciferase is present in the reaction system. Although we describe use of the FFluc and CBRluc, bacterial luciferases can be utilized in exactly the same manner, skipping steps that involve delivery of the substrate.
Unlike fluorescent reporters (UNIT 2C.3), no excitation light is required for bioluminescence imaging, so they are not limited by the ability to deliver the necessary excitation wavelength of light, which sometimes may heat and/or damage tissue if a long or too intense exposure is used. In addition, bioluminescence has an extremely low or no background signal in mammalian tissues, making the signal to noise ratio extremely high (Rice et al., 2001). However, in the case of many luciferases, they require injection of a substrate in order to initiate the light-production that can be variable in level throughout various tissues and is dependent upon the pharmacokinetic parameters of that substrate to be maintained at sufficient levels to allow sensitive detection. In addition, the temporal kinetics of substrate distribution must first be determined prior to use of these substrates to ensure that consistent levels of substrate and, thereby, signal are obtained, so that signal correlations with infectious agent are quantitatively accurate. Furthermore, in the case of all luciferases, they can have detrimental impacts on bacterial or eukaryotic cell fitness related to the reaction and/or substrate that they catalyze within the cell.
Biosafety Precautions
Caution: Mycobacteria include Biosafety Level 2 or 3 (BSL2 or 3) pathogens. Follow all appropriate guidelines and regulations for the use and handling of pathogenic microorganisms.
Animal Safety Precautions
Caution: The experiment described involves use of Biosafety Level 2 or 3 (BSL 2 or 3) conditions depending on the bacterial species. Follow all guidelines for use and handling of infected animals. Protocols using living animals must first be reviewed and approved by an Institutional Animals Care and Use Committee and must conform to governmental regulations regarding the care and use of laboratory animals.
Basic Protocol 1: Imaging M. smegmatis Lung infection in Live Mice Using Luciferase
Introduction
Bioluminescence imaging is a powerful technique to visualize and monitor biological processes in a variety of areas, including oncology, immunology, stem cell biology and infectious diseases (Contag and Bachmann, 2002). For pathogenesis studies in living animals, this technique can be applied to the investigation of colonization, quantification and dissemination of pathogens temporally and spatially in living animals (Contag and Bachmann, 2002). This protocol describes bioluminescence imaging of bacterial lung infection in living mice using a click beetle luciferase (CBRluc) expressing Mycobacterium smegmatis strain. Mice were infected with the luciferase expressing bacterium by lung injection, and then were injected with luciferin by i.p.. Bioluminescence signals were imaged and analyzed using the IVIS live animal imaging system.
Materials
Female Nu/Nu mice of 6–8 weeks of age.
Sterile growth medium containing LB+ADC+TW.
Disposable sterile inoculation loops.
Luciferin 20 mg per ml PBS
14 ml culture tubes (VWR cat. No. 60818-725).
Incubator with platform shaker or roller-tube apparatus.
Bacteria expressing a Click Beetle Red luciferase gene.
Insulin syringe with 29-G needle (B-D cat. No. 309301).
Prepare mice
-
1
Follow the protocol described in Unit 2C.3, Basic Protocol 2, steps 7–15 to infect mouse lungs with the bacterial strain expressing Click Beetle Red luciferase. Use Basic Protocol 2, steps 1–6 to grow the bacterial strain expressing the luciferase.
-
2
Inject mice with luciferin (150 mg/kg) i.p. 10 minutes before imaging.
-
3
Place mice into gas anesthesia induction chamber 5 min post-luciferin injection, using the isoflurane anesthesia protocol, Support Protocol 3, in Unit 2C.3. Animal preparation should take into consideration imaging acquisition timing, which is usually optimal at 10 minutes post-i.p. injection of luciferin. However, the specific temporal kinetics for the animals and bacterial strain used should be determined empirically prior to attempts to quantify signal for a specific system.
-
4
Place mice into the IVIS imaging chamber after fully anesthetized, with the mouse nose inserted into the nose cone of the gas anesthesia manifold.
-
5
Maintain mice under gas anesthesia during imaging with continuous supply of the appropriate percentage of isoflurane through the gas anesthesia manifold.
Set up the Imaging acquisition conditions
-
6
During animal preparation, start the Living Image software and set up the imaging acquisition conditions.
-
7
Initialize the IVIS System and confirm or wait for the CCD temperature to lock (Temperature bar will turn green).
-
8
Choose the Luminescent option on the control panel Fig 1).
-
9
Confirm that the Excitation Filter is set to Block and the Emission Filter is set to Open (specific wavelengths of luminescence can be collected, if desired, by setting this filter).
-
10
Set the binning and F-Stop: Confirm the default binning and F-Stop levels or select new levels for the luminescent image.
-
11
Set the exposure time (usually 1–300 seconds): Exposure time can be manually set up or set to “auto” exposure. The auto exposure selection is at the drop down button of “Exposure”.
-
12
Set the FOV: To adjust the field of view (FOV), make a selection from the Field of View drop-down list. Typically an FOV of “B” is selected for imaging one mouse, “C” is selected when imaging three mice, and “D” for imaging 4–5 mice.
-
13
After the mice are placed into the IVIS imaging chamber, check the “Alignment Grid” box on the imaging acquisition panel to make sure mice are properly positioned inside the FOV.
-
14
Click Acquire. During image acquisition, the Acquire button becomes a Stop button.
-
15
Establish a folder for storing the Living Image files. After imaging, the images can be saved to the selected folders (Fig 2).
-
16
Refer to Support Protocol 1, 3D Bioluminescent Imaging via DLIT acquisition, for 3-D analysis.
Fig. 1.
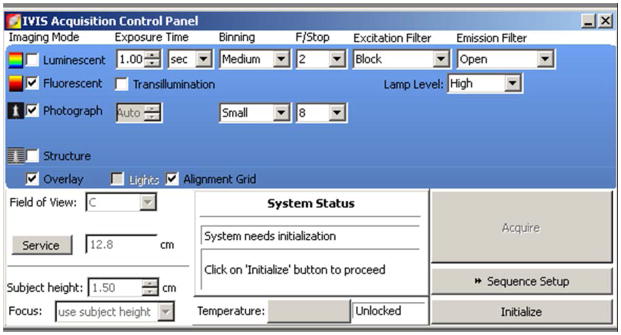
IVIS acquire image panel for luminescent imaging.
Fig. 2.
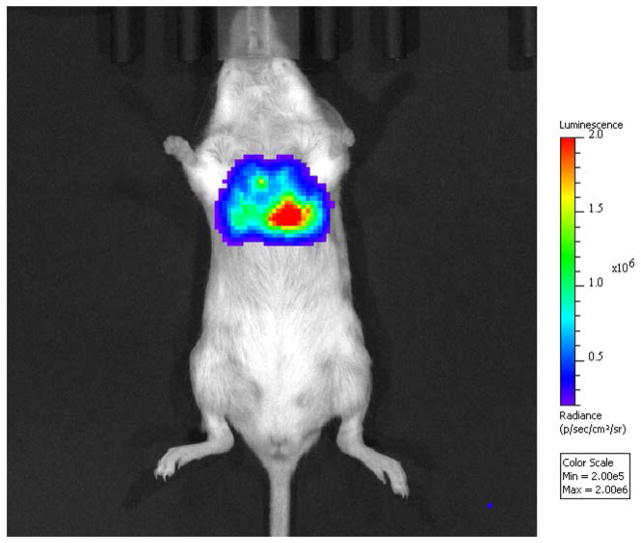
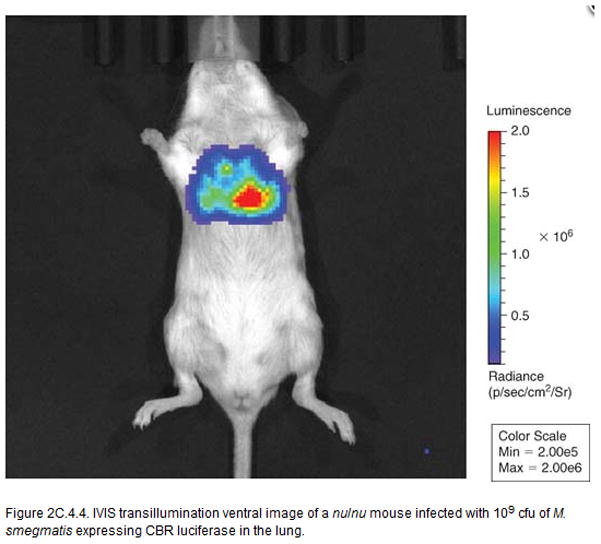
IVIS transillumination ventral image of a nu/nu mouse infected with 109 CFU of M. smegmatis expressing CBR luciferase in the lung.
Basic Protocol 2: Imaging M. bovis BCG subcutaneous infection in Live Mice using Luciferase
Introduction
This protocol describes bioluminescence imaging of bacterial infection in living mice using click beetle luciferase (CBRluc) and firefly luciferase (FFluc) expressing M. bovis BCG strains. Mice were infected subcutaneously with luciferase expressing bacteria, and injected with luciferin as a substrate. Bioluminescence signals were imaged using an IVIS live animal imaging system. The bioluminescence images were analyzed to localize bioluminescent bacteria, quantify signal and to characterize spectrum of signal produced. The correlation of bacterial numbers with signal intensity in vivo can also be determined.
Materials
Cultures of strains expressing luciferase genes CBRluc and FFluc using plasmids derive from pJDC89 (Mehta et al., 2006) by inserting luciferase genes between NheI and PacI sites.
Spectrophotometer
Microplate reader
White 96 well plates
2 mM Luciferin solution (in 0.45 M sodium acetate, pH 5.0)
1 ml-sterile syringes
26 G-needles
1XPBS (phospate buffered saline, pH 7.4) solution
BALB/c mice
Isoflurane
Luciferin solution (20 mg per ml of PBS)
Light baffle divider
Transparent nose cones
XGI-8 Gas Anesthesia System
IVIS® Imaging System
Bacterial preparation
-
1
Follow the previous described Support Protocol 1 in Unit 2C.3 – “Preparation of Mycobacterial Cultures for Inoculation” to prepare bacteria in exponential phase.
-
2
Inoculate 100 μl of bacterial cultures into each well of a white 96 well microplate. Use white microplates for measurement of luminescence.
-
3
Inject 50 μl of 2mM luciferin into each well of 96 microplates by automatic injection by microplate reader.
-
4
Measure luminescence with 1 second exposure.
-
5
This step is to check bioluminescence of mycobacterial cultures in vitro before in vivo imaging.
-
6
Centrifuge bacteria at 3700 g at 4°C for 15 minutes to harvest bacterial cultures.
-
7
Resuspend bacterial pellets in 1x PBS to appropriate concentration.
Imaging mice
-
8
Subcutaneously infect mice as described earlier in Support Protocol 2 in Unit 2C.3, “Subcutaneous and Intratracheal Infection of Mice”.
-
9
Anesthetize mice using isoflurane in XGI-8 Gas Anesthesia System of IVIS® Imaging System, as described previously, using Support Protocol 3 in Unit 2C.3, “Isoflurane Gas Anesthesia”.
-
10
Remove mice from the induction chamber, weigh mice to determine appropriate dose of luciferin.
-
11
Turn on IVIS flow of IVIS manifold and set to 0.25 lpm
-
12
Insert transparent nose cone to manifold and place mouse’s nose into nose cone inside IVIS imaging chamber. For imaging more than 1 mouse, use light baffle divider between each mouse to prevent reflection of luminescence onto adjacent mice.
-
13
Inject luciferin peritoneally to mice with 150 mg of luciferin per kilogram. After luciferin injection, wait 10 minutes to allow dispersal of substrate throughout the body of the mouse.
Luminescence imaging in vivo
-
16
Open Living Imaging® Software and IVIS “Acquisition Control panel” appears in window.
-
17
In IVIS Acquisition Control panel, click “Initialize IVIS system”.
-
18
Click “Sequence setup” in IVIS Acquisition Control panel.
-
19
Click “Luminescence” in Imaging Mode of the IVIS Acquisition Control Panel.
-
20
Set exposure time, usually from 0.5 sec to 5 minutes.
Start with shorter exposure times and after checking images, increase exposure time as needed.
Generally maximum exposure time is 5 min, but this can be increased to acquire a weak signal. Warning messages may be given for long time exposure time.
-
21
Set Binning to medium or large, set F/stop to F1, set Excitation filter to block, and set Emission filter to open. For imaging spectral analysis, set to serial wavelengths differing by 20 nm.
-
22
Set FOV A or B for 1 mouse imaging, C and D are for 2–3 and 4–5 mice, respectively.
-
23
After determination of all parameters, click “‘Add” in Image Wizard of IVIS Acquisition Control Panel to add sequence setup.
-
24
Click “Acquire” to take images.
After imaging, acquired images and edit image levels panel will appear. Fill the information for experiments in edit image levels panel and save your images.
-
25
After imaging, remove the mice from IVIS imaging chamber and return it to the cages. Check whether mice awake from anesthetization and show normal behavior. Mice should awake within few minutes.
-
26
Refer to 3D DLIT reconstructions (Support Protocol 1) to acquire 3-D bioluminescent images.
Analysis of luminescence images
-
28
Open the Living Imaging® Software.
-
29
Click browse in file to bring your images and the Living Image Browser will open.
-
30
Open file to analyze and image will appear.
-
31
Select Photons in units for image panels.
-
32
Open adjustable images by double clicking original images and Tool Palette will appear.
-
33
Click Corrections/Filtering and adjust “Binning and Smoothing Images” for cosmic correction.
-
34
Click Image Adjust and adjust images using Max and Min for color scale.
-
35
Click Spectral Unmixing on Tool Palette.
-
36
In pull down list for Spectral Unmixing, click “Analyze” and select the wavelengths for spectral unmixing.
-
37
In pull down list for Analyze, set the number of components to 2.
-
38
In pull down list for Analyze, set Mask to photo and Photo Mask Setup will open. In Photo Mask Setup, set threshold of photo mask to 9–10.
-
17.39
In pull down list for “Analyze” click “Unmix Spectra”. Click “Results” in down list of Spectral Unmixing to see detail results. Plot Distribution (distribution tab in images) show the photon images from unmixing results in unmixed images and composite images (Fig. 2B). Each image in plot distribution can be adjusted by double clicking images. Plot spectra (spectra tab in images) shows a graph of the normalized amplitude of the spectra (Fig. 2C).
-
40
Save analysis results of spectral unmixing. Copy or export images and data.
-
41
In Tool Palette, click ROI Tools.
-
42
Select the shape and number of ROI. ROI frames will appear in image.
-
43
Adjust size of ROI frame and drag it to the area of interest to be quantified.
-
44
Click ROI measurement and copy or export quantified data to excel file.
Basic Protocol 3: Sequential Reporter Enzyme Luminescence Imaging of Mice with Bluco, a Caged Luciferin Substrate
Introduction
This protocol describes sequential reporter-enzyme luminescence (SRL). In this technique, a luciferase gene Click Beetle Red (CBR) was introduced into Mycobacterial strains through a plasmid. The Mycobacterial strains were then used to infect mice subcutaneously or intratracheally. Finally, the infected or the control mice were peritoneally injected with Bluco. Bluco is a caged luciferin, which can be hydrolyzed by β–lactamase secreted from the Mycobacterial strain. The bioluminescent signal was imaged by using IVIS® Imaging System (Caliper Life Sciences).
Materials
Bacterial strain expressing Click Beetle Red (CBR) Luciferase
Microcentrifuge
Microcentrifuge tube rack and lab tape
Spectrophotometer
White flat-bottom 96-well plate, sterile, with lid
Plate Reader
Incubator
Clipper
Sterile needles and syringes
Mice
IVIS® Imaging System (Caliper Life Sciences)
Bacterial preparation
-
1
Prepare exponential phase mycobacterium containing luciferase gene (CBR) in a 10-ml 7H9 medium with 25μg/ml hygromycin as described earlier.
-
2
Dilute the culture 1:10 in PBS-Tween 80 and determine OD600 by Spectrophotometer. Calculate bacterium number based on the OD600.
-
3
Remove appropriate amount of the culture and spin down the pellet with microcentrifuge. Wash the pellet with PBS-Tween 80 three times.
-
4
Re-suspend the pellet into appropriate PBS-Tween 80 to make 108 CFU/ml.
-
5
Add 96 μl citrate buffer into well of White flat-bottom 96-well plate first, then add 2 μl of the 108 mycobacterium stock culture and 2 μl 2.5 μg/ml Bluco, gently mix. Keep at 37°C for 1 hour. Use plate reader to detect light production.
-
6
Dilute the 108 CFU/ml mycobacterium stock culture serially 1:10 to 107,106, 105,104,103,102 per ml, if light production is obtained for test strains.
-
7
Plate titers on M-OADC agar plate to confirm CFU.
Mouse infection and substrate injection
-
8
Refer to the related protocols described earlier for subcutaneous and intratracheal infection.
-
9
Inject Bluco working solution (2 μl of a 2.5 μg/μl solution of Bluco in saline per gram of mouse body weight) peritoneally. Bluco can be injected multiple times for imaging at different time points.
Mouse imaging and image analysis
-
10
Acquire and analyze luminescent images as described in Unit III.
-
11
Acquire and analyze 3-D bioluminescent images as described in the Steps for 3D DLIT reconstruction.
Reagents and Solutions
Citrate solution: 1.76 g sodium citrate, dihydrate into 15 ml ddH2O. Adjust pH to 5.5, filter sterilize, store at room temperature.
Ketamine + Xylazine solution: Ketamine 100 μg +10 μg Xylazine in 1 ml ddH2O, store at −4°C
Bluco stock solution: Add 25 mg Bluco into 1 ml sterile PBS, store at −20°C (always keep Bluco in coil wrapped tube, keep in lower temperature when possible).
Bluco working solution: dilute Bluco stock solution to 2.5 mg/ml with saline.
Support Protocol 1: 3D Bioluminescent Imaging via DLIT acquisition
Diffuse tomography (DLIT) is a technique that generates a three-dimensional (3D) reconstruction of the luminescent light source distribution inside the living animal by analyzing images of the surface light emission. For DLIT reconstructions, emission measurements are taken using several emission filters. The surface topography is first determined from a structured light image. This structured light image must be acquired at the same time as the initial bioluminescent image is acquired. Otherwise, it will not be possible to later use DLIT. Make sure to remember to acquire structure images if it is possible that anytime in the future DLIT reconstructions will be useful. For this reason, our standard procedure is to always acquire at least one structured light image for each imaging session for each animal or set of animals. The algorithm uses values for the source and the tissue optical and tomographic properties, which are stored in the software and the structure image, in order to converge on a solution for the most likely source.
Materials
IVIS system
Living Image software
Collect bioluminescent data for 3D imaging
Click Sequence Setup button.
Select Imaging Wizard icon from the new panel (fig 6a). The imaging Wizard guides the user through a series of steps in order to provide an appropriate imaging sequence. Users can also set up a sequence manually but the wizard provides a simple and convenient way to determine the appropriate imaging parameters.
Click on the Bioluminescence option and click next (fig 6b).
Click on the DLIT option and click next.
Select the appropriate probe and click next.
Select imaging subject, auto setting, subject height and click next.
The sequence has been set up, click acquire sequence to begin imaging.
Fig. 6.
Steps for collecting luminescent data for 3D DLIT reconstruction. (a) IVIS control panel showing the image sequence editor and the Imaging wizard. (b) Imaging wizard bioluminescence options. (c) Living Image Tool Palette showing the Surface topography selection. (d) Surface topography analysis panel showing the Crop area of interest. (e) Surface topography analysis panel showing the appropriate threshold selection. (f) Living Image reconstruction panel showing the 3D surface generation. (g) Living Image Tool Palette showing the DLIT 3D reconstruction settings. (h) Living Image reconstruction panel showing the data preview.
Analyze bioluminescent data for 3D DLIT reconstructions
Load the appropriate DLIT sequence from the browser window.
Select Surface Topography from the Tool Palette (fig 6c).
Make appropriate selections for subject type (such as mouse), and spatial orientation (such as ventral or dorsal) then click the Reconstruct button.
Make sure a valid crop region is selected in the Surface Topography Analysis window and click Next (fig 6d).
Make sure threshold level is appropriate to generate an image mask (fig 6e).
Click Finish to generate a 3D Surface (fig 6f).
Select DLIT 3D Reconstruction from the Tool Palette (fig 6g).
-
In the Analyze tab the algorithm automatically selects which images to use from the Sequence. Make sure the correct “Tissue Property” is selected.
In the property tab, the “Tissue Properties” can be changed by selecting new parameters from the drop down list. “Muscle” is a good initial choice for “Tissue Properties”. Select the appropriate bioluminescent Source Spectrum from the dropdown list such as Click Beetle Red (CBRed).
Click the “Start” button on the Analyze tab.
A Data Preview window appears and displays the image data that will be included in the reconstruction. In this window click the “Reconstruct” button to begin the algorithm (fig 6h).
When the analysis is finished a window appears with the DLIT result showing the calculated location of the bacterial infection.
Reagents and Solutions
2mM luciferin
Prepare 50 mM luciferin stock solution by dissolving 100 mg of D-luciferin (1 bottle of D-luciferin 100mg/bottle) in 6.2 ml of 0.45 M sodium citrate (pH, 5.0) solution. Dilute to 2 mM D-luciferin with 0.45 M sodium citrate solution. Dispense stock and working solutions into aliquots in light-tight containers and store at −20°C.
Luciferin solution (in PBS)
Prepare 20 mg per ml of luciferin by dissolving 100 mg of D-luciferin in 5 ml of PBS (pH 7.4) solution. Sterilize by filtration with syringe filter of 0.22um pore size. Dispense into aliquots in light-tight containers and store at −20°C.
Commentary
Bioluminescence is light emission generated by a chemical reaction between luciferase and luciferin. The reaction catalyzed by luciferase results in photon or light emission (Wilson and Hastings, 1998). Luciferases commonly used for bioluminscence imaging can be divided into three different groups based on substrate and chemical reaction (Wilson and Hastings, 1998). The first group is encoded by the lux operon present in several bacterial strains (Meighen, 1991). Bacterial cells expressing this lux operon can produce light continuously without requiring exogenous substrate, since the reaction utilizes a substrate synthesized and recycled by genes present within the operon (Hastings et al., 1969). However, bacterial luciferases produce light with a low emission wavelength that is less than ideal for in vivo imaging due to absorbance of its signal by hemoglobin (Hastings et al., 1969; Weissleder, 2001). This problem has not prevented use of this system for in vivo imaging because the absence of the need for an exogenous substrate allows long photon acquisition times, but it does limit the threshold of detection for bacteria to approximately 105 – 106 in those systems (Contag et al., 1995; Francis et al., 2000; Francis et al., 2001). The second group of luciferases utilizes coelenterazine as a substrate for bioluminescence. It includes Renilla luciferase and Gaussia luciferase originating from the sea pansy (Lorenz et al., 1991). There is a limitation in the bioavailability of coelenterazine, because of its low membrane permeability (Hutchens and Luker, 2007). The third group includes beetle luciferases such as firefly luciferase (FFluc) and click-beetle red luciferase (CBRluc) that use luciferin as their substrates for light production (de Wet et al., 1985; Wood et al., 1989). In the case of FFluc, this chemical reaction involves luciferase, oxygenation of luciferin and ATP. FFluc produces a broad spectral range of emission with a maximum at 560 nm (Rice et al., 2001). This spectral property of FFluc and CBRluc makes them valuable as reporters in live animals (Zhao et al., 2005).
Critical Parameters and Troubleshooting
Luciferase expressing bacteria
One of the most important aspects of in vivo bacterial infection imaging is to obtain stable optical reporters that do not impact bacterial growth or virulence. Initial in vitro and subcutaneous analysis is useful to understand the performance of the optical reporter. Choosing the correct optical reporter is critical for the entire imaging process. The main factors affecting luminescence in vivo imaging include bioluminescence expression level, bacterial number, infection site and infection method. Use of a fresh bacterial culture at exponential phase and correct determination of bacterial density for infection are necessary in order to obtain high quality images and a good correlation between bacterial number and light intensity. Because mice display variation between individuals, even when using inbred strains, it is important to use enough mice to account for variation during quantitative analysis.
Considering the parameters of imaging affecting luminescence, it is critical to determine proper exposure time and other exposure conditions to obtain high quality of images that will allow quantification of light intensity. Saturated images cannot be quantitatively analyzed. Thus, it is useful to acquire several images with different exposure conditions, starting with a short exposure time, when little previous data regarding signal intensity is available.
In order to obtain a high quality in vivo image, the conditions for each infecting bacteria and exposure should be optimized using pilot studies prior to each experiment. Normally, our group will determine the threshold of detection for bacteria with high levels of CBR gene expression at exponential growth phase in vitro and use 10–100-fold higher levels to evaluate potential thresholds by subcutaneous inoculation. All infection conditions should use exponential phase growth of infecting bacteria to ensure optimal gene expression, resulting in maximal signal. In the case of intratracheal infection it is critical to deliver bacteria into lungs, rather than the stomach. Often improper inoculation is obvious due to the presence of high levels of bacterial signal in the trachea or stomach, rather than the lungs. Mice should be chosen for follow up that were inoculated only into the correct tissues, in this case, the lungs. In cases where bioluminescent signal intensity is too weak or too strong, modifying IVIS parameters can improve image quality. A common method is to change exposure time or f/stop. Bluco concentration or total amount and the length of time given post-administration can impact the quality of imaging results. Testing and optimization of each of these conditions in pilot studies when working with a new system will increase chances of obtaining quantitative data in critical experiments.
Anticipated results
Luciferase expressing bacteria
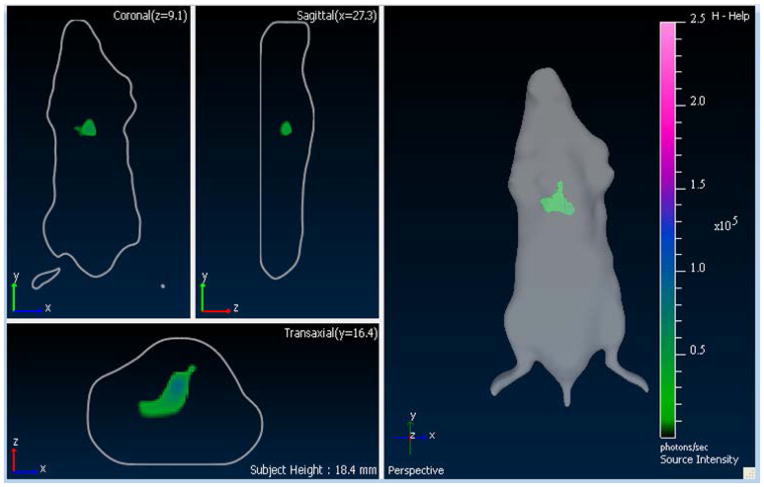
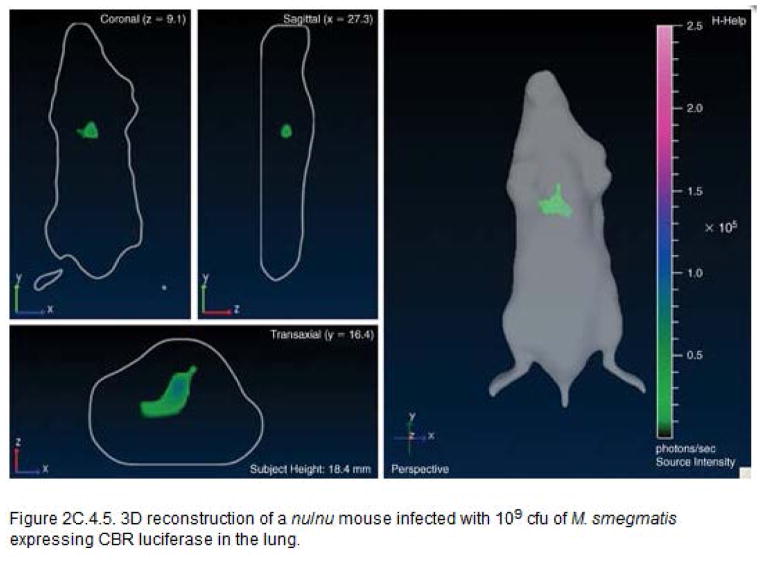
Nu/Nu mice were infected with a M. smegmatis strain expressing CBR luciferase in lung (109 CFU). The mice were imaged on ventral position using IVIS transillumination (Fig. 2). 3D reconstruction of the infected nu/nu mouse is shown in Fig. 3.
Fig. 3.
3D reconstruction of a nu/nu mouse infected with 109 CFU of M. smegmatis expressing CBR luciferase in the lung.
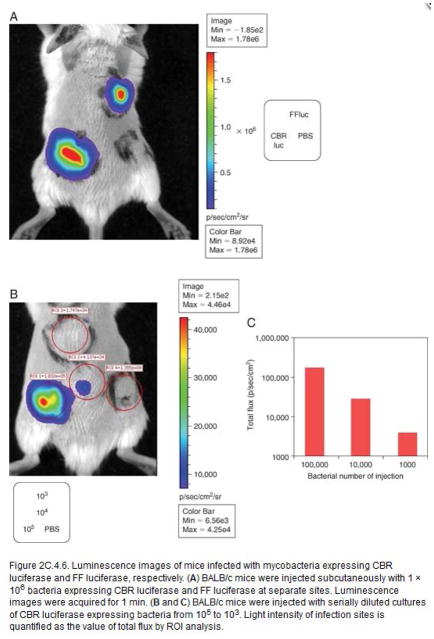
Significant levels of bioluminescence signal are detected from sites infected with bioluminescent M. bovis BCG strains expressing CBRluc and FFluc, respectively, as compared to 1x PBS injected sites (Fig. 4a). Light intensity is quantified from R.O.I (regions of interested) as total flux (Fig. 4b and c). Light intensity correlates well with bacterial inoculum (Fig. 4b and c).
Fig. 4.
Luminescence images of mice infected with mycobacteria expressing CBR luciferase and FF luciferase, respectively. (a) BALB/c mice were injected subcutaneously with 1 × 10⁶ bacteria expressing CBR luciferase and FF luciferase at separate sites. Luminescence images were acquired for 1 min. (b) and (c) BALB/c mice were injected with serially diluted cultures of CBR luciferase expressing bacteria from 105 to 103. Light intensity of infection sites is quantified as the value of total flux by ROI analysis.
The spectral properties of the resulting signal demonstrate that light from both CBRluc and FFluc have broad spectra that overlap, light produced at over 600 nm is higher in CBRluc than with FFluc, suggesting that the signal from these luciferases can be separated. We found that CBRluc and FFluc can be simultaneously imaged using spectral unmixing analysis. The spectral unmixing analysis requires collecting sequential images using a series of emission filter wavelengths (Fig 5a). Unmixing results are shown as unmixed and composite images (Fig. 5) and normalized spectra are shown as a graph (Fig. 5c). Unmixing spectra obtained from luminescence of mixed CBRluc and FFluc were similar to the standard spectra obtained for each luciferase separately.
Fig. 5.
The spectral unmixing of luminescence from mixed CBR luciferase and FF luciferase in vivo. BALB/c mice were injected subcutaneously with 106 CFU of mixed CBR luciferase and FF luciferase expressing strains at different ratios. (a) Sequential images were acquired for 1 min with emission filters of serial wavelengths from 520 nm to 720 nm. As a control, images without an emission filter were acquired before and after the imaging sequence. (b and c) Luminescence of mixed CBR luciferase and FF luciferase expressing strains were unmixed by their spectral properties using the spectral unmixing tool in Living image 3.1 (Caliper Life Sciences, CA).
SQL
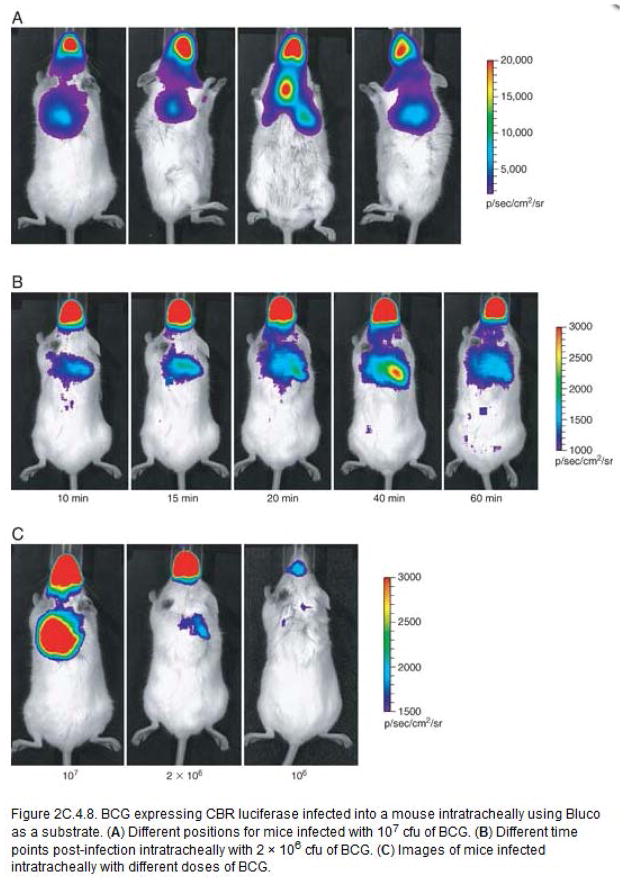
Compared to imaging with Luciferin alone with luciferase expressing bacteria, imaging with Bluco can display similar sensitivity and could possibly avoid toxic effects of expressing exogenous luciferases in sensitive bacterial species. In addition, imaging with Bluco reveals β-lactamase activity that may confer antimicrobial resistance, making it a valuable imaging tool, particularly for those bacterial species where beta-lactams remain an important treatment strategy. β-lactamase, which is not expressed in all bacterial species, is expressed by mycobacteria and may be involved in its ability to resist beta-lactams. The fact that mycobacteria express this enzyme suggests that it could be utilized as a specific target for detection of mycobacterial infections. Bluco is a caged luciferin substrate that allows bioluminescent imaging using this enzyme. The signal produced by Mycobacterium as a result of the combined enzymatic activities of β-lactamase and CBR, with Bluco as substrate can be seen 5 to 10 minutes after Bluco administration. In subcutaneous infections, signal increases with time, reaching its peak at around 1 h post-administration. In intratracheal infections, the peak in signal is earlier, around 40 minutes, probably due to the greater access of pulmonary tissue to substrate as compared to skin. After the peak, both skin and lungs display a decrease in signal, with more rapid kinetics for decrease in signal for pulmonary tissue than skin (Fig. 7, 8b). Signal can be detected at all four imaging positions (Fig. 8a) in pulmonary tissue. Among them, dorsal position is the best, producing stable signal even at low doses of bacteria. The threshold at which signal can be detected in mice infected subcutaneously is approximately 105 CFU (Fig. 7). However, a high dose of 106 CFU is needed to produce signal in intratracheal infected mice (Fig. 8c). Imaging with Bluco represents a viable approach for bioluminescent imaging of bacterial infections in mice when the bacteria express β-lactamase.
Fig. 7.
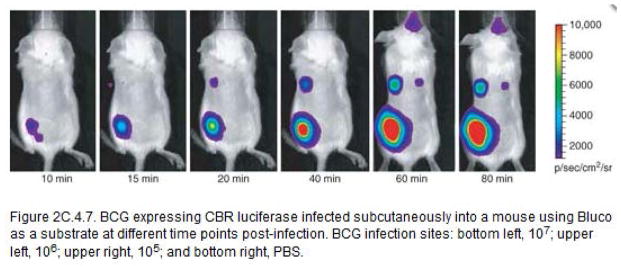
BCG expressing CBR luciferase infected subcutaneously into a mouse using Bluco as a substrate at different time points post-infection. BCG infection sites: bottom left, 107; upper left, 106; upper right, 105; and bottom right, PBS.
Fig. 8.
BCG expressing CBR luciferase infected into a mouse intratracheally using Bluco as a substrate. (a) Different positions for mice infected with 107 CFU of BCG. (b) Different time points post-infection intratracheally with 2 × 10⁶ CFU of BCG. (c) Images of mice infected intratracheally with different doses of BCG.
Time considerations
Luciferase expressing bacteria
The growth rates for different bacterial species vary a great deal. M. smegmatis requires 2–3 days after inoculation from frozen stock to reach at 0.5–1.0 of OD600 but M. bovis and M. tuberculosis require 10–21 days depending upon inocula size and conditions for growth. It takes about 1 h to measure OD600 and luminescence of bacterial cultures, and to harvest and resuspend the bacteria in PBS for mouse infections.
Shaving and weighing for subcutaneous infection requires 10 to 15 minutes per mouse. Another 10 minutes are required for subcutaneous infection, including preparation of bacterial solution in a 1 ml syringe, determination of infection site and injection for each site.
Anesthesia of mice requires 20 minutes, including preparing the anesthesia system. Imaging is begun 10 min after luciferin injection to allow luciferin to disperse throughout the entire body of the mouse. Imaging takes 1 to 10 minutes for each imaging position, but this time may increase or decrease depending on the type of sample, site of infection and complexity of images needed for downstream analysis. Image analysis time varies greatly depending upon the number of mice imaged and the complexity of imaging required. Normally, preliminary analysis can be completed in less than one day for each set of images.
SQL
The incubation time for bacterial growth varies with generation time, taking from a few days to at least a month. This time frame is best estimated by determination of growth curves for each bacterial strain and planning experiments accordingly. It takes about 1 h to prepare the bacteria prior to infecting mice. Subcutaneous infection takes from 5 to 10 min per mouse, depending on number of doses. Intratracheal infection takes about 30 minutes, including anesthesia time. The exposure time for imaging depends on the tissue depth and strength of signal produced, usually from a few seconds to 20 minutes.
Literature Cited
- Contag CH, Bachmann MH. Advances in in vivo bioluminescence imaging of gene expression. Annu Rev Biomed Eng. 2002;4:235–260. doi: 10.1146/annurev.bioeng.4.111901.093336. [DOI] [PubMed] [Google Scholar]
- Contag CH, Contag PR, Mullins JI, Spilman SD, Stevenson DK, Benaron DA. Photonic detection of bacterial pathogens in living hosts. Mol Microbiol. 1995;18:593–603. doi: 10.1111/j.1365-2958.1995.mmi_18040593.x. [DOI] [PubMed] [Google Scholar]
- de Wet JR, Wood KV, Helinski DR, DeLuca M. Cloning of firefly luciferase cDNA and the expression of active luciferase in Escherichia coli. Proc Natl Acad Sci U S A. 1985;82:7870–7873. doi: 10.1073/pnas.82.23.7870. [DOI] [PMC free article] [PubMed] [Google Scholar]
- Francis KP, Joh D, Bellinger-Kawahara C, Hawkinson MJ, Purchio TF, Contag PR. Monitoring bioluminescent Staphylococcus aureus infections in living mice using a novel luxABCDE construct. Infect Immun. 2000;68:3594–3600. doi: 10.1128/iai.68.6.3594-3600.2000. [DOI] [PMC free article] [PubMed] [Google Scholar]
- Francis KP, Yu J, Bellinger-Kawahara C, Joh D, Hawkinson MJ, Xiao G, Purchio TF, Caparon MG, Lipsitch M, Contag PR. Visualizing pneumococcal infections in the lungs of live mice using bioluminescent Streptococcus pneumoniae transformed with a novel gram-positive lux transposon. Infect Immun. 2001;69:3350–3358. doi: 10.1128/IAI.69.5.3350-3358.2001. [DOI] [PMC free article] [PubMed] [Google Scholar]
- Hastings JW, Weber K, Friedland J, Eberhard A, Mitchell GW, Gunsalus A. Structurally distinct bacterial luciferases. Biochemistry. 1969;8:4681–4689. doi: 10.1021/bi00840a004. [DOI] [PubMed] [Google Scholar]
- Hutchens M, Luker GD. Applications of bioluminescence imaging to the study of infectious diseases. Cell Microbiol. 2007;9:2315–2322. doi: 10.1111/j.1462-5822.2007.00995.x. [DOI] [PubMed] [Google Scholar]
- Lorenz WW, McCann RO, Longiaru M, Cormier MJ. Isolation and expression of a cDNA encoding Renilla reniformis luciferase. Proc Natl Acad Sci U S A. 1991;88:4438–4442. doi: 10.1073/pnas.88.10.4438. [DOI] [PMC free article] [PubMed] [Google Scholar]
- Mehta PK, Pandey AK, Subbian S, El-Etr SH, Cirillo SL, Samrakandi MM, Cirillo JD. Identification of Mycobacterium marinum macrophage infection mutants. Microb Pathog. 2006;40:139–151. doi: 10.1016/j.micpath.2005.12.002. [DOI] [PubMed] [Google Scholar]
- Meighen EA. Molecular biology of bacterial bioluminescence. Microbiol Rev. 1991;55:123–142. doi: 10.1128/mr.55.1.123-142.1991. [DOI] [PMC free article] [PubMed] [Google Scholar]
- Rice BW, Cable MD, Nelson MB. In vivo imaging of light-emitting probes. J Biomed Opt. 2001;6:432–440. doi: 10.1117/1.1413210. [DOI] [PubMed] [Google Scholar]
- Weissleder R. A clearer vision for in vivo imaging. Nat Biotechnol. 2001;19:316–317. doi: 10.1038/86684. [DOI] [PubMed] [Google Scholar]
- Wilson T, Hastings JW. Bioluminescence. Annu Rev Cell Dev Biol. 1998;14:197–230. doi: 10.1146/annurev.cellbio.14.1.197. [DOI] [PubMed] [Google Scholar]
- Wood KV, Lam YA, McElroy WD. Introduction to beetle luciferases and their applications. J Biolumin Chemilumin. 1989;4:289–301. doi: 10.1002/bio.1170040141. [DOI] [PubMed] [Google Scholar]
- Zhao H, Doyle TC, Coquoz O, Kalish F, Rice BW, Contag CH. Emission spectra of bioluminescent reporters and interaction with mammalian tissue determine the sensitivity of detection in vivo. J Biomed Opt. 2005;10:41210. doi: 10.1117/1.2032388. [DOI] [PubMed] [Google Scholar]


