Abstract
Angiogenesis is a vital process for normal tissue development and wound healing, but is also associated with a variety of pathological conditions. Using this protocol, angiogenesis may be measured in vitro in a fast, quantifiable manner. Primary or immortalized endothelial cells are mixed with conditioned media and plated on basement membrane matrix. The endothelial cells form capillary like structures in response to angiogenic signals found in conditioned media. The tube formation occurs quickly with endothelial cells beginning to align themselves within 1 hr and lumen-containing tubules beginning to appear within 2 hr. Tubes can be visualized using a phase contrast inverted microscope, or the cells can be treated with calcein AM prior to the assay and tubes visualized through fluorescence or confocal microscopy. The number of branch sites/nodes, loops/meshes, or number or length of tubes formed can be easily quantified as a measure of in vitro angiogenesis. In summary, this assay can be used to identify genes and pathways that are involved in the promotion or inhibition of angiogenesis in a rapid, reproducible, and quantitative manner.
Keywords: Cancer Biology, Issue 91, Angiogenesis, tube formation, fibroblast, endothelial cell, matrix, 3B-11, basement membrane extract, tubulogenesis
Introduction
Angiogenesis, the development of new blood vessels from preexisting vessels, is vital for a variety of processes including organ growth, embryonic development, and wound healing1-3. Newly developed blood vessels, lined by endothelial cells, supply oxygen and nutrients to tissues, promote immune surveillance by hematopoietic cells and remove waste products2,4. Angiogenesis is of key importance during embryonic and fetal development. However, this process remains dormant in the adult except during times of wound healing, skeletal growth, pregnancy or during the menstrual cycle1-3.
Over the last two decades, key molecular mechanisms that regulate angiogenesis have begun to emerge. Angiogenesis is a tightly regulated event, balanced by pro and antiangiogenic signals including integrins, chemokines, angiopoietins, oxygen sensing agents, junctional molecules and endogenous inhibitors5. Once proangiogenic signals such as basic fibroblast growth factor (bFGF), vascular endothelial growth factor (VEGF), platelet derived growth factor (PDGF), and epidermal growth factor (EGF) activate endothelial cell receptors the endothelial cells release proteases to degrade the basement membrane. The endothelial cells then proliferate and migrate, forming sprouts at a rate of several millimeters per day6,7.
Angiogenesis is associated with various pathological conditions including cancer, psoriasis, diabetic retinopathy, arthritis, asthma, autoimmune disorders, infectious diseases, and atherosclerosis8-10. Due to the importance of angiogenesis in various diseases, understanding the genes and pathways that regulate this process is critical to the design of better therapeutics.
The tube formation assay is a rapid and quantitative method for determining genes or pathways involved in angiogenesis. First described in 1988, the principles underlying this assay are that endothelial cells retain the ability to divide and migrate rapidly in response to angiogenic signals11-13. Further, endothelial cells are induced to differentiate and form tube-like structures when cultured on a matrix of basement membrane extract (BME). These tubes contain a lumen surrounded by endothelial cells linked together through junctional complexes. Tube formation occurs quickly with most tubes forming in this assay within 2-6 hr depending on quantity and type of angiogenic stimuli.
Several types of endothelial cells can be used for this assay including both primary cells and immortalized cell lines14,15. The cell line used for this article was mouse 3B-11, but the same methodology can be applied with other endothelial cell lines such as SVEC4-10 (mouse) or primary endothelial cells such as HUVEC (human) cells. Depending on which cell line is used and whether the endothelial cells are transformed or non-transformed, optimization will need to be conducted to identify the ideal time needed for proper tube formation.
Protocol
1. Collection of Conditioned Media to Test for Angiogenic Potential
- Grow primary or immortalized cells to be tested for angiogenic or anti-angiogenic potential in native or low serum media and collect the conditioned media.
- Alternatively, use conditioned media immediately, or aliquoted and stored at -80 °C for several months. Use nonconditioned native or low serum media as a negative control, and use non-conditioned complete growth media (10% FBS, or appropriate concentration) as a positive control. Alternatively, to test potential stimulators of angiogenesis, supplement charcoal stripped media lacking growth factors with known concentrations of specific proteins of interest and compare to growth factor free media alone.
2. Preparation of Endothelial Cells Prior to Assay
Two days prior to assay, passage 3B-11 cells into a new T-75 flask. Passage number of cells is important. This assay works best when cells are between the second and sixth passages. The assay will not work well if endothelial cells are used before the second or after the tenth passage.
Grow cells for 24 hr in DMEM supplemented with 10% FBS, 2 mM L-glutamine, 1 mM sodium pyruvate, 100 U/ml penicillin, and 100 μg/ml streptomycin.
- One day prior to assay, serum starve 3B-11 cells as follows:
- Aspirate media from the 3B-11 cells.
- Add reduced serum media of DMEM supplemented with 0.2% FBS, 2 mM L-glutamine, 1mM sodium pyruvate, 100 U/ml penicillin, and 100 μg/ml streptomycin.
- Grow cells for an additional 24 hr.
3. Preparation of Reagents Prior to Assay
NOTE: BME concentrations are highly variable dependent on lot. BME does not work well if the concentration is less than 10 mg/ml, therefore the BME manufacturer should be contacted prior to purchase to ensure acquisition of an adequately concentrated lot.
Defrost reduced growth factor BME in the refrigerator. BME solidifies when warm, so it must be kept cold prior to use. BME can be stored under refrigeration for a few weeks, or aliquoted and frozen at -80 °C.
A reduced growth factor BME is preferred over traditional BME. The lack of angiogenic factors in the BME will make it easier to observe the effect that factors from the conditioned media have on tube formation.
Thaw media to be tested.
4. Preparation of Endothelial Cells Immediately Prior to Assay
- Wash 3B-11 cells in DPBS.
- If visualization with fluorescence or confocal microscopy is desired, before washing 3B-11 cells, add calcein AM to the endothelial cells in media at a final concentration of 2 µg/ml. Place calcein labeled cells in the dark at 37 °C and 5% CO2 prior to the start of the assay. Dissolve stock calcein AM in DMSO and once calcein is diluted in media final concentration of DMSO should not exceed 0.1%. After 30-45 min wash calcein AM from the cells (step 4.1 above) and continue with the experiment follows.
Trypsinize cells by adding 1 ml trypsin-EDTA to T-75 flask.
After trypsinization is complete, neutralize trypsin by resuspending cells to a final volume of 10ml in DMEM, 10% FBS, 2 mM L-glutamine, 1mM sodium pyruvate, 100 U/ml penicillin, and 100 μg/ml streptomycin.
Filter cells through 100 μm cell strainer to remove clumps.
Count cells and resuspend cells to a final concentration of 7.5 x 10⁶ cells/ml in DMEM, 10% FBS, 2 mM L-glutamine, 1 mM sodium pyruvate, 100 U/ml penicillin, and 100 μg/ml streptomycin.
5. Tube Formation Assay
Place 24-well plate and 1 ml tips in refrigerator or on ice for 20-30 min prior to loading the plate so that the BME does not prematurely solidify.
Pipet 250 µl of reduced growth factor BME into each well of a 24-well plate. Avoid creating bubbles by not depressing the pipette to its final stop while dispensing. Take care that sufficient BME remains at the center of the well when the meniscus forms; if the matrix is too thin, the cells will only form a monolayer.
Incubate 24-well plate at 37 °C and 5% CO2 for 30 min to solidify BME.
- Once BME has set, mix approximately 300 µl of conditioned media with 10 µl of resuspended 3B-11 cells (approximately 75,000 cells).
- Adjust the volume of conditioned media and number of cells plated depending on endothelial cell type used, and test the serial dilutions of the conditioned media to demonstrate activity. If comparing cells grown under different conditions, normalize conditioned media volume to the number of cells which were used to condition the media.
- Tubes will begin to form within 2-4 hr. Depending on angiogenic factor concentration in the conditioned media, peak tube formation may occur between 3 and 12 hr and the timing of the assay will need to be optimized. If working with primary endothelial cells instead of immortalized cells, initial tube formation may be delayed by several hours.
- Tubes will often begin to deteriorate within 18 hr and endothelial cells will undergo apoptosis.
- At the time of peak tube formation, carefully aspirate media from the well to avoid disrupting the tube network on the BME.
- Wash each well with 1 ml DPBS, then aspirate.
- For immediate visualization, add 1 ml fresh DPBS to each well and image the tube network using an inverted microscope attached to a digital camera, or fluorescence/confocal microscope if the cells were stained with calcein AM as in 4.1.1.
- To fix the tube network for later visualization, and add 4% paraformaldehyde to each aspirated well and incubate for 15 min at room temperature.
- Remove paraformaldehyde, wash twice with DPBS, then add 1mL fresh DPBS to each well.
- Microscopically image prior to fixation as few tubes may break during this procedure.
6. Quantification of Tube Network
Quantify the tube network in several different ways depending on the investigator’s preference, and several computer programs have capability to measure the following parameters: number of tubes; number of loops/meshes; number of branch sites/nodes; length of tubes.
Use representative computer program such as Image J with the Angiogenesis Analyzer plugin16 for quantification of tube networks.
Representative Results
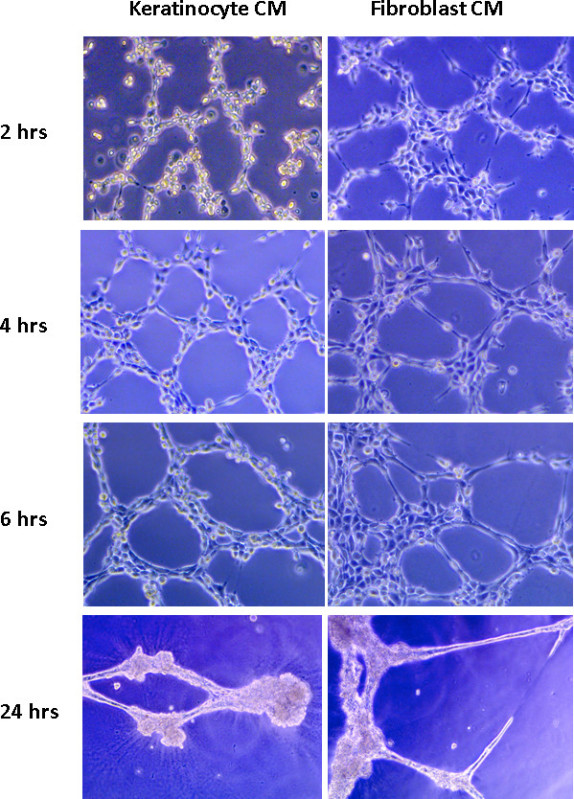
Mouse 3B-11 endothelial cells were seeded on solidified reduced growth factor BME – in this assay, the product Matrigel was used - and followed over time. As shown in Figure 1, angiogenic factors secreted by either mouse keratinocytes or fibroblasts are capable of inducing tube formation over time. Endothelial cells migrate and begin to form small branches within 1-2 hr of plating. Maximum tube formation was reached by 4-6 hr using conditioned media previously obtained from keratinocytes. By 24 hr, some branches remained, but many of the cells became apoptotic and tubes began to disconnect.
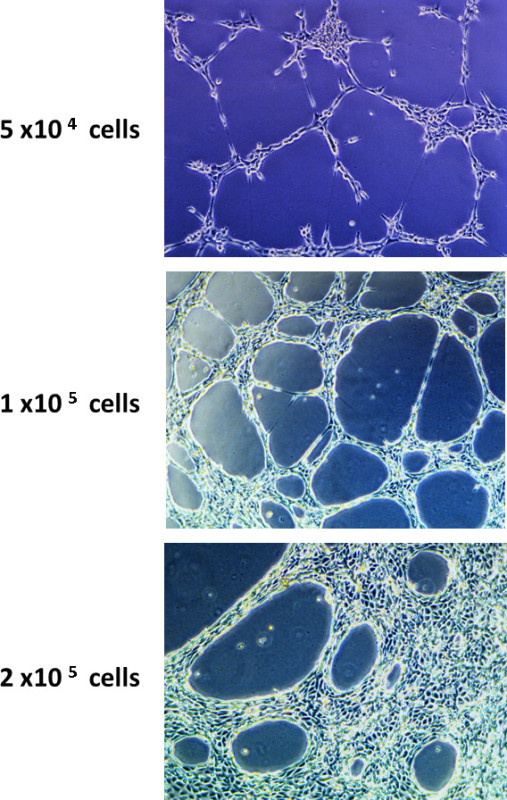
Cell number has a profound impact on tube formation (Figure 2). When an insufficient number of cells are seeded on the matrix, few tubes form and the network is minimal. As more cells are seeded, the tube network becomes more extensive. However, at too high of a concentration, the cells begin to clump or form monolayers, and differences between treatment groups become masked.
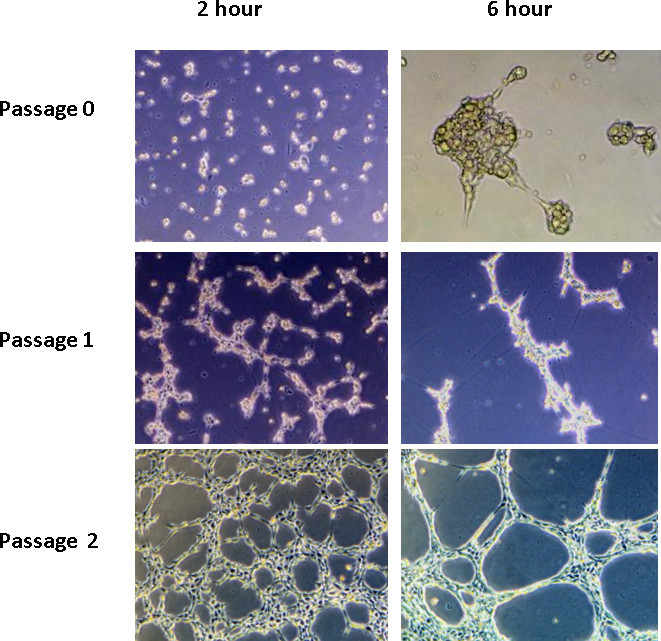
Tube formation with 3B-11 cells works the best with cells between the second and sixth passages. After the sixth passage, cells do not form as extensive a network; cells will not form any major network after the tenth passage. Cells should have a minimum of two passages after reviving from liquid nitrogen storage to ensure adequate tube formation (Figure 3). The growth rate of 3B-11 is so rapid that 25% of cells passaged one day will yield a confluent flask the following day.
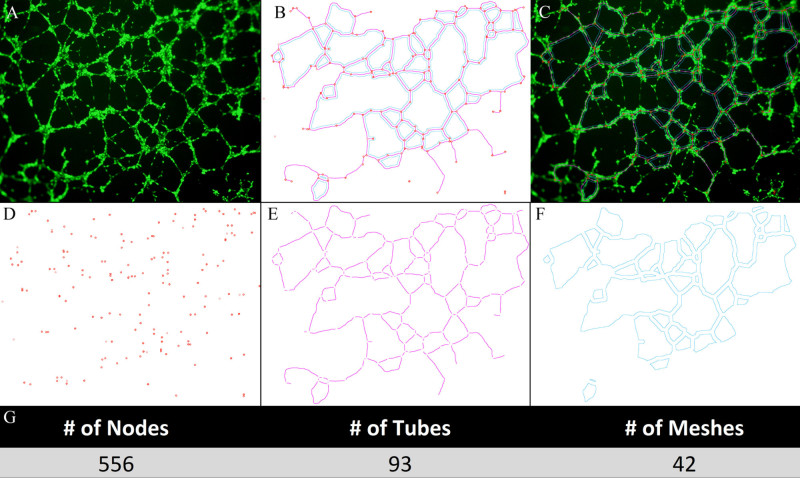
Images can be easily documented through phase contrast microscopy using objectives between 4X and 20X. However, if fluorescent images are desired, calcein AM may be added and the tube network visualized through fluorescence or confocal microscopy (Figure 4). There are several different ways to detect and quantify tube network formation. The most common methods of analysis involve quantification of number of tubes, nodes, loops/meshes, or length of tubes. These parameters can be counted by hand or can be done through various imaging programs, including NIH ImageJ with the Angiogenesis Analyzer plugin. Examples of each of these types of analysis are shown in Figure 4.
 Figure 1. Mouse 3B-11 endothelial cell tube formation over time. A total of 1 x 10⁵ cells were seeded per well on reduced growth factor BME with 350 µl of conditioned media from either fibroblasts or keratinocytes. Tube formation was recorded over the course of 24 hr.
 Figure 2. The effect of cell number on endothelial cell tube formation. 3B-11 cells were seeded in wells at concentrations ranging from 5 x 10⁴ to 2 x 10⁵ with 350 µl of fibroblast or keratinocyte conditioned media, and then followed over time. Note the lack of tube formation in the wells plated with 5 x 10⁴ cells and the crowding of cells in the wells plated with 2 x 10⁵ cells.
 Figure 3. The effect of passage number on endothelial cell tube formation. A total of1 x 105 cells were seeded per well on reduced growth factor BME at passage 0, 1, or 2. Little tube formation was seen before passage 2.
 Figure 4. Fluorescence microscopy imaging and quantification of tube formation. Prior to the start of the assay, the endothelial cells can be treated with calcein AM in order to visualize the cells using fluorescence or confocal microscopy. There have been several reported methods for quantifying the formed tube network, including counting the number of tubes, loops/meshes, branch sites/nodes, or the length of tubes. Here, we show how NIH Image J with the Angiogenesis plugin software can be used on a calcein AM stained tube network (A) to detect total nodes (red)/tubes (pink)/mesh (blue) in combination (B) and merged on network (C). Additionally, this program can be used to individually detect nodes (D), tubes (E), or mesh (F) which can then be quantified (G).
Discussion
Angiogenesis is involved in both physiological and pathological processes. Studying mechanisms involved in angiogenesis requires the use of assays that recapitulate the major steps in angiogenesis. The endothelial cell tube formation assay offers several advantages over other assays. It is easy to set-up, is relatively inexpensive, produces tubules within hours, and is quantifiable. Further, it can be completed in 24- or 96-well plates, and thus can be used for high throughput screening to identify factors that stimulate or inhibit angiogenesis. Although we used 3B-11 mouse endothelial cells for our experiments, the assay can be performed with a variety of human or murine endothelial lines, including HUVEC and SVEC.
To perform an endothelial cell tube formation assay, endothelial cells are mixed with conditioned media which contains pro or antiangiogenic factors and plated over reduced growth factor basement membrane matrix. Endothelial cells begin to align themselves within 1 hr and lumen-containing tubules start to appear within 2 hr. Tube formation can be visualized using a phase contrast inverted microscope, or calcein AM can be added at the conclusion of the assay and tubes visualized using fluorescence or confocal microscopy.
Results may be optimized in several ways. First, primary cells should be ideally between the second and sixth passages. Using cells prior to the second or after the tenth passage is not be conducive for maximum tube formation. Second, the cell number needs to be optimized based on cell type and line used. For mouse 3B-11, we found maximal response using 75,000-100,000 cells/well in a 24-well plate grown with mouse keratinocyte and fibroblast conditioned media. Using too few cells results in minimal or no tube formation, and too many cells results in formation of a monolayer or clumping. Finally, the quantity of conditioned media used should be normalized to cell number instead of protein concentration. If using normal media with 10% FBS, the FBS will account for the majority of the protein concentration measured through a standard protein assay. The concentration will look nearly identical even though number of cells, and therefore the concentrations of the proteins secreted during conditioning, between treatments may be highly variable.
In summary, the tube formation assay is a fast, reproducible and sensitive method for in vitro measurement of angiogenesis. It has advantages over other assays and is a useful method to determine genes and pathways that potentially play an important role in the activation or inhibition of angiogenesis.
Disclosures
The authors have nothing to disclose.
Acknowledgments
This research was supported in part by the Intramural Research Program of the National Cancer Institute at the National Institutes of Health, and by NCI grant UA5CA152907.
References
- Carmeliet P. Angiogenesis in life, disease and medicine. Nature. 1038;438:932–936. doi: 10.1038/nature04478. [DOI] [PubMed] [Google Scholar]
- Carmeliet P, Jain RK. Molecular mechanisms and clinical applications of angiogenesis. Nature. 2011;473:298–307. doi: 10.1038/nature10144. [DOI] [PMC free article] [PubMed] [Google Scholar]
- Potente M, Gerhardt H, Carmeliet P. Basic and therapeutic aspects of angiogenesis. Cell. 2011;146:873–887. doi: 10.1016/j.cell.2011.08.039. [DOI] [PubMed] [Google Scholar]
- Coultas L, Chawengsaksophak K, Rossant J. Endothelial cells and VEGF in vascular development. Nature. 2005;438:937–945. doi: 10.1038/nature04479. [DOI] [PubMed] [Google Scholar]
- Bouis D, Kusumanto Y, Meijer C, Mulder NH, Hospers GA. A review on pro- and anti-angiogenic factors as targets of clinical intervention. Pharmacological research : the official journal of the Italian Pharmacological Society. 2006;53:89–103. doi: 10.1016/j.phrs.2005.10.006. [DOI] [PubMed] [Google Scholar]
- Ausprunk DH, Folkman J. Migration and proliferation of endothelial cells in preformed and newly formed blood vessels during tumor angiogenesis. Microvascular research. 1977;14:53–65. doi: 10.1016/0026-2862(77)90141-8. [DOI] [PubMed] [Google Scholar]
- Chung AS, Lee J, Ferrara N. Targeting the tumour vasculature: insights from physiological angiogenesis. Nature reviews. Cancer. 2010;10:505–514. doi: 10.1038/nrc2868. [DOI] [PubMed] [Google Scholar]
- Chung AS, Ferrara N. Developmental and pathological angiogenesis. Annual review of cell and developmental biology. 2011;27:563–584. doi: 10.1146/annurev-cellbio-092910-154002. [DOI] [PubMed] [Google Scholar]
- Kerbel RS. Tumor angiogenesis. The New England journal of medicine. 2008;358:2039–2049. doi: 10.1056/NEJMra0706596. [DOI] [PMC free article] [PubMed] [Google Scholar]
- Folkman J. Tumor angiogenesis: therapeutic implications. The New England journal of medicine. 1056;285:1182–1186. doi: 10.1056/NEJM197111182852108. [DOI] [PubMed] [Google Scholar]
- Kubota Y, Kleinman HK, Martin GR, Lawley TJ. Role of laminin and basement membrane in the morphological differentiation of human endothelial cells into capillary-like structures. The Journal of cell biology. 1988;107:1589–1598. doi: 10.1083/jcb.107.4.1589. [DOI] [PMC free article] [PubMed] [Google Scholar]
- Arnaoutova I, George J, Kleinman HK, Benton G. The endothelial cell tube formation assay on basement membrane turns 20: state of the science and the art. Angiogenesis. 2009;12:267–274. doi: 10.1007/s10456-009-9146-4. [DOI] [PubMed] [Google Scholar]
- Arnaoutova I, Kleinman HK. In vitro angiogenesis: endothelial cell tube formation on gelled basement membrane extract. Nature protocols. 2010;5:628–635. doi: 10.1038/nprot.2010.6. [DOI] [PubMed] [Google Scholar]
- Walter-Yohrling J, et al. Murine endothelial cell lines as models of tumor endothelial cells. Clinical cancer research : an official journal of the American Association for Cancer Research. 2004;10:2179–2189. doi: 10.1158/1078-0432.ccr-03-1013. [DOI] [PubMed] [Google Scholar]
- Connell KA, Edidin M. Journal of immunology. Baltimore, Md: 1950. A mouse lymphoid endothelial cell line immortalized by simian virus 40 binds lymphocytes and retains functional characteristics of normal endothelial cells; pp. 144–521. [PubMed] [Google Scholar]
- Carpentier G. ImageJ contribution: Angiogenesis Analyzer. ImageJ News. 2012.


