Abstract
In neuroimaging, cortical surface atlases play a fundamental role for spatial normalization, analysis, visualization, and comparison of results across individuals and different studies. However, existing cortical surface atlases created for adults are not suitable for infant brains during the first two years of life, which is the most dynamic period of postnatal structural and functional development of the highly-folded cerebral cortex. Therefore, spatiotemporal cortical surface atlases for infant brains are highly desired yet still lacking for accurate mapping of early dynamic brain development. To bridge this significant gap, leveraging our infant-dedicated computational pipeline for cortical surface-based analysis and the unique longitudinal infant MRI dataset acquired in our research center, in this paper, we construct the first spatiotemporal (4D) high-definition cortical surface atlases for the dynamic developing infant cortical structures at 7 time points, including 1, 3, 6, 9, 12, 18, and 24 months of age, based on 202 serial MRI scans from 35 healthy infants. For this purpose, we develop a novel method to ensure the longitudinal consistency and unbiasedness to any specific subject and age in our 4D infant cortical surface atlases. Specifically, we first compute the within-subject mean cortical folding by unbiased groupwise registration of longitudinal cortical surfaces of each infant. Then we establish longitudinally-consistent and unbiased inter-subject cortical correspondences by groupwise registration of the geometric features of within-subject mean cortical folding across all infants. Our 4D surface atlases capture both longitudinally-consistent dynamic mean shape changes and the individual variability of cortical folding during early brain development. Experimental results on two independent infant MRI datasets show that using our 4D infant cortical surface atlases as templates leads to significantly improved accuracy for spatial normalization of cortical surfaces across infant individuals, in comparison to the infant surface atlases constructed without longitudinal consistency and also the FreeSurfer adult surface atlas. Moreover, based on our 4D infant surface atlases, for the first time, we reveal the spatially-detailed, region-specific correlation patterns of the dynamic cortical developmental trajectories between different cortical regions during early brain development.
Keywords: Infant cortical surface, 4D atlas, cortical folding, cortical thickness, developmental trajectory
1. Introduction
Brain atlas is a representation of anatomical structures and other reference information in a spatial framework, providing a useful repository of knowledge and also facilitating the analysis of spatially-localized experimental data (Evans et al., 2012; Van Essen and Dierker, 2007). In neuroimaging studies, brain atlases play a fundamental role for spatial normalization, analysis, visualization, and comparison of results across individuals and different studies (Evans et al., 2012; Van Essen and Dierker, 2007). Two types of brain atlases have been extensively used, including volumetric atlases (for volume-based analysis) (Eickhoff et al., 2005; Greitz et al., 1991; Habas et al., 2010; Mazziotta et al., 2001a; Mazziotta et al., 2001b; Mazziotta et al., 1995; Shattuck et al., 2008; Tzourio-Mazoyer et al., 2002) and cortical surface atlases (for cortical surface-based analysis) (Fischl et al., 1999b; Hill et al., 2010a; Lyttelton et al., 2007; Thompson et al., 1996; Van Essen, 2005; Van Essen and Dierker, 2007). While volumetric atlases are suitable for studying subcortical structures, cortical surface atlases enable better studying of the highly-convoluted and highly-variable cerebral cortex (Van Essen and Dierker, 2007). This is because cortical surface-based analysis, which explicitly reconstructs surface mesh representations of the highly-folded cerebral cortex, respects the intrinsic topological properties of the cortex and thus greatly facilitates the spatial normalization, analysis, comparison, and visualization of convoluted cortical regions (Fischl et al., 1999b; Goebel et al., 2006; Han et al., 2004; Li et al., 2009, 2010a; MacDonald et al., 2000; Mangin et al., 2004; Nie et al., 2007; Shattuck and Leahy, 2002; Shi et al., 2013; Shiee et al., 2014; Van Essen and Dierker, 2007; Xu et al., 1999). Moreover, cortical surface-based measurements, e.g., surface area (Hill et al., 2010b), cortical thickness (Fischl and Dale, 2000), and cortical folding/gyrification (Habas et al., 2012; Li et al., 2010b; Rodriguez-Carranza et al., 2008; Zhang et al., 2009; Zilles et al., 2013), each with distinct genetic underpinning, cellular mechanism, and developmental trajectory (Chen et al., 2013; Lyall et al., 2014; Panizzon et al., 2009), can comprehensively provide various detailed aspects of the cerebral cortex (Li et al., 2014a). Accordingly, several cortical surface atlases have been created and extensively used in current neuroimaging studies (Fischl et al., 1999b; Goebel et al., 2006; Hill et al., 2010a; Lyttelton et al., 2007; Van Essen, 2005), such as FreeSurfer surface atlas (Fischl et al., 1999b), PALS-B12 and PALS-term12 surface atlases (Hill et al., 2010a), and MNI surface atlas (Lyttelton et al., 2007).
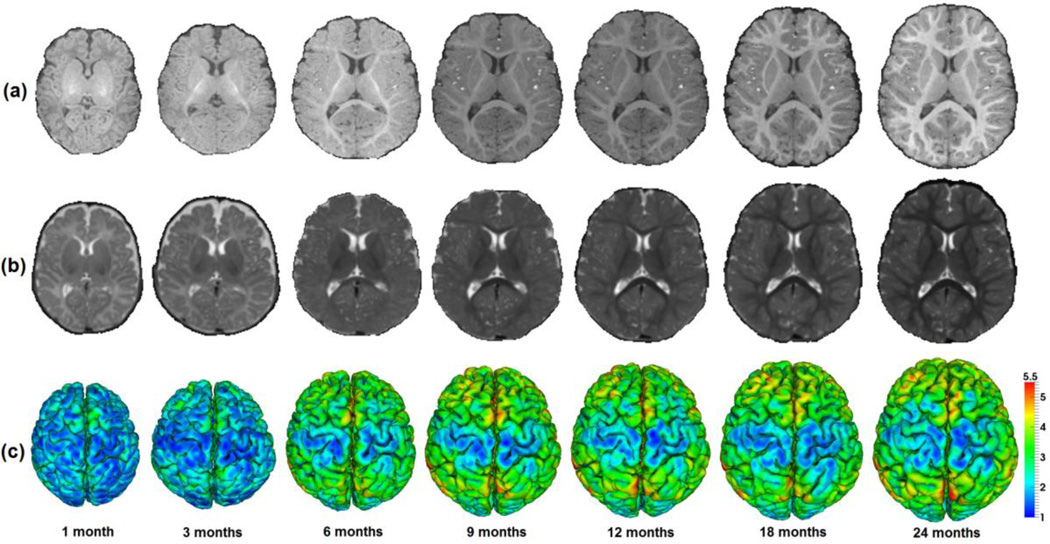
The first two postnatal years is an exceptionally dynamic period for structural and functional development of the human cerebral cortex (Gao et al., 2009; Gilmore et al., 2012; Knickmeyer et al., 2008; Li et al., 2013; Nie et al., 2014), as illustrated in Fig. 1. Particularly, in the first postnatal year, the cerebral cortex expands 80% in surface area (Li et al., 2013), increases 31% in cortical thickness (Lyall et al., 2014), and increases 42% in sulcal depth (Meng et al., 2014). Although our knowledge on early brain development is still scarce, many neuropsychiatric and neurodevelopmental disorders have been indicated as the consequence of abnormal brain development during this critical stage of rapid cortex growth (Gilmore et al., 2012; Lyall et al., 2014). The increasing availability of longitudinal infant MR images unprecedentedly allows us to quantitatively and precisely unravel the dynamic cortex development of each individual infant and the population during this critical stage. This will greatly increase our limited knowledge on normal early brain development and also provide important insights into neurodevelopmental disorders (Gilmore et al., 2012; Li et al., 2014e; Li et al., 2014f; Lyall et al., 2014).
Fig. 1.
Longitudinal dynamic brain development of an infant in the first 24 months of life. (a) T1-weighted MR images. (b) T2-weighted MR images. (c) Reconstructed outer cortical surfaces, color-coded by cortical thickness (mm).
However, the existing brain atlases created for adults are problematic for studying infant MR images, owing to the extremely low signal-to-noise, dynamic changes of intensity appearance, brain size, and cortical folding degree in the infant brain, as shown in Fig. 1. For example, the currently available adult brain atlases poorly serve as templates for spatial normalization of dynamic developing brains across infant individuals, thus seriously degenerating the accuracy of subsequent quantitative analysis. To better study early brain development, various neonatal and infant age-matched volumetric brain atlases have been created (Altaye et al., 2008; Habas et al., 2010; Joshi et al., 2004; Kazemi et al., 2007; Kuklisova-Murgasova et al., 2011; Oishi et al., 2011; Serag et al., 2012; Shi et al., 2014; Shi et al., 2011). Owing to capturing the dynamic changes of the intensity appearance and brain size during early brain development, these infant volumetric atlases have significantly improved the accuracy of tissue segmentation and spatial normalization of infant brains. As a result, these infant atlases are now playing important roles in volumetric analysis of infant MR images, leading to a set of new findings on early brain development. Although encouraging, the volumetric brain atlases do not respect cortical topology and also obscure key spatial relationships between neighboring locations in the cortex, thus leading to blurred cortical structures and eventually less accurate results in the cortex.
For precise revealing the detailed patterns of early cortex development by using advanced cortical surface-based analysis (Dubois et al., 2008; Hill et al., 2010a; Li et al., 2013; Rodriguez-Carranza et al., 2008; Xue et al., 2007), the infant age-matched cortical surface atlases are highly desired yet still lacking. Currently, there is only one neonate/infant dedicated cortical surface atlas, i.e., PALS-term12 atlas, which was constructed by landmark-constrained co-registration of 12 term born neonates (Hill et al., 2010a). In fact, to fully characterize the exceptionally dynamic, regionally-heterogeneous, nonlinear development of infant cortical structures, ideally, the infant cortical surface atlases should be constructed as spatiotemporal (4D) atlases with a high temporal definition using multiple time points, especially in the first postnatal year. Owing to the remarkable inter-individual variability of cortical folding patterns, single-subject based atlas cannot well represent the whole population and thus will introduce strong biases and inaccuracy to the subsequent analysis. Therefore, to capture both individual developmental trajectories and inter-individual variability of cortical folding, 4D infant cortical surface atlases would be better constructed by using longitudinal images of a population of subjects.
However, construction of 4D infant cortical surfaces faces a number of unique obstacles, as available tools for processing and analysis of adult brains are unsuitable for infant MR images, due to their dramatic differences in image contrast, intensity appearance, brain size, and cortical folding degree. To address these critical issues, we have recently developed a set of infant-dedicated, longitudinally-consistent neuroimage analysis tools, covering all major steps of brain tissue segmentation (Wang et al., 2014a; Wang et al., 2014b; Wang et al., 2012), cortical surface modeling (Nie et al., 2012b), reconstruction (Li et al., 2014a), parcellation (Li et al., 2014d), and measurements of cortical thickness, surface area, sulcal depth, and cortical folding/gyrification (Li et al., 2014a; Li et al., 2014f; Meng et al., 2014). The rationale is that all primary and secondary cortical folding are present at term birth and are preserved during postnatal brain development, thus images at the later time points with good tissue contrast and clear cortical folding can help alleviate imprecision in those images at earlier time points with poor tissue contrast and ambiguous cortical folding. These infant-dedicated computational tools ensure accurate and consistent processing and analysis of longitudinal infant MR images, thus providing prerequisites for construction of 4D infant cortical surface atlases. Moreover, we have a very unique cohort of longitudinal infant multimodal MRI scans, where each infant was scanned every 3 months in the first year since birth and then every 6 months in the second year.
As existing methods for 4D atlas construction either lead to longitudinally-inconsistent atlases or are biased by specific time points (Davis et al., 2010; Durrleman et al., 2009; Liao et al., 2012), we develop a new method for construction of 4D infant cortical surface atlases that are longitudinally-consistent and unbiased to any individual and any time point, by capitalizing on the within-subject longitudinal constraints and also the unbiased groupwise surface registration. Leveraging our unique longitudinal infant MRI dataset and our infant-dedicated computational tools, in this paper, we construct the first spatiotemporal (4D) high-definition cortical surface atlases to characterize the dynamic developing cortical structures at 7 time points, including 1, 3, 6, 9, 12, 18, and 24 months of age, based on 202 longitudinal MRI scans from 35 typically developing infants. Based on our 4D surface atlases, we reveal hitherto unseen region-specific correlation patterns of dynamic cortical developmental trajectories between different cortical regions. A preliminary version of this work was presented at the International Conference on Medical Image Computing and Computer Assisted Intervention (MICCAI) (Li et al., 2014c). This paper significantly extends the previous work with more details on introduction of methodology and also more extensive validations and discussions.
2. Materials and Methods
2.1 Subjects and MR Image Acquisition
This study was approved by the Institutional Review Board of the University of North Carolina (UNC) School of Medicine. Pregnant mothers were recruited during the second trimester of pregnancy from the UNC hospitals. Informed consent was obtained from all parents. Exclusion criteria included abnormalities on fetal ultrasound, or major medical or psychotic illness in the mother. Infants in the study cohort were free of congenital anomalies, metabolic disease, and focal lesions. All infants were scanned unsedated while asleep, fitted with ear protection and with their heads secured in a vacuum-fixation device. A physician or nurse was present during each scan, and a pulse oximeter was used to monitor heart rate and oxygen saturation. More information on subjects can be found in (Li et al., 2014a; Nie et al., 2012b; Wang et al., 2012).
Serial T1-weighted, T2-weighted, and diffusion-weighted MR images of 35 healthy infants (18 males/17 females) were acquired using a Siemens 3T head-only MR scanner with a 32 channel head coil. Each infant was scheduled to be scanned every 3 months in the first year since birth and then every 6 months in the second year. All images were reviewed by a neuroradiologist and images with insufficient quality were removed from the study. Due to insufficient-quality and uncompleted scans, each infant has different number of scans, ranging from 4 to 7 in the first two years. In total, 202 quality MR scans from 35 infants were acquired, with each infant having 5.8 scans on average. The number of scans was 35 at 1 month, 28 at 3 months, 31 at 6 months, 27 at 9 months, 29 at 12 months, 31 at 18 months, and 21 at 24 months, respectively.
T1-weighted MR images (144 sagittal slices) were acquired with the imaging parameters: TR/TE = 1900/4.38 ms, flip angle = 7, acquisition matrix = 256 × 192, and resolution = 1 × 1 × 1 mm3. T2-weighted MR images (64 axial slices) were acquired with the parameters: TR/TE = 7380/119 ms, flip angle = 150, acquisition matrix = 256 × 128, and resolution = 1.25 × 1.25 × 1.95 mm3. Diffusion-weighted images (DWI) (60 axial slices) were acquired with the parameters: TR/TE = 7680/82 ms, acquisition matrix = 128 × 96, resolution = 2×2×2 mm3, 42 non-collinear diffusion gradients, and diffusion weighting b =1000s/mm2. More information on image acquisition can be found in (Nie et al., 2012b; Wang et al., 2012).
2.2 Image Preprocessing
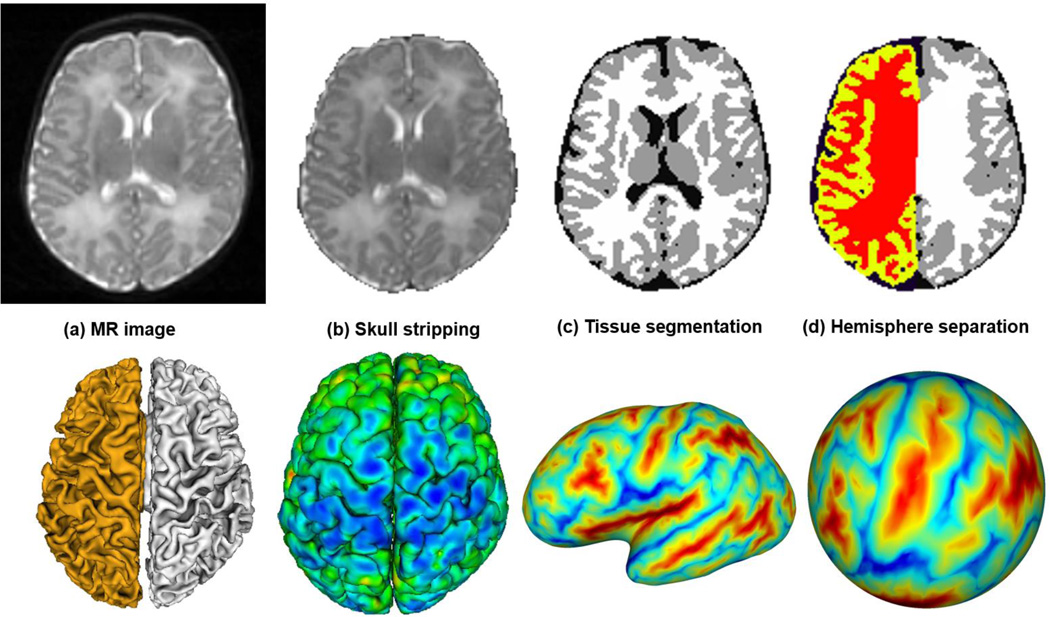
All MR images were preprocessed using an infant-specific computational pipeline as detailed in (Li et al., 2013; Li et al., 2014b; Li et al., 2014f). Briefly, it includes the following major steps: 1) distortion correction of DWI and also the computation of fractional anisotropy (FA) image (Wang et al., 2012; Yap et al., 2011); 2) rigid alignment of T2 and FA images onto their T1 image and further resampling to be of 1 × 1 × 1 mm3 using FLIRT in FSL (Smith et al., 2004); 3) skull stripping by a learning-based method (Shi et al., 2012) and further removal of cerebellum and brain stem by registration with an atlas (Shen and Davatzikos, 2002), as shown in Fig. 2b; 4) correction of intensity inhomogeneity by N3 (Sled et al., 1998); 5) rigid alignment of all longitudinal images of the same infant; 6) longitudinally-consistent tissue segmentation by an infant-dedicated, 4D level-set method (Wang et al., 2014a; Wang et al., 2011; Wang et al., 2012), based on the complementary multimodal information from T1, T2, and FA images, for reducing the structural ambiguities in tissue segmentation owing to low image contrast, as shown in Fig. 2c; 7) masking of and filling non-cortical structures, and separation of each brain into left and right hemispheres (Li et al., 2013; Li et al., 2014b), as shown in Fig. 2d.
Fig. 2.
Illustration of several major steps involved in our computational pipeline for infant cortical surface reconstruction and mapping.
2.3 Cortical Surface Reconstruction
For each hemisphere of each image, topologically correct and geometrically accurate inner and outer cortical surfaces, which were represented by triangular meshes, were reconstructed by using a topology-preserving deformable surface method (Li et al., 2014a; Li et al., 2012), based on tissue segmentation results. Specifically, the inner cortical surface (white/gray matter interface) was reconstructed by first correction of topological defects in the white matter by using in-house developed tools and then tessellation of the corrected white matter as a triangular mesh (Fig. 2e). To address the severe partial volume effects in the tight sulci of small-sized infant brain MRI, which might result in incorrect reconstruction of the outer cortical surface, explicit thin separations between opposite tight sulci were further recovered (Han et al., 2004; Li et al., 2014a; Li et al., 2012). Next, the inner cortical surface was deformed using forces derived from Laplace’s equation to reconstruct the outer cortical surface by preserving its initial topology (Li et al., 2014a; Li et al., 2012). The cortical thickness of each vertex was then computed as the average value of the minimum distance from inner to outer surfaces and the minimum distance from outer to inner surfaces (Fig. 2f). For cortical surface registration, the inner cortical surface was further smoothed, inflated, and mapped to a sphere by minimizing the metric distortion between the cortical surface and its spherical representation (Fischl et al., 1999a), as shown in Fig. 2g and Fig. 2h, where both the inflated surface and the spherical surface were color-coded by the average convexity of each vertex on the cortical surface. Our infant-specific computational pipeline for cortical surface-based analysis has been extensively verified on more than 500 infant brain MR images (Li et al., 2014a; Li et al., 2013; Lyall et al., 2014).
2.4 Construction of Longitudinally Consistent 4D Infant Cortical Surface Atlases
To construct cortical surface atlases, we had to determine cortical correspondences across different subjects. As using the cortical surface of any specific subject as the template for surface registration would inevitably introduce bias, groupwise surface registration can be employed as an unbiased manner to establish inter-subject cortical correspondences. Therefore, one straightforward strategy for 4D cortical surface atlas construction was to independently register the spherical surfaces of all infants at each age using groupwise surface registration. However, this strategy ignored the within-subject longitudinal constraints and thus could lead to temporally inconsistent surface atlases, eventually resulting in inaccurate analysis of the dynamic cortex development. This was because cortical surface registration typically involved highly-complex nonlinear optimization, owing to the highly convoluted and variable cortical folding patterns, thus independent groupwise registration at each age would inevitably lead to inconsistent inter-subject cortical correspondences across different ages. In other words, inter-subject corresponding vertices at one time point might not be corresponding vertices at the other time points any more. To ensure the longitudinal consistency of inter-subject cortical correspondences, another strategy was to first register all cortical surfaces of the same infant to a specific time point (e.g., the first or the last time point), and then establish inter-subject cortical correspondences at this specific time point by using groupwise surface registration. Finally, longitudinally-consistent inter-subject cortical correspondences at other time points can be determined based on those established at the selected time point. However, 4D cortical surface atlases constructed by this strategy would be eventually biased and dominated by the selected time point.
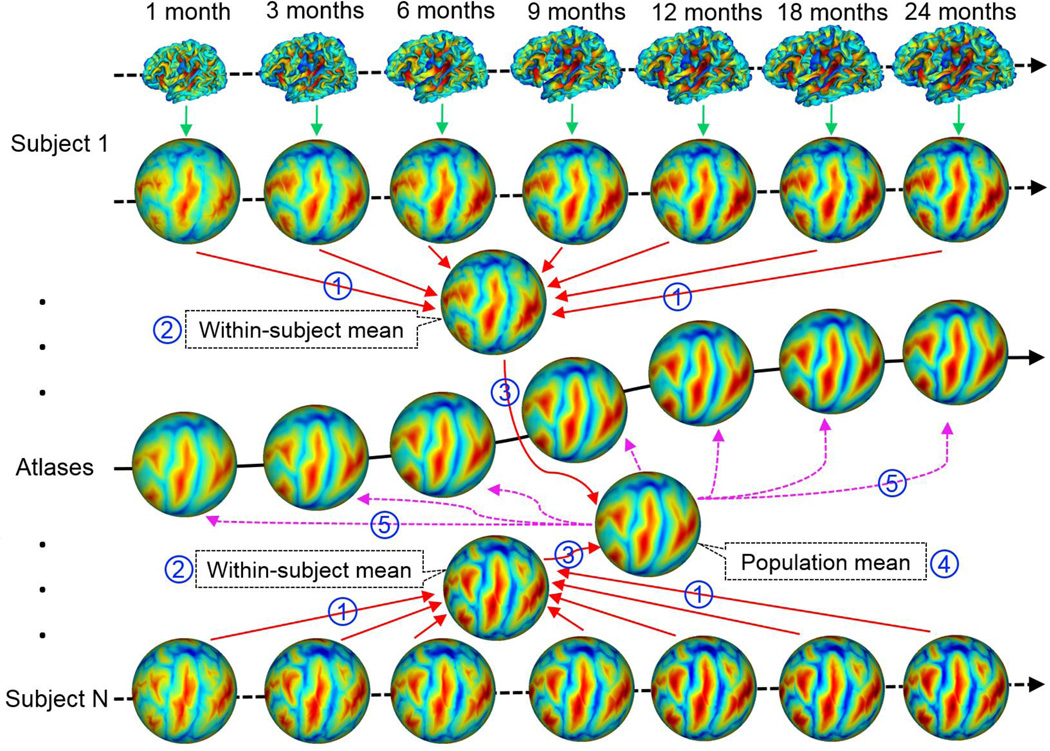
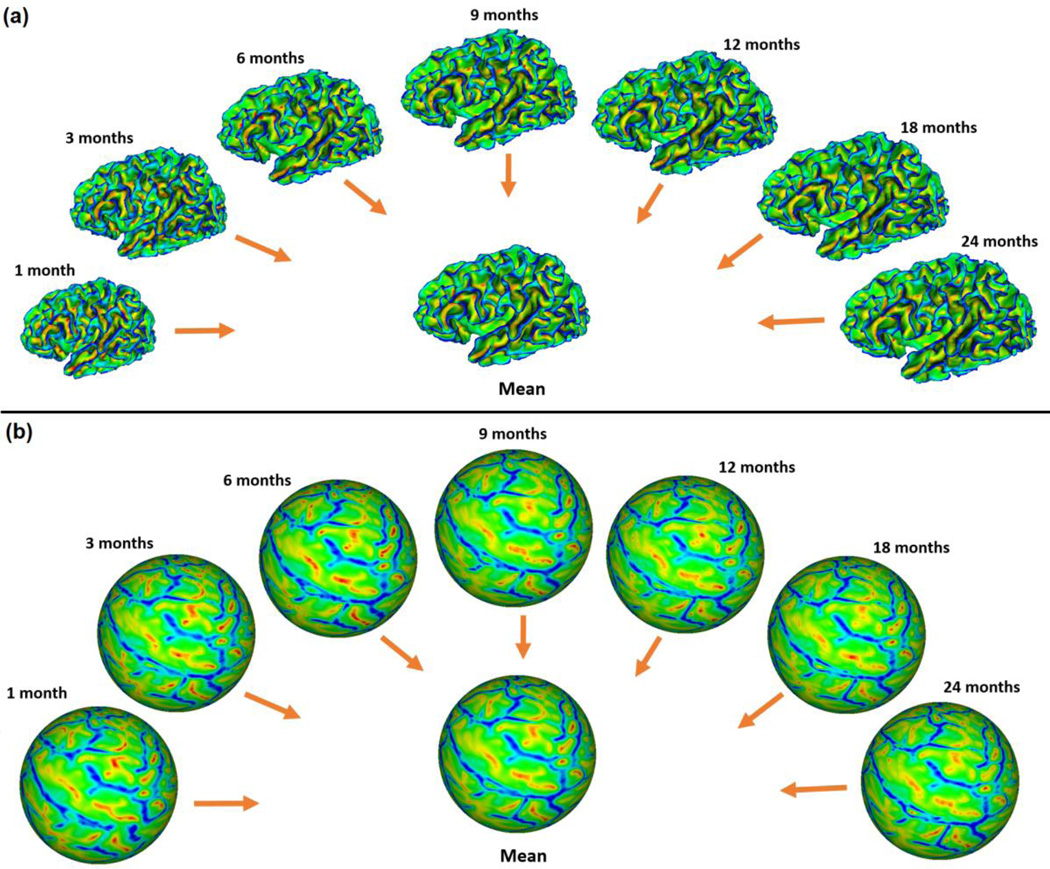
Therefore, we proposed a novel framework to ensure both longitudinal consistency and unbiasedness to any individual and any age in the constructed 4D infant cortical surface atlases, by capitalizing on the within-subject longitudinal constraints and also the unbiased groupwise surface registration. Herein, both within-subject and inter-subject cortical correspondences were established by using the diffeomorphic Spherical Demons groupwise registration method (Yeo et al., 2010). Specifically, our method for construction of consistent and unbiased 4D infant cortical surface atlases consisted of the following 5 major steps, as shown in Fig. 3. First, to establish within-subject cortical correspondences that were unbiased to any time point, for each hemisphere, all longitudinal spherical surfaces of the same infant were groupwisely aligned using Spherical Demons (Yeo et al., 2010), based on their geometric features of cortical folding (Step 1 in Fig. 3). Specifically, Spherical Demons aligned the cortical folding patterns mapped on the spherical space based on several geometric features, including mean curvature of the inflated cortical surface, average convexity of the cortical surface, and mean curvature of the cortical surface. It has been shown that Spherical Demons achieved similar registration accuracy as FreeSurfer, but with a much faster computational speed. To use Spherical Demons for groupwise surface registration, 1) a template consisting of the mean and variance of cortical geometric features of all subjects in a group was created; 2) all cortical surfaces in the group were nonlinearly registered to the created template; 3) the template was then updated based on the currently refined registration results. These steps of registration and template updating were iteratively performed. In our application, for both within-subject and inter-subject registration, 3 iterations were performed for achieving reasonable results, since there was no large change of registration accuracy after 3 iterations, and also too many iterations typically resulted in over-fitting (Yeo et al., 2008). Second, for each infant, the geometric features of the within-subject mean cortical folding were derived based on their cortical correspondences established in Step 1. Note that, as all primary and secondary cortical folding are present at term birth and are preserved during the postnatal cortex development (Hill et al., 2010a; Li et al., 2013), the within-subject cortical folding patterns were well aligned by Spherical Demons. Therefore, the within-subject mean cortical folding was very sharp and contained very detailed information of cortical folding patterns, as shown in Fig. 3 and Fig. 4. Third, to establish unbiased inter-subject cortical correspondences, the within-subject mean cortical folding of all infants were groupwisely aligned using Spherical Demons (Step 3 in Fig. 3). Fourth, to determine temporally-consistent inter-subject cortical correspondences, for each age, the inter-subject cortical correspondences were established based on the cortical correspondences defined by their within-subject mean cortical folding, and each cortical surface was accordingly resampled to a standard-mesh tessellation with 163,842 vertices. Of note, we chose the mesh tessellation with 163,842 vertices (subdivision level 7 of an icosahedron) in order to well preserve the spatial detailed information of the convoluted cortical surface in infants, which typically had less than 110,000 vertices for each hemisphere. Finally, for each age, a cortical surface atlas consisting of the mean and variance of geometric features of cortical folding, e.g., mean curvature, sulcal depth, average convexity, and mean curvature of inflated surfaces, across all infants at this age was constructed on the spherical surface (Step 5 in Fig. 3), which preserved the inherent topological properties of the cortex and greatly facilitated cortical surface registration and analysis. Note that, each geometric attribute reflects a different aspect of the cortex. For example, the mean curvature reflects the fine-scale geometry of cortical folding, while the average convexity (which records the accumulated normal movement for each vertex during surface inflation) reflects the large-scale geometry of cortical folding (Fischl et al., 1999b). In this way, the constructed 4D infant cortical surface atlases were temporally consistent and unbiased to any individual and any age, thus capturing both longitudinally-consistent mean shape changes and individual variability of cortical folding.
Fig. 3.
Illustration of the proposed method for construction of unbiased and longitudinally-consistent 4D infant cortical surface atlases. (1) Establishing unbiased within-subject cortical correspondences by groupwise surface registration; (2) Computing within-subject mean cortical folding; (3) Inter-subject groupwise surface registration based on geometric features of their within-subject mean cortical folding; (4) Establishing inter-subject cortical correspondences at each age based on the correspondences defined by their within-subject mean cortical folding; (5) Computing means and variances of geometric features of the cortical folding at each age. Here all spherical surfaces are color-coded by the average convexity maps of the cortical surfaces, which reflect the large-scale geometry of the cortical folding.
Fig. 4.
(a) Longitudinal inner cortical surfaces of the left hemisphere of a representative infant from 1 to 24 months of age, color-coded by the mean curvatures, as well as their within-subject mean cortical surface (color-coded by the average values of mean curvatures of all time points) computed based on the cortical correspondences established by within-subject groupwise surface registration. (b) Longitudinal spherical surfaces of the left hemisphere of the infant after within-subject groupwise registration, color-coded again by the mean curvatures, and their average values of mean curvature of all time points. Red colors indicate sulci, and blue colors indicate gyri. Here the mean curvature reflects the fine-scale geometry of the cortical folding. As we can see, the within-subject mean cortical folding is very sharp and contains very detailed information of folding patterns.
2.5 Application to Study Correlation Patterns of Early Brain Development
In our constructed 4D infant cortical surface atlases, each cortical surface of each infant has been aligned onto the same space. Based on this, for the first time, we can reveal the spatially-detailed correlation patterns of the dynamic early brain development between different cortical regions. To do this, one strategy was to first compute the developmental trajectory of the whole population for each vertex using a mixed model, and then compute the correlation matrix of developmental trajectories between each pair of vertices. However, as the early cortical developmental trajectories in infants were highly nonlinear and regionally heterogeneous (as illustrated in Fig. 1), the parametric forms of the mixed model might not be easily determined. Herein, we developed a new strategy by defining a subject-specific correlation matrix of the cortical developmental trajectories.
For each vertex of each infant, we first defined its longitudinal developmental trajectory by using cortical thickness, which essentially reflects the underlying dynamic microstructural changes of the cortex and is correlated with cognitive functions (Lyall et al., 2014). However, other cortical attributes, such as surface area and local gyrification index, could also be used to define the developmental trajectory. For each infant, we then computed its subject-specific correlation matrix of the developmental trajectories of cortical thickness between each pair of vertices using Pearson’s correlation. Specifically, for an infant subject s with ns time points, at a vertex i, its cortical thickness trajectory was denoted as . For two vertices i and j, Pearson’s correlation coefficient was computed as: . The range of was between −1 and 1, indicating that two vertices’ trajectories were either completely negatively or positively correlated. Note that Rs was defined for each pair of vertices and relied solely on the developmental trajectories. Finally, we computed the mean correlation matrix by averaging the corresponding elements of correlation matrices of all infants. To account for the dynamic cortex development in infants, before computing Pearson’s correlation, for each time point of each infant, the cortical thickness map was smoothed and normalized by the mean cortical thickness of the cortical surface.
3. Results
3.1 Visual Inspection of 4D Infant Cortical Surface Atlases
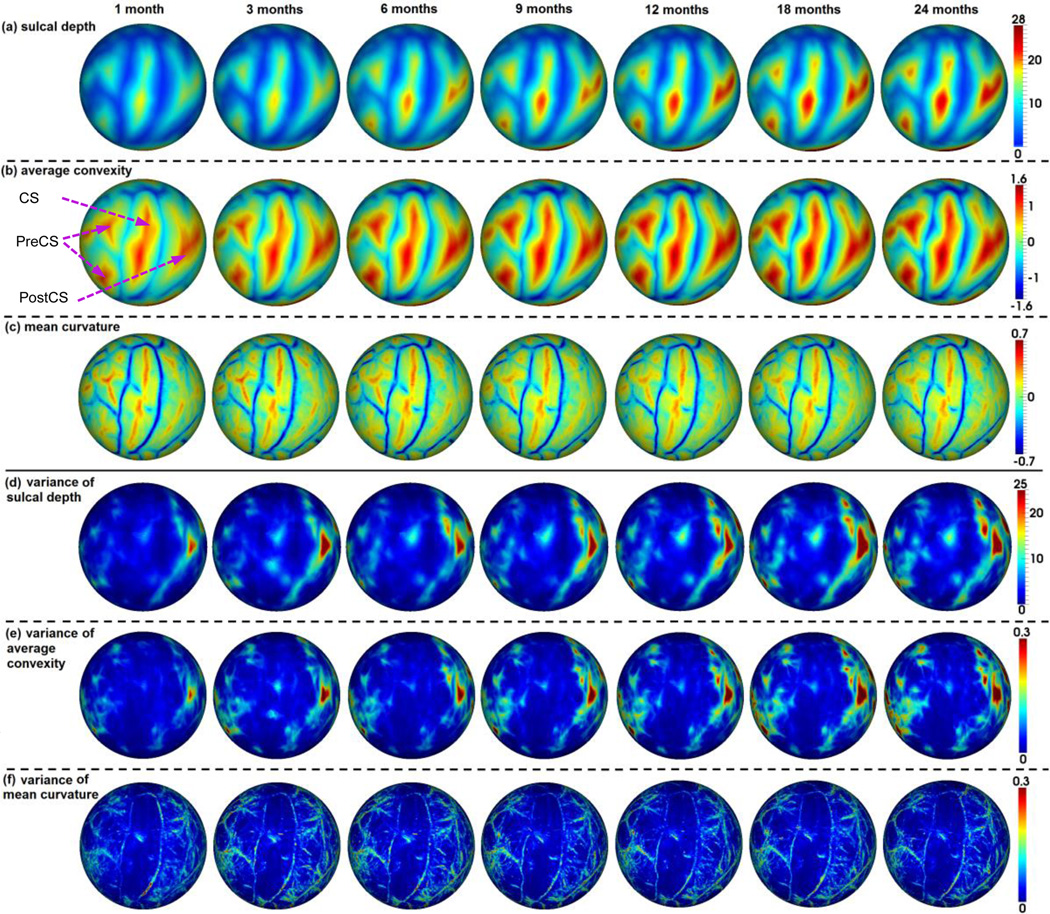
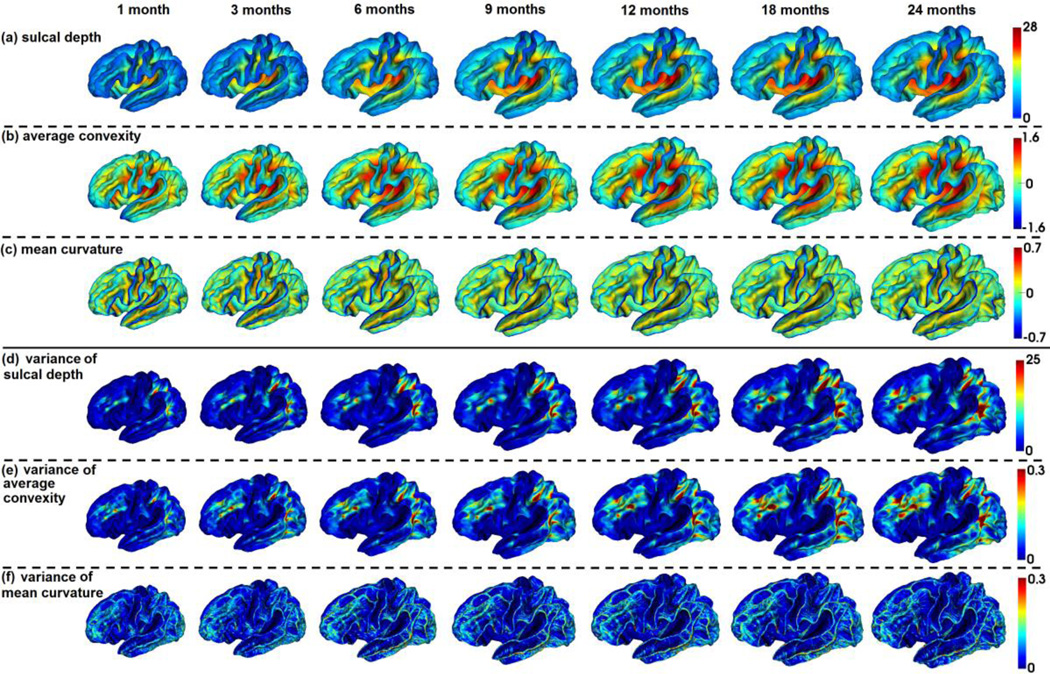
Fig. 5 showed the means and variances of the sulcal depth, average convexity, and mean curvature of our constructed 4D infant cortical surface atlases on the spherical space for the left hemisphere at 1, 3, 6, 9, 12, 18, and 24 months of age. Herein, the sulcal depth was defined as the distance from each vertex on the cortical surface to the nearest point in the cerebral hull surface, providing a continuously varying measure of both coarse and fine cortical folding geometry (Li et al., 2014b; Meng et al., 2014; Van Essen, 2005). As mentioned, the mean curvature reflected the fine-scale geometry of cortical folding, while the average convexity reflected the large-scale geometry of cortical folding (Fischl et al., 1999b). For better inspection of the 4D infant cortical surface atlases, we also mapped the means and variances of the geometric features of cortical folding onto the age-specific average cortical surface at each age, which was generated by averaging the 3D coordinate positions of corresponding cortical vertices across all subjects at each age. As can be seen from Figs 5 and 6, the major cortical folding patterns in terms of sulcal depth, average convexity, and mean curvature were established at term birth and were preserved well during the postnatal development during the first 24 months. However, the cortical surface area and the sulcal depth increased dramatically, and also the magnitude of the average convexity increased considerably, while the magnitude of the mean curvature decreased gradually. This was also confirmed in Fig. 7, which provided the mean values of the sulcal depth, absolute average convexity, and absolute mean curvature of each age on the 4D infant surface atlases. From Figs 5 and 6, we can also clearly observe large variances of the sulcal depth and average convexity in the intraparietal sulcus, parietotemporal junction area, and middle frontal cortex consistently across all ages, indicating large inter-subject variability of cortical folding in those regions. In contrast, the central sulcus consistently exhibited small inter-subject variability of cortical folding.
Fig. 5.
Constructed 4D infant cortical surface atlases on the spherical space at 1, 3, 6, 9, 12, 18, and 24 months of age. (a) Sulcal depth (mm). (b) Average convexity. (c) Mean curvature. Blue color indicates gyri, and red color indicates sulci. CS=Central Sulcus, PreCS=Precentral Sulcus, PostCS=Postcentral Sulcus. (d) Variance of sulcal depth. (e) Variance of average convexity. (f) Variance of mean curvature.
Fig. 6.
4D infant cortical surface atlases mapped onto the age-matched average cortical surfaces at 1, 3, 6, 9, 12, 18, and 24 months of age.
Fig. 7.
Mean values of (a) sulcal depth (mm), (b) absolute average convexity, and (c) absolute mean curvature on our 4D infant cortical surface atlases.
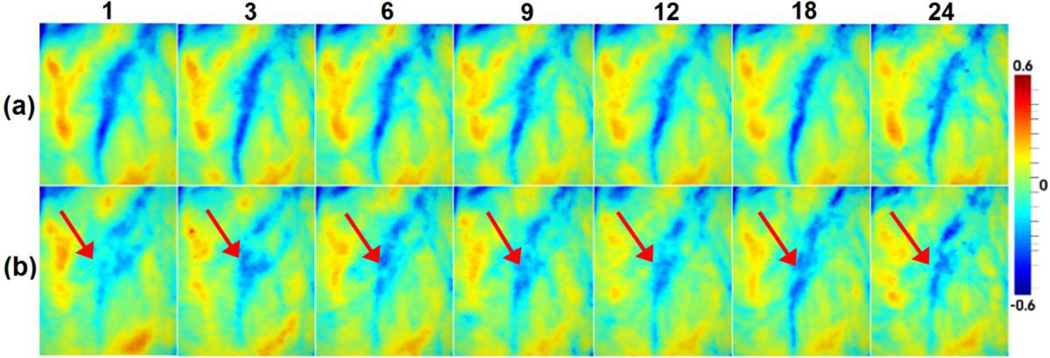
To demonstrate the advantage of the proposed method for 4D infant cortical surface atlas construction, we compared it with the conventional method that constructed the infant cortical surface atlases by independent groupwise registration of all surfaces at each time point. Fig. 8 provided a representative example for the close-up views of the mean curvatures on 4D infant cortical surface atlases constructed by the two different methods. Red arrows pointed to a representative region with inconsistent curvature pattern across different ages using independent groupwise registration. As we can see, the proposed method generated longitudinally more consistent 4D cortical surface atlases, along with much sharper and clearer cortical folding patterns, than the counterpart method that used independent groupwise registration of cortical surfaces for each time point.
Fig. 8.
Visual comparisons of 4D infant surface atlases (color-coded by the mean curvature) from 1 to 24 months, constructed by (a) the proposed method and (b) groupwise surface registration at each age independently.
3.2 Quantitative Evaluation of Accuracy for Spatial Normalization
To demonstrate the advantage of our 4D infant cortical surface atlases, we utilized them as templates for spatial normalization of cortical surfaces across different infants. For this purpose, we adopted two independent longitudinal infant MRI datasets. As it is very difficult to obtain other quality multimodal infant MRI datasets containing subjects in between the first postnatal year, herein we used the 35 infants as Dataset 1, with each subject having up to 7 time points scanned at 1, 3, 6, 9, 12, 18, and 24 months of age. For evaluation, we divided the Dataset 1 into three sub-groups, with the first and second sub-groups each containing 12 infants, and the third sub-group containing 11 infants, to perform 3-fold cross-validation. In each round, two subgroups were used to construct the 4D infant surface atlases, and the remaining sub-group was used for validation. For more extensive validation, we also adopted an independent Dataset 2, which included 73 healthy infants, each having 3 time points scanned at 1 month, 1 year, and 2 years of age. For each time point of each infant, we nonlinearly registered these cortical surfaces onto the age-matched atlas in the 4D infant surface atlases by using Spherical Demons. For comparison, we also performed the registration by using the infant surface atlases generated by independent groupwise registration at each age (named independent infant surface atlases) and also the FreeSurfer adult surface atlas as the templates. It was expected that using our 4D infant surface atlases would lead to better registration accuracy than the other two comparison atlases. As there was no ground truth for the cortical surface registration, to quantitatively evaluate the accuracy of the registration results, we adopted three different measurements: 1) average information entropy of the sulcal and gyral regions of all aligned cortical surfaces at each age; 2) pairwise overlap of sulcal and gyral regions between each pair of subjects at each age; 3) correlation coefficient of the average convexity map between each pair of subjects at each age. For the first two measurements, we first partitioned each cortical surface into sulcal regions and gyral regions based on the average convexity map, as in FreeSurfer (Fischl, 2012). Then, for each age, we computed the average information entropy of the sulcal and gyral regions of all aligned cortical surfaces as:
| (1) |
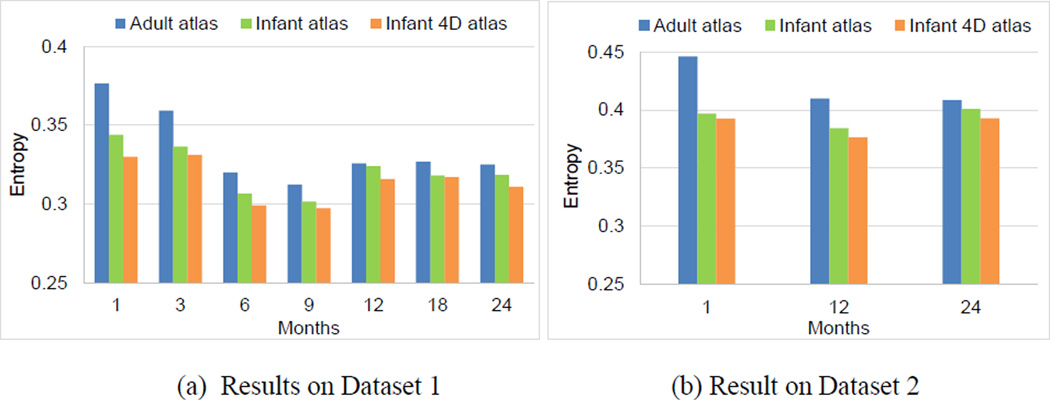
Here, N was the total number of vertices. psulci(x) and pgyri(x) were the probabilities of vertex x belonging to the sulcal region and gyral region, respectively, estimated based on the frequency in the aligned cortical surfaces. This measurement has been previously adopted for evaluating the performance of surface registration in (Lyttelton et al., 2007). Intuitively, lower values of information entropy indicated better alignment of sulcal and gyral regions. As shown in Fig. 9, at each age in both datasets, infant surface atlases consistently leaded to lower information entropy than FreeSurfer adult surface atlas, with particularly significant improvement at 1 month and 3 months of age, demonstrating more suitability of using age-matched atlases for early brain development. Meanwhile, our 4D infant surface atlases consistently achieved lower information entropy than both independent infant surface atlases and FreeSurfer adult surface atlas. Specifically, on Dataset 1, the average information entropy across all 7 time points were 0.314 by our 4D infant surface atlases, 0.321 by independent infant surface atlases, and 0.335 by FreeSurfer adult surface atlas, respectively. On Dataset 2, these values were 0.387 by our 4D infant surface atlases, 0.394 by independent infant surface atlases, and 0.421 by FreeSurfer adult surface atlas, respectively.
Fig. 9.
Average information entropy of the sulcal and gyral regions of all aligned cortical surfaces at each age, by using 4D infant surface atlases, independent infant surface atlases, and FreeSurfer adult surface atlases as the templates.
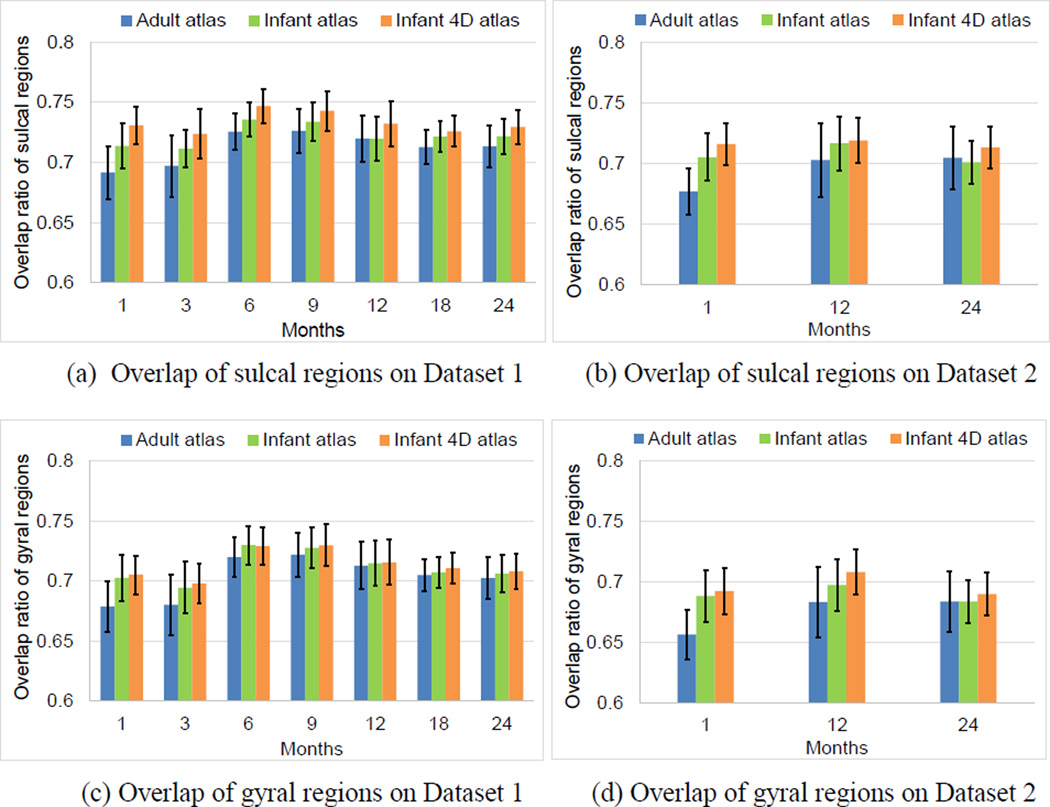
Meanwhile, at each age, we also computed the mean overlap ratio of sulcal and gyral regions between each pair of subjects on their aligned cortical surfaces. Herein, higher overlap ratios indicated better alignment of the sulcal and gyral regions between subjects. As shown in Fig. 10, at each age of each dataset, our 4D infant surface atlases consistently achieved higher overlap ratios for both sulcal and gyral regions than both independent infant surface atlases and FreeSurfer adult surface atlas. Specifically, on Dataset 1 across all ages, for the sulcal regions, the mean overlap ratio were 0.732 by 4D infant surface atlases, 0.721 by independent infant surface atlases, and 0.712 by FreeSurfer adult surface atlas, respectively. For the gyral regions, the values were 0.713 by 4D infant surface atlases, 0.712 by independent infant surface atlases, and 0.703 by FreeSurfer adult surface atlas, respectively. On Dataset 2, for the sulcal/gyral regions, the mean overlap ratio were 0.716/0.697 by 4D infant surface atlases, 0.707/0.690 by independent infant surface atlases, and 0.695/0.674 by FreeSurfer adult surface atlas, respectively.
Fig. 10.
Means and standard deviations of the overlap ratio of the sulcal and gyral regions between each pair of subjects on their aligned cortical surfaces at each age, by using 4D infant surface atlases, independent infant surface atlases, and FreeSurfer adult surface atlas as the templates.
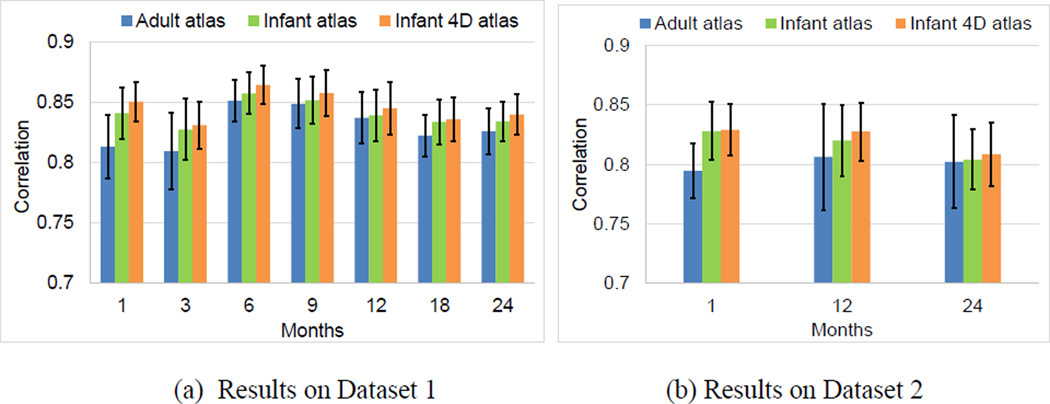
To further evaluate the accuracy, we also computed the correlation coefficient of the average convexity map between each pair of subjects at each age on their aligned cortical surfaces, as in (Lyttelton et al., 2007). Fig. 11 displayed the mean and standard deviation of the correlation coefficient at each age. Herein, larger correlation coefficients indicated better alignment of cortical surfaces across different subjects. As can be seen again, at each age in both datasets, our 4D infant surface atlases consistently achieved significantly higher correlation coefficients than the other two atlases. Specifically, on Dataset 1 across all ages, the average correlation coefficients were 0.847 by 4D infant surface atlases, 0.841 by independent infant surface atlases, and 0.830 by FreeSurfer adult surface atlas, respectively. On Dataset 2, these values were 0.822 by 4D infant surface atlases, 0.817 by independent infant surface atlases, and 0.801 by FreeSurfer adult surface atlas, respectively.
Fig. 11.
Mean and standard deviation of the correlation coefficients of the average convexity map between each pair of subjects at each age on their aligned cortical surfaces, by using different surface atlases as the templates.
3.3 Quantitative Evaluation of Temporal Consistency of Spatial Normalization
Since our 4D infant cortical surface atlases were constructed in the same space, the vertex-to-vertex correspondences across different time points were naturally established among those atlases. Therefore, after registration of each cortical surface of each infant onto the 4D infant surface atlases, the within-subject longitudinal cortical correspondences in each infant were also approximately established. To quantitatively evaluate the longitudinal consistency after registration to 4D infant surface atlases, for each infant, we defined a longitudinal consistency measure for sulcal and gyral regions as:
| (2) |
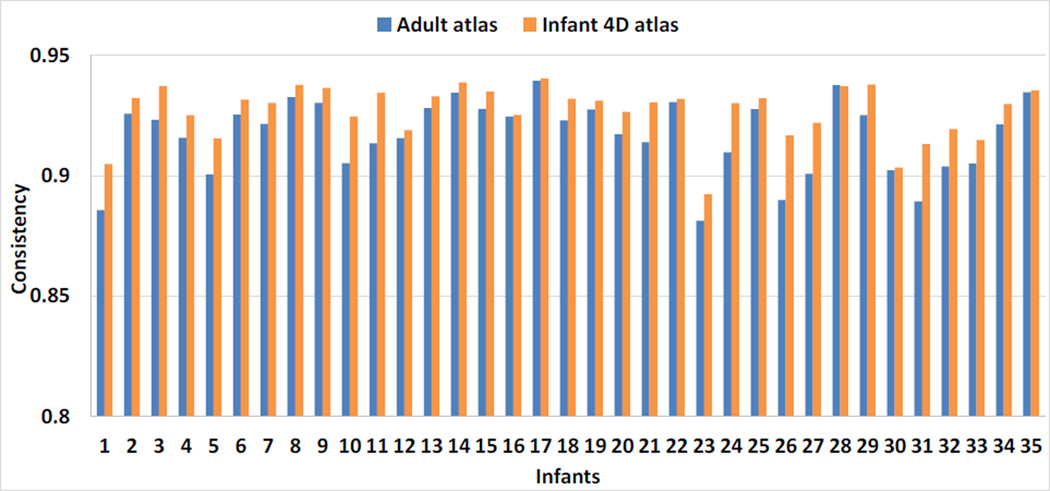
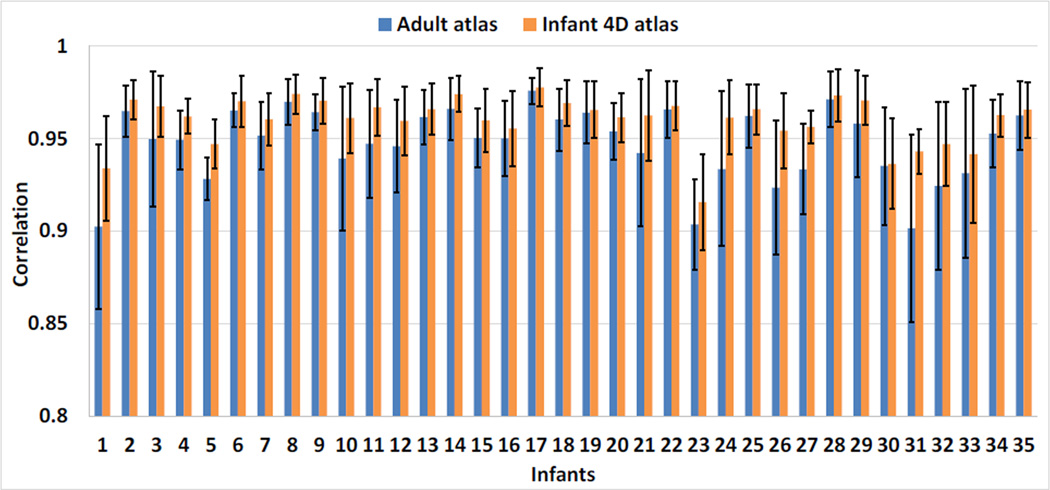
where a(x) was the accumulated time of region label (sulcal region or gyral region) changes between each pair of temporally neighboring time points at vertex x, on the aligned cortical surfaces in the atlas space. T was the total number of time points of an infant. Ideally, C should be close to 1, and larger values of C indicated better temporal consistency of the surface registration results. Since the Dataset 2 only had three time points, we only computed longitudinal consistency measure on Dataset 1. Fig. 12 showed the consistency measure in each of the 35 infants by our 4D infant surface atlases and FreeSurfer adult surface atlas. Note that, herein we didn’t compare with independent infant surface atlases, because across different ages they were not located in the same spatial space, thus leading to unaligned longitudinal cortical surfaces in each infant after registration onto its age-matched infant surface atlas. As we can see, 4D infant surface atlases achieved longitudinally more consistent results than FreeSurfer adult surface atlas. Specifically, the average consistency measures of all infants were 0.927±0.011 by our 4D infant surface atlases and 0.917±0.015 by FreeSurfer adult surface atlas, respectively. Meanwhile, we also computed the correlation coefficient of the average convexity map between each pair of temporally neighboring cortical surfaces in the atlas spaces, as shown in Fig. 13. As can be seen again, our 4D infant surface atlases consistently leaded to higher within-subject correlations than FreeSurfer adult atlas. Of note, subjects with relatively low values in Fig. 12 and Fig. 13 had relatively less consistent tissue segmentation results over time than other subjects, which was likely caused by motion artifacts during infant MR scanning, although for these subjects their tissue segmentation and surface reconstruction results at each time point were still quite reasonable. In summary, the average correlation coefficient across all infants were 0.960±0.016 by 4D infant surface atlases and 0.947±0.024 by FreeSurfer adult surface atlas, respectively, indicating better longitudinal consistency by 4D infant surface atlases.
Fig. 12.
Longitudinal consistency measure of sulcal and gyral regions in each of 35 infants by registration onto FreeSurfer adult surface atlas and 4D infant surface atlases.
Fig. 13.
Mean and standard deviation of the correlation coefficients of the average convexity map between each pair temporally neighboring cortical surfaces in each of 35 infants, by registration onto FreeSurfer adult surface atlas and 4D infant surface atlases.
3.4 Mapping Correlation Patterns of Early Brain Development
In this section, for the first time, we revealed the spatially-detailed correlation patterns of dynamic developmental trajectories of cortical thickness between different cortical regions in infants. Fig. 14 showed the average Pearson’s correlation maps of the developmental trajectories of cortical thickness between each vertex and all other vertices of 12 randomly selected infants, along with the mean correlation maps of all 35 infants. Individual variations of correlation patterns may come from inherent inter-subject variability of developmental patterns or each infant having different number of scans. However, the overall correlation patterns (positive vs. negative correlations) of individuals were quite similar with those of the averaged patterns of all infants. Specifically, the primary motor, somatosensory, superior parietal, and visual cortices have strong positive correlations with other regions, while lateral temporal, insula, inferior frontal, and superior frontal cortices have strong negative correlations with other regions in their developmental trajectories. Of note, the average correlation map may potentially be confounded by regional variations of surface alignment errors, e.g., the association cortex with more variable cortical folding patterns may have relatively lower alignment accuracies than the unimodal cortex.
Fig. 14.
Average Pearson’s correlation map of the developmental trajectories of cortical thickness between each vertex and all other vertices. (a)–(b) Correlation maps of 12 randomly selected infants. (c)–(d) Mean correlation maps of 35 infants. Both lateral and medial views are provided.
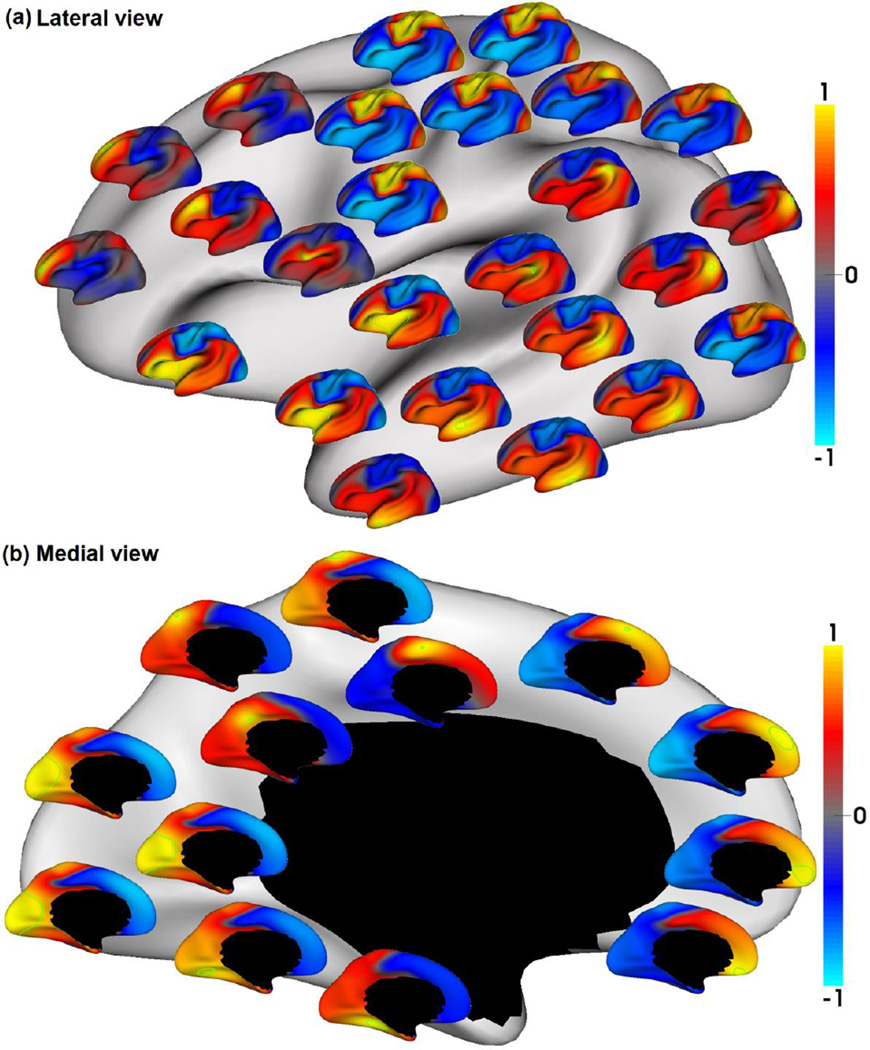
To reveal spatially-detailed correlation patterns of cortical developmental trajectories, Fig. 15 displayed the seed-based analysis of group averaged correlation patterns of cortical thickness developmental trajectories from 35 infants. For each of 38 relatively uniformly distributed seeds, its correlation map with all other vertices was shown as a respective color-coded small cortical surface map. Green curves in each small surface map enclosed the regions with p < 0.05 after FDR correction for multiple comparisons (Benjamini and Hochberg, 1995). As can be seen, the correlation patterns were extremely variable across different regions. For example, seeds in the superior parietal cortex and unimodal cortex, i.e., primary motor cortex, primary somatosensory cortex, and visual cortex, always had strong positive correlations with vertices in those regions, and strong negative correlations with vertices in the insula cortex and heteromodal association cortex, e.g., lateral temporal cortex, prefrontal cortex, and inferior parietal lobule. While seeds in the lateral temporal cortex, inferior parietal lobule, and insula cortex always had strong positive correlations with vertices in those regions, and strong negative correlations with vertices in the unimodal cortex and superior parietal cortex. In contrast, seeds in the dorsolateral prefrontal cortex had quite variable correlation patterns across different seed positions, with strong positive correlations only with nearby vertices. Seeds in the medial frontal cortex had strong positive correlations with vertices in this region, and also strong negative correlations with medial parietal, occipital, and temporal regions.
Fig. 15.
Seed-based analysis of group averaged correlation patterns of cortical thickness developmental trajectories from 35 infants. For each of 38 seeds, its correlation map with all other vertices is shown as a respective color-coded small surface map. Green curves enclose the regions with p < 0.05 after FDR correction for multiple comparisons.
4. Discussion and Conclusion
This paper presented an original method for construction of 4D infant cortical surface atlases that were longitudinally-consistent and unbiased to any individual and any time point, by capitalizing on the within-subject longitudinal constraints and also the unbiased groupwise surface registration. To the best of our knowledge, this is the first method for construction of longitudinally-consistent and unbiased 4D cortical surface atlases. Although several methods have been proposed for construction of longitudinal 4D volumetric atlases, they either leaded to longitudinally-inconsistent atlases or were biased by specific time points (Davis et al., 2010; Durrleman et al., 2009; Liao et al., 2012). Leveraging the proposed method and our unique longitudinal infant MRI dataset as well as our infant-dedicated pipeline for cortical surface-based analysis, we have unprecedentedly constructed the 4D infant cortical surface atlases with 7 time points, including 1, 3, 6, 9, 12, 18, and 24 months of age, to comprehensively characterize the dynamic, nonlinear development of the cortex during the first two postnatal years. From our constructed 4D surface atlases, we found that all major cortical folding was present at 1 month and were preserved thereafter, consistent with the previous studies of cortical folding in infants (Hill et al., 2010a; Li et al., 2013; Meng et al., 2014). We also observed small inter-subject variability of sulcal depth in the central sulcus, and large inter-subject variability in the frontal and parietal regions in 4D infant surface atlases consistently from 1 to 24 months, in line with the finding in the term born neonates and adults (Hill et al., 2010a). One contradiction with the existing studies is that we found the relatively small inter-subject variability of sulcal depth in the middle region of the superior temporal sulcus consistently from 1 month to 24 months of age, in contrast to the observed large inter-subject variability in this region in neonates (Hill et al., 2010a). A possible explanation is that (Hill et al., 2010a) purely used landmark curves to drive surface registration, without leveraging the rich geometric information of cortical folding, especially for the regions far away from landmark curves, e.g., the middle region of the superior temporal sulcus, thus leading to less accurate alignment of cortical surfaces. We also noticed that the sulcal depth in 4D surface atlases increased more dynamically in the first year than in the second year, consistent with our previous findings in studying cortical surface area expansion (Li et al., 2013) and cortical gyrification development in infants (Li et al., 2014f).
Using our 4D infant surface atlases as age-matched templates for spatial normalization of infant subjects has led to significantly improved accuracy and longitudinal consistency, in comparison with infant surface atlases constructed without longitudinal consistency and also FreeSurfer adult surface atlas. Our 4D surface atlases will have a range of applications in early brain development studies. For example, in the cross-sectional studies of infant brain development, registration of all cortical surfaces at different ages onto the atlas of a specific age would eventually bias the results and also lead to less accurate results for those subjects unmatching with the age of the atlas. Since our 4D infant cortical surface atlases were constructed in the same space for all ages, we can register individual cortical surfaces at different ages onto their age-matched 4D surface atlases to naturally establish more accurate and unbiased inter-subject cortical correspondences both at the same age and across different ages.
To build 4D infant cortical surface atlases, we need to first reconstruct cortical surfaces based on the tissue segmentation results of infant brain MRI. However, segmentation of infant MRI is extremely challenging due to the poor tissue contrast, severe partial volume effect, dynamic changes of intensity appearance, and the ongoing maturation and myelination processes, as shown in Fig. 1. In neonates, T2 images have much better tissue contrast than T1 images (Wang et al., 2014b). While, in around 6 months of age, both T1 and T2 images have extreme low tissue contrast. Therefore, only by adaptive integration of complementary information from multimodal images of T1, T2 and FA (derived from DTI) images, we can achieve accurate and reliable tissue segmentation and cortical surface reconstruction for infant MRI (Wang et al., 2014a). This is in contrast to adults, where T1 images are typically adopted for tissue segmentation and surface reconstruction. Moreover, to deal with the poor tissue contrast during early infancy, we used images at later time points with clear cortical structures to guide the tissue segmentation during early infancy for achieving accurate and longitudinally-consistent results (Wang et al., 2012). This is mainly because all primary and secondary cortical folding are present at term birth and preserved during postnatal brain development (Hill et al., 2010a; Li et al., 2013; Meng et al., 2014). Indeed, this strategy greatly increases the accuracy and longitudinal-consistency of the tissue segmentation, and subsequently the cortical surface reconstruction and registration results. Despite using this advanced strategy, surface atlases at later time points still likely have better quality than those at early time points.
Based on our constructed 4D infant cortical surface atlases, for the first time, we investigated the spatially-detailed correlation patterns of the early dynamic developmental trajectories of cortical thickness between different cortical regions. To do this, we innovatively constructed subject-specific correlation matrix. Our results suggested that the correlation patterns of cortical thickness trajectories were extremely variable across different regions during this critical period of rapid cortex development. Specifically, we revealed several hitherto unseen properties of the correlation patterns of cortical thickness developmental trajectories in infants, including 1) the global correlation patterns (positive vs. negative correlations) of individuals were quite similar with each other, despite considerable inter-subjects variations of correlation magnitudes; 2) the unimodal cortex and superior parietal cortex had strong positive correlations with vertices in these regions, and also strong negative correlations with vertices in the heteromodal association cortex and insula cortex, and vice versa; 3) the high-order prefrontal cortex exhibited extremely variable correlation patterns with other regions, with large correlations only with nearby vertices. To the best of our knowledge, previous studies of early brain development have been limited to either point-wise or region-based longitudinal developmental trajectories or cross-sectional inter-region correlations (Gilmore et al., 2012; Li et al., 2013; Li et al., 2014f; Lyall et al., 2014; Nie et al., 2014). Distinct correlation patterns between unimodal cortex and high-order association cortex are likely related to their differential growth patterns. For example, primary sensory, superior parietal, visual regions all have low values of cortical thickness, and also low-growth of cortical thickness in the first year, whereas high-order association cortex, insula cortex and cingulate cortex exhibit high-growth of cortical thickness (Lyall et al., 2014). Moreover, our previous studies of cortical local gyrification development in infants also revealed a pattern of low-growth in unimodal regions (primary motor, somatosensory, and visual cortices) and high-growth in high-order association regions (lateral prefrontal, lateral temporal, and inferior parietal cortices) in the first postnatal year (Li et al., 2014f). This study has greatly bridged the critical knowledge gap on the correlation patterns of longitudinal cortical developmental trajectories of early brain development. However, we should mention that simply averaging subject-specific correlation matrices might not be the best strategy to study the population’s correlation patterns. In our future work, we will investigate better strategies to account for inter-subject variability.
There still exist several potential limitations in our 4D infant cortical surface atlases. First, we used 35 typically developing infants for construction of the first 4D infant surface atlases. Given the remarkable inter-subject variability in terms of cortical folding and cortical developmental trajectories, more infant subjects are expected for 4D surface atlases construction in order to fully capture the inter-subject variability. Second, owing to uncompleted or insufficient quality scans, each time point had a different number of subjects for construction of 4D infant surface atlases, which introduced biases at certain time points. Using more subjects from large-scale longitudinal infant dataset as being acquired in our institute would mitigate this problem. Another strategy is to first estimate the missing cortical data by learning information from both subject-specific and population-based developmental trajectories, and then construct the 4D surface atlases using both the existing cortical data and the estimated cortical data. Third, our 4D infant surface atlases were constructed in its own space. To maximize the usage, we will concatenate our 4D infant cortical surface atlases with some existing cortical surface atlases by establishing inter-atlas vertex correspondences. At last, currently only normal infants were used to construct 4D surface atlases. Although, our 4D infant surface atlases can be generally used in various studies of early brain development, there exist possible cortical structural differences between normal and abnormal infants, between males and females, and between different ethnicities. Thus, disorder-specific, gender-specific and ethnicity-specific atlases, which could better capture the cortical structural information when studying particular populations, may further improve the accuracy in some specific studies. In the future, we will also add infants with or at risk for neurodevelopmental disorders for atlas construction.
In our future work, we will also add more attributes of the cortex, e.g., local gyrification index (Li et al., 2014f), sharpness, and curvedness (Nie et al., 2013), or even the underlying fiber connectivity information derived from DWI (Nie et al., 2012a; Zhang et al., 2010), onto 4D infant cortical surface atlases, to achieve more accurate results for mapping early brain development. We will make our 4D infant cortical surface atlases publically available for facilitating early brain development studies. With our 4D infant surface atlases and the increasing availability of large-scale longitudinal infant MRI datasets, we will comprehensively investigate the normal developmental trajectories of cortical surface area, cortical thickness, and cortical folding/gyrification, as well as their correlation patterns in both healthy infants and infants at risk for brain disorders, to increase our limited knowledge on early brain development and also to provide fundamental insights into neurodevelopmental disorders.
Highlights.
We propose a method for construction of consistent and unbiased 4D surface atlases;
We construct the first 4D infant cortical surface atlases with 7 time points;
We study correlation patterns of early cortex development between different regions.
Acknowledgements
This work was supported in part by National Institutes of Health grants AG041721, AG042599, MH100217, EB006733, EB008374, EB009634, EB008760, MH088520, MH070890, MH064065, NS055754, and HD053000.
Footnotes
Publisher's Disclaimer: This is a PDF file of an unedited manuscript that has been accepted for publication. As a service to our customers we are providing this early version of the manuscript. The manuscript will undergo copyediting, typesetting, and review of the resulting proof before it is published in its final citable form. Please note that during the production process errors may be discovered which could affect the content, and all legal disclaimers that apply to the journal pertain.
References
- Altaye M, Holland SK, Wilke M, Gaser C. Infant brain probability templates for MRI segmentation and normalization. Neuroimage. 2008;43:721–730. doi: 10.1016/j.neuroimage.2008.07.060. [DOI] [PMC free article] [PubMed] [Google Scholar]
- Benjamini Y, Hochberg Y. Controlling the false discovery rate: a practical and powerful approach to multiple testing. Journal of the Royal Statistical Society. Series B (Methodological) 1995:289–300. [Google Scholar]
- Chen CH, Fiecas M, Gutierrez ED, Panizzon MS, Eyler LT, Vuoksimaa E, Thompson WK, Fennema-Notestine C, Hagler DJ, jr., Jernigan TL, Neale MC, Franz CE, Lyons MJ, Fischl B, Tsuang MT, Dale AM, Kremen WS. Genetic topography of brain morphology. Proc Natl Acad Sci U S A. 2013;110:17089–17094. doi: 10.1073/pnas.1308091110. [DOI] [PMC free article] [PubMed] [Google Scholar]
- Davis BC, Fletcher PT, Bullitt E, Joshi S. Population Shape Regression from Random Design Data. Int J Comput Vision. 2010;90:255–266. [Google Scholar]
- Dubois J, Benders M, Cachia A, Lazeyras F, Ha-Vinh Leuchter R, Sizonenko SV, Borradori-Tolsa C, Mangin JF, Huppi PS. Mapping the early cortical folding process in the preterm newborn brain. Cereb Cortex. 2008;18:1444–1454. doi: 10.1093/cercor/bhm180. [DOI] [PubMed] [Google Scholar]
- Durrleman S, Pennec X, Trouve A, Gerig G, Ayache N. Spatiotemporal atlas estimation for developmental delay detection in longitudinal datasets. Med Image Comput Comput Assist Interv. 2009;12:297–304. doi: 10.1007/978-3-642-04268-3_37. [DOI] [PMC free article] [PubMed] [Google Scholar]
- Eickhoff SB, Stephan KE, Mohlberg H, Grefkes C, Fink GR, Amunts K, Zilles K. A new SPM toolbox for combining probabilistic cytoarchitectonic maps and functional imaging data. Neuroimage. 2005;25:1325–1335. doi: 10.1016/j.neuroimage.2004.12.034. [DOI] [PubMed] [Google Scholar]
- Evans AC, Janke AL, Collins DL, Baillet S. Brain templates and atlases. Neuroimage. 2012;62:911–922. doi: 10.1016/j.neuroimage.2012.01.024. [DOI] [PubMed] [Google Scholar]
- Fischl B. FreeSurfer. Neuroimage. 2012;62:774–781. doi: 10.1016/j.neuroimage.2012.01.021. [DOI] [PMC free article] [PubMed] [Google Scholar]
- Fischl B, Dale AM. Measuring the thickness of the human cerebral cortex from magnetic resonance images. Proc Natl Acad Sci U S A. 2000;97:11050–11055. doi: 10.1073/pnas.200033797. [DOI] [PMC free article] [PubMed] [Google Scholar]
- Fischl B, Sereno MI, Dale AM. Cortical surface-based analysis. II: Inflation, flattening, and a surface-based coordinate system. Neuroimage. 1999a;9:195–207. doi: 10.1006/nimg.1998.0396. [DOI] [PubMed] [Google Scholar]
- Fischl B, Sereno MI, Tootell RBH, Dale AM. High-resolution intersubject averaging and a coordinate system for the cortical surface. Human Brain Mapping. 1999b;8:272–284. doi: 10.1002/(SICI)1097-0193(1999)8:4<272::AID-HBM10>3.0.CO;2-4. [DOI] [PMC free article] [PubMed] [Google Scholar]
- Gao W, Zhu H, Giovanello KS, Smith JK, Shen D, Gilmore JH, Lin W. Evidence on the emergence of the brain's default network from 2-week-old to 2-year-old healthy pediatric subjects. Proc Natl Acad Sci U S A. 2009;106:6790–6795. doi: 10.1073/pnas.0811221106. [DOI] [PMC free article] [PubMed] [Google Scholar]
- Gilmore JH, Shi F, Woolson SL, Knickmeyer RC, Short SJ, Lin W, Zhu H, Hamer RM, Styner M, Shen D. Longitudinal development of cortical and subcortical gray matter from birth to 2 years. Cereb Cortex. 2012;22:2478–2485. doi: 10.1093/cercor/bhr327. [DOI] [PMC free article] [PubMed] [Google Scholar]
- Goebel R, Esposito F, Formisano E. Analysis of functional image analysis contest (FIAC) data with brainvoyager QX: From single-subject to cortically aligned group general linear model analysis and self-organizing group independent component analysis. Hum Brain Mapp. 2006;27:392–401. doi: 10.1002/hbm.20249. [DOI] [PMC free article] [PubMed] [Google Scholar]
- Greitz T, Bohm C, Holte S, Eriksson L. A Computerized Brain Atlas -Construction, Anatomical Content, and Some Applications. J Comput Assist Tomo. 1991;15:26–38. [PubMed] [Google Scholar]
- Habas PA, Kim K, Corbett-Detig JM, Rousseau F, Glenn OA, Barkovich AJ, Studholme C. A spatiotemporal atlas of MR intensity, tissue probability and shape of the fetal brain with application to segmentation. Neuroimage. 2010;53:460–470. doi: 10.1016/j.neuroimage.2010.06.054. [DOI] [PMC free article] [PubMed] [Google Scholar]
- Habas PA, Scott JA, Roosta A, Rajagopalan V, Kim K, Rousseau F, Barkovich AJ, Glenn OA, Studholme C. Early folding patterns and asymmetries of the normal human brain detected from in utero MRI. Cereb Cortex. 2012;22:13–25. doi: 10.1093/cercor/bhr053. [DOI] [PMC free article] [PubMed] [Google Scholar]
- Han X, Pham DL, Tosun D, Rettmann ME, Xu C, Prince JL. CRUISE: cortical reconstruction using implicit surface evolution. Neuroimage. 2004;23:997–1012. doi: 10.1016/j.neuroimage.2004.06.043. [DOI] [PubMed] [Google Scholar]
- Hill J, Dierker D, Neil J, Inder T, Knutsen A, Harwell J, Coalson T, Van Essen D. A surface-based analysis of hemispheric asymmetries and folding of cerebral cortex in term-born human infants. J Neurosci. 2010a;30:2268–2276. doi: 10.1523/JNEUROSCI.4682-09.2010. [DOI] [PMC free article] [PubMed] [Google Scholar]
- Hill J, Inder T, Neil J, Dierker D, Harwell J, Van Essen D. Similar patterns of cortical expansion during human development and evolution. Proc Natl Acad Sci U S A. 2010b;107:13135–13140. doi: 10.1073/pnas.1001229107. [DOI] [PMC free article] [PubMed] [Google Scholar]
- Joshi S, Davis B, Jomier M, Gerig G. Unbiased diffeomorphic atlas construction for computational anatomy. Neuroimage. 2004;23(Suppl 1):S151–S160. doi: 10.1016/j.neuroimage.2004.07.068. [DOI] [PubMed] [Google Scholar]
- Kazemi K, Moghaddam HA, Grebe R, Gondry-Jouet C, Wallois F. A neonatal atlas template for spatial normalization of whole-brain magnetic resonance images of newborns: preliminary results. Neuroimage. 2007;37:463–473. doi: 10.1016/j.neuroimage.2007.05.004. [DOI] [PubMed] [Google Scholar]
- Knickmeyer RC, Gouttard S, Kang C, Evans D, Wilber K, Smith JK, Hamer RM, Lin W, Gerig G, Gilmore JH. A structural MRI study of human brain development from birth to 2 years. J Neurosci. 2008;28:12176–12182. doi: 10.1523/JNEUROSCI.3479-08.2008. [DOI] [PMC free article] [PubMed] [Google Scholar]
- Kuklisova-Murgasova M, Aljabar P, Srinivasan L, Counsell SJ, Doria V, Serag A, Gousias IS, Boardman JP, Rutherford MA, Edwards AD, Hajnal JV, Rueckert D. A dynamic 4D probabilistic atlas of the developing brain. Neuroimage. 2011;54:2750–2763. doi: 10.1016/j.neuroimage.2010.10.019. [DOI] [PubMed] [Google Scholar]
- Li G, Guo L, Nie J, Liu T. Automatic cortical sulcal parcellation based on surface principal direction flow field tracking. Neuroimage. 2009;46:923–937. doi: 10.1016/j.neuroimage.2009.03.039. [DOI] [PMC free article] [PubMed] [Google Scholar]
- Li G, Guo L, Nie J, Liu T. An automated pipeline for cortical sulcal fundi extraction. Med Image Anal. 2010a;14:343–359. doi: 10.1016/j.media.2010.01.005. [DOI] [PMC free article] [PubMed] [Google Scholar]
- Li G, Nie J, Wang L, Shi F, Gilmore JH, Lin W, Shen D. Measuring the dynamic longitudinal cortex development in infants by reconstruction of temporally consistent cortical surfaces. Neuroimage. 2014a;90:266–279. doi: 10.1016/j.neuroimage.2013.12.038. [DOI] [PMC free article] [PubMed] [Google Scholar]
- Li G, Nie J, Wang L, Shi F, Lin W, Gilmore JH, Shen D. Mapping region-specific longitudinal cortical surface expansion from birth to 2 years of age. Cereb Cortex. 2013;23:2724–2733. doi: 10.1093/cercor/bhs265. [DOI] [PMC free article] [PubMed] [Google Scholar]
- Li G, Nie J, Wang L, Shi F, Lyall AE, Lin W, Gilmore JH, Shen D. Mapping longitudinal hemispheric structural asymmetries of the human cerebral cortex from birth to 2 years of age. Cereb Cortex. 2014b;24:1289–1300. doi: 10.1093/cercor/bhs413. [DOI] [PMC free article] [PubMed] [Google Scholar]
- Li G, Nie J, Wu G, Wang Y, Shen D. Consistent reconstruction of cortical surfaces from longitudinal brain MR images. Neuroimage. 2012;59:3805–3820. doi: 10.1016/j.neuroimage.2011.11.012. [DOI] [PMC free article] [PubMed] [Google Scholar]
- Li G, Wang L, Shi F, Lin W, Shen D. Constructing 4D infant cortical surface atlases based on dynamic developmental trajectories of the cortex. Med Image Comput Comput Assist Interv. 2014c;17:89–96. doi: 10.1007/978-3-319-10443-0_12. [DOI] [PMC free article] [PubMed] [Google Scholar]
- Li G, Wang L, Shi F, Lin W, Shen D. Simultaneous and consistent labeling of longitudinal dynamic developing cortical surfaces in infants. Med Image Anal. 2014d;18:1274–1289. doi: 10.1016/j.media.2014.06.007. [DOI] [PMC free article] [PubMed] [Google Scholar]
- Li G, Wang L, Shi F, Lyall AE, Ahn M, Peng Z, Zhu H, Lin W, Gilmore JH, Shen D. Cortical thickness and surface area in neonates at high risk for schizophrenia. Brain Structure and Function. 2014e:1–15. doi: 10.1007/s00429-014-0917-3. [DOI] [PMC free article] [PubMed] [Google Scholar]
- Li G, Wang L, Shi F, Lyall AE, Lin W, Gilmore JH, Shen D. Mapping longitudinal development of local cortical gyrification in infants from birth to 2 years of age. J Neurosci. 2014f;34:4228–4238. doi: 10.1523/JNEUROSCI.3976-13.2014. [DOI] [PMC free article] [PubMed] [Google Scholar]
- Li K, Guo L, Li G, Nie J, Faraco C, Cui G, Zhao Q, Miller LS, Liu T. Gyral folding pattern analysis via surface profiling. Neuroimage. 2010b;52:1202–1214. doi: 10.1016/j.neuroimage.2010.04.263. [DOI] [PMC free article] [PubMed] [Google Scholar]
- Liao S, Jia H, Wu G, Shen D. A novel framework for longitudinal atlas construction with groupwise registration of subject image sequences. Neuroimage. 2012;59:1275–1289. doi: 10.1016/j.neuroimage.2011.07.095. [DOI] [PMC free article] [PubMed] [Google Scholar]
- Lyall AE, Shi F, Geng X, Woolson S, Li G, Wang L, Hamer RM, Shen D, Gilmore JH. Dynamic Development of Regional Cortical Thickness and Surface Area in Early Childhood. Cereb Cortex. 2014 doi: 10.1093/cercor/bhu027. [DOI] [PMC free article] [PubMed] [Google Scholar]
- Lyttelton O, Boucher M, Robbins S, Evans A. An unbiased iterative group registration template for cortical surface analysis. Neuroimage. 2007;34:1535–1544. doi: 10.1016/j.neuroimage.2006.10.041. [DOI] [PubMed] [Google Scholar]
- MacDonald D, Kabani N, Avis D, Evans AC. Automated 3-D extraction of inner and outer surfaces of cerebral cortex from MRI. Neuroimage. 2000;12:340–356. doi: 10.1006/nimg.1999.0534. [DOI] [PubMed] [Google Scholar]
- Mangin JF, Riviere D, Cachia A, Duchesnay E, Cointepas Y, Papadopoulos-Orfanos D, Scifo P, Ochiai T, Brunelle F, Regis J. A framework to study the cortical folding patterns. Neuroimage. 2004;23(Suppl 1):S129–S138. doi: 10.1016/j.neuroimage.2004.07.019. [DOI] [PubMed] [Google Scholar]
- Mazziotta J, Toga A, Evans A, Fox P, Lancaster J, Zilles K, Woods R, Paus T, Simpson G, Pike B, Holmes C, Collins L, Thompson P, MacDonald D, Iacoboni M, Schormann T, Amunts K, Palomero-Gallagher N, Geyer S, Parsons L, Narr K, Kabani N, Le Goualher G, Boomsma D, Cannon T, Kawashima R, Mazoyer B. A probabilistic atlas and reference system for the human brain: International Consortium for Brain Mapping (ICBM) Philos Trans R Soc Lond B Biol Sci. 2001a;356:1293–1322. doi: 10.1098/rstb.2001.0915. [DOI] [PMC free article] [PubMed] [Google Scholar]
- Mazziotta J, Toga A, Evans A, Fox P, Lancaster J, Zilles K, Woods R, Paus T, Simpson G, Pike B, Holmes C, Collins L, Thompson P, MacDonald D, Iacoboni M, Schormann T, Amunts K, Palomero-Gallagher N, Geyer S, Parsons L, Narr K, Kabani N, Le Goualher G, Feidler J, Smith K, Boomsma D, Hulshoff Pol H, Cannon T, Kawashima R, Mazoyer B. A four-dimensional probabilistic atlas of the human brain. J Am Med Inform Assoc. 2001b;8:401–430. doi: 10.1136/jamia.2001.0080401. [DOI] [PMC free article] [PubMed] [Google Scholar]
- Mazziotta JC, Toga AW, Evans A, Fox P, Lancaster J. A probabilistic atlas of the human brain: theory and rationale for its development. The International Consortium for Brain Mapping (ICBM) Neuroimage. 1995;2:89–101. doi: 10.1006/nimg.1995.1012. [DOI] [PubMed] [Google Scholar]
- Meng Y, Li G, Lin W, Gilmore JH, Shen D. Spatial distribution and longitudinal development of deep cortical sulcal landmarks in infants. Neuroimage. 2014;100C:206–218. doi: 10.1016/j.neuroimage.2014.06.004. [DOI] [PMC free article] [PubMed] [Google Scholar]
- Nie J, Guo L, Li K, Wang Y, Chen G, Li L, Chen H, Deng F, Jiang X, Zhang T, Huang L, Faraco C, Zhang D, Guo C, Yap PT, Hu X, Li G, Lv J, Yuan Y, Zhu D, Han J, Sabatinelli D, Zhao Q, Miller LS, Xu B, Shen P, Platt S, Shen D, Liu T. Axonal fiber terminations concentrate on gyri. Cereb Cortex. 2012a;22:2831–2839. doi: 10.1093/cercor/bhr361. [DOI] [PMC free article] [PubMed] [Google Scholar]
- Nie J, Li G, Shen D. Development of cortical anatomical properties from early childhood to early adulthood. Neuroimage. 2013;76:216–224. doi: 10.1016/j.neuroimage.2013.03.021. [DOI] [PMC free article] [PubMed] [Google Scholar]
- Nie J, Li G, Wang L, Gilmore JH, Lin W, Shen D. A computational growth model for measuring dynamic cortical development in the first year of life. Cereb Cortex. 2012b;22:2272–2284. doi: 10.1093/cercor/bhr293. [DOI] [PMC free article] [PubMed] [Google Scholar]
- Nie J, Li G, Wang L, Shi F, Lin W, Gilmore JH, Shen D. Longitudinal development of cortical thickness, folding, and fiber density networks in the first 2 years of life. Hum Brain Mapp. 2014;35:3726–3737. doi: 10.1002/hbm.22432. [DOI] [PMC free article] [PubMed] [Google Scholar]
- Nie J, Liu T, Li G, Young G, Tarokh A, Guo L, Wong ST. Least-square conformal brain mapping with spring energy. Comput Med Imaging Graph. 2007;31:656–664. doi: 10.1016/j.compmedimag.2007.08.009. [DOI] [PMC free article] [PubMed] [Google Scholar]
- Oishi K, Mori S, Donohue PK, Ernst T, Anderson L, Buchthal S, Faria A, Jiang H, Li X, Miller MI, van Zijl PC, Chang L. Multi-contrast human neonatal brain atlas: application to normal neonate development analysis. Neuroimage. 2011;56:8–20. doi: 10.1016/j.neuroimage.2011.01.051. [DOI] [PMC free article] [PubMed] [Google Scholar]
- Panizzon MS, Fennema-Notestine C, Eyler LT, Jernigan TL, Prom-Wormley E, Neale M, Jacobson K, Lyons MJ, Grant MD, Franz CE, Xian H, Tsuang M, Fischl B, Seidman L, Dale A, Kremen WS. Distinct genetic influences on cortical surface area and cortical thickness. Cereb Cortex. 2009;19:2728–2735. doi: 10.1093/cercor/bhp026. [DOI] [PMC free article] [PubMed] [Google Scholar]
- Rodriguez-Carranza CE, Mukherjee P, Vigneron D, Barkovich J, Studholme C. A framework for in vivo quantification of regional brain folding in premature neonates. Neuroimage. 2008;41:462–478. doi: 10.1016/j.neuroimage.2008.01.008. [DOI] [PMC free article] [PubMed] [Google Scholar]
- Serag A, Aljabar P, Ball G, Counsel SJ, Boardman JP, Rutherford MA, Edwards AD, Hajnal JV, Rueckert D. Construction of a consistent high-definition spatio-temporal atlas of the developing brain using adaptive kernel regression. Neuroimage. 2012;59:2255–2265. doi: 10.1016/j.neuroimage.2011.09.062. [DOI] [PubMed] [Google Scholar]
- Shattuck DW, Leahy RM. BrainSuite: an automated cortical surface identification tool. Med Image Anal. 2002;6:129–142. doi: 10.1016/s1361-8415(02)00054-3. [DOI] [PubMed] [Google Scholar]
- Shattuck DW, Mirza M, Adisetiyo V, Hojatkashani C, Salamon G, Narr KL, Poldrack RA, Bilder RM, Toga AW. Construction of a 3D probabilistic atlas of human cortical structures. Neuroimage. 2008;39:1064–1080. doi: 10.1016/j.neuroimage.2007.09.031. [DOI] [PMC free article] [PubMed] [Google Scholar]
- Shen D, Davatzikos C. HAMMER: hierarchical attribute matching mechanism for elastic registration. IEEE Trans Med Imaging. 2002;21:1421–1439. doi: 10.1109/TMI.2002.803111. [DOI] [PubMed] [Google Scholar]
- Shi F, Wang L, Dai Y, Gilmore JH, Lin W, Shen D. LABEL: Pediatric brain extraction using learning-based meta-algorithm. Neuroimage. 2012;62:1975–1986. doi: 10.1016/j.neuroimage.2012.05.042. [DOI] [PMC free article] [PubMed] [Google Scholar]
- Shi F, Wang L, Wu GR, Li G, Gilmore JH, Lin WL, Shen D. Neonatal Atlas Construction Using Sparse Representation. Human Brain Mapping. 2014;35:4663–4677. doi: 10.1002/hbm.22502. [DOI] [PMC free article] [PubMed] [Google Scholar]
- Shi F, Yap PT, Wu G, Jia H, Gilmore JH, Lin W, Shen D. Infant brain atlases from neonates to 1- and 2-year-olds. PLoS One. 2011;6:e18746. doi: 10.1371/journal.pone.0018746. [DOI] [PMC free article] [PubMed] [Google Scholar]
- Shi Y, Lai R, Toga AW. Cortical surface reconstruction via unified Reeb analysis of geometric and topological outliers in magnetic resonance images. IEEE Trans Med Imaging. 2013;32:511–530. doi: 10.1109/TMI.2012.2224879. [DOI] [PMC free article] [PubMed] [Google Scholar]
- Shiee N, Bazin PL, Cuzzocreo JL, Ye C, Kishore B, Carass A, Calabresi PA, Reich DS, Prince JL, Pham DL. Reconstruction of the human cerebral cortex robust to white matter lesions: method and validation. Hum Brain Mapp. 2014;35:3385–3401. doi: 10.1002/hbm.22409. [DOI] [PMC free article] [PubMed] [Google Scholar]
- Sled JG, Zijdenbos AP, Evans AC. A nonparametric method for automatic correction of intensity nonuniformity in MRI data. IEEE Trans Med Imaging. 1998;17:87–97. doi: 10.1109/42.668698. [DOI] [PubMed] [Google Scholar]
- Smith SM, Jenkinson M, Woolrich MW, Beckmann CF, Behrens TE, Johansen-Berg H, Bannister PR, De Luca M, Drobnjak I, Flitney DE, Niazy RK, Saunders J, Vickers J, Zhang Y, De Stefano N, Brady JM, Matthews PM. Advances in functional and structural MR image analysis and implementation as FSL. Neuroimage. 2004;23(Suppl 1):S208–S219. doi: 10.1016/j.neuroimage.2004.07.051. [DOI] [PubMed] [Google Scholar]
- Thompson PM, Schwartz C, Toga AW. High-resolution random mesh algorithms for creating a probabilistic 3D surface atlas of the human brain. Neuroimage. 1996;3:19–34. doi: 10.1006/nimg.1996.0003. [DOI] [PubMed] [Google Scholar]
- Tzourio-Mazoyer N, Landeau B, Papathanassiou D, Crivello F, Etard O, Delcroix N, Mazoyer B, Joliot M. Automated anatomical labeling of activations in SPM using a macroscopic anatomical parcellation of the MNI MRI single-subject brain. Neuroimage. 2002;15:273–289. doi: 10.1006/nimg.2001.0978. [DOI] [PubMed] [Google Scholar]
- Van Essen DC. A Population-Average, Landmark- and Surface-based (PALS) atlas of human cerebral cortex. Neuroimage. 2005;28:635–662. doi: 10.1016/j.neuroimage.2005.06.058. [DOI] [PubMed] [Google Scholar]
- Van Essen DC, Dierker DL. Surface-based and probabilistic atlases of primate cerebral cortex. Neuron. 2007;56:209–225. doi: 10.1016/j.neuron.2007.10.015. [DOI] [PubMed] [Google Scholar]
- Wang L, Shi F, Gao Y, Li G, Gilmore JH, Lin W, Shen D. Integration of sparse multi-modality representation and anatomical constraint for isointense infant brain MR image segmentation. Neuroimage. 2014a;89:152–164. doi: 10.1016/j.neuroimage.2013.11.040. [DOI] [PMC free article] [PubMed] [Google Scholar]
- Wang L, Shi F, Li G, Gao Y, Lin W, Gilmore JH, Shen D. Segmentation of neonatal brain MR images using patch-driven level sets. Neuroimage. 2014b;84:141–158. doi: 10.1016/j.neuroimage.2013.08.008. [DOI] [PMC free article] [PubMed] [Google Scholar]
- Wang L, Shi F, Lin W, Gilmore JH, Shen D. Automatic segmentation of neonatal images using convex optimization and coupled level sets. Neuroimage. 2011;58:805–817. doi: 10.1016/j.neuroimage.2011.06.064. [DOI] [PMC free article] [PubMed] [Google Scholar]
- Wang L, Shi F, Yap PT, Gilmore JH, Lin W, Shen D. 4D multi-modality tissue segmentation of serial infant images. PLoS One. 2012;7:e44596. doi: 10.1371/journal.pone.0044596. [DOI] [PMC free article] [PubMed] [Google Scholar]
- Xu C, Pham DL, Rettmann ME, Yu DN, Prince JL. Reconstruction of the human cerebral cortex from magnetic resonance images. IEEE Trans Med Imaging. 1999;18:467–480. doi: 10.1109/42.781013. [DOI] [PubMed] [Google Scholar]
- Xue H, Srinivasan L, Jiang S, Rutherford M, Edwards AD, Rueckert D, Hajnal JV. Automatic segmentation and reconstruction of the cortex from neonatal MRI. Neuroimage. 2007;38:461–477. doi: 10.1016/j.neuroimage.2007.07.030. [DOI] [PubMed] [Google Scholar]
- Yap PT, Fan Y, Chen Y, Gilmore JH, Lin W, Shen D. Development trends of white matter connectivity in the first years of life. PLoS One. 2011;6:e24678. doi: 10.1371/journal.pone.0024678. [DOI] [PMC free article] [PubMed] [Google Scholar]
- Yeo BT, Sabuncu MR, Desikan R, Fischl B, Golland P. Effects of registration regularization and atlas sharpness on segmentation accuracy. Med Image Anal. 2008;12:603–615. doi: 10.1016/j.media.2008.06.005. [DOI] [PMC free article] [PubMed] [Google Scholar]
- Yeo BT, Sabuncu MR, Vercauteren T, Ayache N, Fischl B, Golland P. Spherical demons: fast diffeomorphic landmark-free surface registration. IEEE Trans Med Imaging. 2010;29:650–668. doi: 10.1109/TMI.2009.2030797. [DOI] [PMC free article] [PubMed] [Google Scholar]
- Zhang D, Guo L, Li G, Nie J, Deng F, Li K, Hu X, Zhang T, Jiang X, Zhu D. Automatic cortical surface parcellation based on fiber density information; Proceedings of the 2010 IEEE international conference on Biomedical imaging: from nano to Macro. IEEE Press; 2010. pp. 1133–1136. [Google Scholar]
- Zhang T, Guo L, Li G, Nie J, Liu T. Parametric representation of cortical surface folding based on polynomials. Med Image Comput Comput Assist Interv. 2009;12:184–191. doi: 10.1007/978-3-642-04271-3_23. [DOI] [PMC free article] [PubMed] [Google Scholar]
- Zilles K, Palomero-Gallagher N, Amunts K. Development of cortical folding during evolution and ontogeny. Trends Neurosci. 2013;36:275–284. doi: 10.1016/j.tins.2013.01.006. [DOI] [PubMed] [Google Scholar]


