

Abstract
Background/Aims
Distribution of infusate into the brain by convection-enhanced delivery can be affected by backflow along the catheter shaft. This work assesses whether 1) tissue coring and occlusion of the catheter lumen occurs when an open endport catheter is inserted; 2) there is a relationship between intra-catheter pressure and backflow; 3) catheter occlusion increases backflow
Methods
Freshly excised monkey brains were used to assess tissue coring and its correlation with behavior of the line pressure. In vivo infusions of gadolinium solution into monkey putamen at 1 μl/min were conducted with and without a stylet during insertion. The effect of flow during insertion was evaluated in vivo in the pig thalamus. MRI and line pressure were continuously monitored during in vivo infusions.
Results
Ex vivo testing showed that open endport insertions always cored tissue, which temporarily plug the catheter tip, increased pressure followed by rapid fall after its expulsion. Catheter insertion with a stylet in place prevented coring but not flow insertion. Neither affected backflow.
Conclusion
Open endport catheters occlude during insertion, which can be prevented by temporarily closing the port with stylet but not by infusing while inserting. Backflow was not completely prevented by any insertion method.
Keywords: Convection-enhanced delivery, backflow, intraparenchymal infusion, magnetic resonance imaging, Parkinson’s disease
INTRODUCTION
For close to two decades now, targeted delivery of therapeutics directly into the brain – often employing convection-enhanced delivery (CED) [1] – has been used in clinical trials for the treatment of brain cancer [2, 3] as well as neurodegenerative diseases [4, 5, 6]. Backflow, the preferential reflux of infusate along the catheter shaft, is one of several factors that affect the efficient delivery of therapeutics to a desired target within the brain [7, 8]. Backflow is observed both during direct injection of a bolus (such as reported in [9] or [10]) and with CED, where the infusion is at a relatively low flow rate (less than one mL per hour) and is continued for a longer time (tens of minutes to hours) (e.g., [11, 12]). Targeted delivery into the putamen is particularly sensitive to backflow loss. The putamen is a narrow structure and is surrounded by white matter tracts that have high fluid conductivity. If these tracts are reached by backflow, the infusate tends to flow into them, leaving a reduced fraction of infusate in the putamen [13]. Thus backflow is of considerable concern in intraputamenal infusions.
The dominant theory in the infusion field is that tissue cored during catheter insertion acts as a plug at the start of infusion, which results in build-up of intra-line pressure, until the tissue is expelled [1]. This is then followed by the sudden flow of infusate accompanied by drop in the pressure and then increased backflow. However, one study failed to find tissue in the needle upon insertion [14], and other reasons have been suggested for a drop in pressure, such as a bubble in the line which is expelled [15]. An open endport catheter is most likely to core tissue during insertion, therefore strategies aiming to overcome its possibility have been proposed. The endport can be closed during insertion inserting a tight-fitting stylet or by using a closed end configuration [16]. Flow insertion, in which the catheter is inserted while infusing is proposed to resist the tissue core [17, 18, 19]. Interestingly, these reports do not demonstrate tissue coring during insertion. Furthermore, publications documenting changes in infusion line pressure using different methods of insertion are not currently available.
In this study, we used ex vivo and in vivo methods to evaluate whether different insertion methods (open endport, closed endport, and flow insertion) affected tissue coring and catheter occlusion. We evaluated changes in line pressure as a surrogate marker to assess catheter occlusion and clearance and its relationship with incidence and magnitude of backflow.
MATERIALS AND METHODS
Infusion System
A valve tip (VT) catheter with retractable stylet was used in this study. The VT catheter (Engineering Resources Group, Inc. Pembroke Pines, FL) is a modified open endport stepped catheter with a fused silica shaft of 0.65mm outer diameter (OD) and a polyimide tip with an OD of 0.36 mm and an ID of 0.25 mm extending 3 mm from the shaft. The catheter includes a silica stylet that can be extended approximately 1 mm beyond the end to close the end port during insertion, and then retracted 8–10 mm prior to infusion. The catheter was also used to test open endport and flow insertion by leaving the stylet retracted throughout the procedure. We note that the catheter itself is rigid and in vivo imaging showed similar accuracy with or without the stylet, with no discernible minimal deformation. The only purpose of the stylet in these studies is to obstruct the lumen of the catheter, preventing coring. This was confirmed indirectly in vivo by the absence of the characteristic behavior of the pressure when coring occurs.
Thick-walled Teflon lines 500μm ID were used to connect the catheter to 5cc Hamilton gas-tight syringes. The syringes were driven by an MRI-compatible syringe pump (PHD 2000, Harvard Apparatus, Inc.) placed at approximately the same height as the catheter tip when inserted.
Pressure Measurement
Monitoring of the pressure of the infusion lines was performed using a pressure monitor and pump controller (Engineering Resources Group, Inc. Pembroke Pines, FL). This PC-based system was used remotely from the magnetic resonance imaging (MRI) control room. Infusion line pressure was acquired at 1 sec intervals. Peak pressure was recorded as the single highest 1 sec measurement obtained near the start of the infusion. The term pressure drop was defined as the difference between the peak pressure and the mean of the pressure measured from 10 – 30 sec after the peak.
MRI
Imaging was performed in a 3-Tesla GE MR 750 Discovery MRI scanner (GE Healthcare, Waukesha, WI) as previously described16. A custom 3-inch diameter, receive-only surface coil (MR Instruments, Inc., Minneapolis, MN) was used for scanning.
Backflow Measurement
Backflow distances of infusate, doped with common T1-shortening agents, were measured using the first T1-weighted scan, acquired 3–10 min after the start of the infusion. The distance was measured from the catheter tip to the furthest extent of visible tracer along the catheter shaft using custom 3D image processing software. Distances were recorded with 0.5 mm precision, which was limited by the resolution of the MR imaging.
Statistical Analysis
Backflow distances were compared using a two-sample t-test, assuming equal variances, while pressure peak and drop t-test comparisons used unequal variances. Two-tailed tests were used, with statistical significance defined as p < 0.05. Grouped data are presented in the test as mean (M) ± standard deviation (SD).
Experimental design
Three different experimental set ups were used in this project: 1- Ex vivo brain tests to correlate tissue coring with in-line pressure behavior; 2-In vivo brain tests to assess ‘closed’ and open endport catheters effects in line pressure and backflow; 3- In vivo brain tests with and without flow-insertion in open endport catheters to evaluate its effect in line pressure and backflow.
Subjects
All efforts were made to ameliorate suffering of animals. This study was performed in strict accordance with the recommendations in the Guide for the Care and Use of Laboratory Animals of the National Institutes of Health. The protocol were approved by the Institutional and Animal Care Committee of the University of Wisconsin, Madison (permit No. G00554 and M02516-0-03-12).
For the first set of experiments three brains, from one rhesus (Macaca mulatta) and two cynomolgous (Macaca fascicularis) monkeys were obtained from the tissue distribution program at the Wisconsin National Primate Research Center. Immediately after euthanasia with sodium pentobarbital (25 mg/kg IV) the brains were quickly removed, placed in a phosphate buffered saline solution for transportation and used within 4 hours post mortem.
For the second set of experiments, four adult female rhesus monkeys (Macaca mulatta; 5–8 years old, 4–5 kg) were used. Animals were housed individually on a 12 hour light/dark cycle and received food and water ad libitum. The animals’ diet was supplemented with fruit during daily enrichment.
For the third set of experiments, three adolescent female pigs (Sus scrofa domesticus; 2–3 months of age, 30–35 kg) were used in this study. Animals were housed individually on a 12 hour light/dark cycle and received food and water ad libitum.
1- Ex vivo brain push-through tests
During testing the brains were placed in a “doughnut” shaped platform above a tank containing water. A solution of bromophenol blue (0.16 mg/ml; Sigma Aldrich, St. Louis, Mo., USA) in phosphate-buffered saline was infused at 1 μl/min. Line pressure was monitored continuously and video recordings were made and synchronized with the pressure readings.
VT catheter was used, in open- or closed- endport modes, for push-through insertions and regular brain insertions targeting the putamen nucleus, with or without simultaneous infusion (flow insertion). Push-through insertions were defined as catheter insertion in the brain that followed through the tissue until the catheter emerged in the water tank. Infusion was continued until any cored tissue was expelled from the catheter tip and dye was observed in the water.
2- In vivo open and closed endport tests
Catheters were targeted using a MRI compatible external trajectory guide (Navigus, Medtronic Inc., Minneapolis, Minn., USA) and intraoperative MRI guidance. The surgical and targeting procedure was performed under isoflurane anesthesia following our previously published protocol [20]. The catheters were targeted to the ventral postcommissural right and left putamen, approximately 1–2 mm posterior to the coronal plane presenting the anterior commissure, and centered laterally at least 5 mm deep within the nucleus.
In one hemisphere the VT catheter was inserted with the stylet retracted (open end mode), exposing the open endport to tissue during insertion. In the other hemisphere a VT catheter was inserted with its stylet extending 1 mm past the distal end, covering the end port. After insertion, the stylet was retracted 8–10 mm in order to open the end port for infusion. A solution of gadoteridol (2 mmol/l; ProHance, Bracco Diagnostics Inc., Princeton, N.J., USA) and bromophenol blue (0.16 mg/ml; Sigma Aldrich, St. Louis, Mo., USA) in phosphate-buffered saline was infused at a flow rate of 1.0 μl/min. A volume of 100 μl was infused in each infusion.
Imaging with a pair of 3D spoiled gradient echo (SPGR) scans with flip angles of 6° and 34° allowed quantitative measurement of the infusate distribution (TR =21 ms, TE = 6 ms, in-plane FOV = 140 x 105 mm (0.75 phase FOV), matrix = 256x224, 64 contiguous coronal slices each 0.8 mm thick.) Scans were acquired at intervals of approximately 10 min per pair.
3- In vivo flow insertion tests
Catheters were targeted using an MRI compatible external trajectory guide (Navigus, Medtronic Inc., Minneapolis, Minn., USA) and a novel, real time intraoperative guidance system [21, 22], following a modified published protocol [20]. The animals were fasted for 12 hours prior to the surgery. Anesthesia was induced using intramuscular injections of telazol (7 mg/kg), xylazine (2.2 mg/kg), and atropine (0.05 mg/kg), then maintained with inhaled isoflurane. The planned trajectories were targeted either laterally centered at the rostral end or caudal/rostrally centered at the lateral side of the thalamus and at least 5 mm deep into the nucleus. A pre-operative T1-weighted MRI was used as a roadmap to identify trajectories that were then confirmed using real-time MRI guidance. The animal was then moved from the MRI scanner room to an adjacent operating room where two bilateral craniotomies (5 mm diameter) 20 mm right and left from midline point were performed using a burr drill. A Navigus™ base and MR-visible trajectory guide were centered over each craniotomy. Target and device pivot locations were again identified using a T1-weighted MRI roadmap. The MR-visible trajectory guide was adjusted to the correct location using real-time MRI guidance. The trajectory guide was then removed and replaced with a remote introducer, which was then used to insert the infusion catheter to the prescribed depth, as previously described [20].
VT catheters in the open endport mode (stylet retracted) were used. A solution of gadodiamide (2 mmol/l; Omniscan, GE Healthcare) and bromophenol blue (0.16 mg/ml; Sigma Aldrich, St. Louis, Mo., USA) in phosphate-buffered saline was infused at a flow rate of 5.0 μl/min. In the flow-insertion trials, the pump was started at 5.0 μl/min just prior to insertion. The catheter was then advanced to the selected location in the thalamus at a rate of 5–7 mm/min. After reaching the target depth, infusion continued at the same rate of 5.0 μl/min for 10–15 minutes. The control infusions were performed similarly, except that the pump was off during insertion, and started at 5.0 μl/min just after insertion.
During infusion, the backflow was monitored with real-time 2D imaging. A single slice aligned with the catheter was acquired at 13 second intervals (TR = 33 ms, TE = 4.5 ms, flip angle = 50 °, FOV = 140 x 105 mm, matrix = 256x192, slice thickness = 2.5 mm). After each infusion, the complete infusion distribution was imaged with a 3D fast spoiled gradient echo (FSPGR) scan (TR = 9.1 ms, TE = 3.9 ms, in-plane FOV = 180 mm, matrix = 256x224, slice thickness = 0.8 mm, 248 contiguous slices spaced at 0.4 mm intervals.)
RESULTS
Open endport catheters get occluded during brain insertion
The ex vivo brain tests evaluated whether there is a relationship between catheter occlusion and clearance, and the changes in infusion line pressure. A total of seven push-through infusions were performed with open endport insertion. The results of a typical study are shown in Fig 1. Fig. 1C shows the pressure trace over the first 30 seconds of infusion. The differential pressure was zeroed before the start of infusion, and rose roughly linearly over the first 21 seconds to a peak of 10.6 mmHg. It then dropped sharply to a value of −3.4 mmHg for the remainder of the infusion. Fig. 1A shows an image of the catheter tip in the water bath taken from the video, a few seconds before the pressure peak. Some of the cored tissue protrudes from the tip, but no infusate is observed. In Fig. 1B, a few seconds after the pressure peak, the core has been expelled and infusate flows from the tip. This pattern (pressure rise, tissue core expulsion coinciding with steep pressure drop, followed by infusate) was observed in all seven open endport trials (Fig. 2). The mean peak pressures were 18 ± 6 mmHg.
Figure 1.
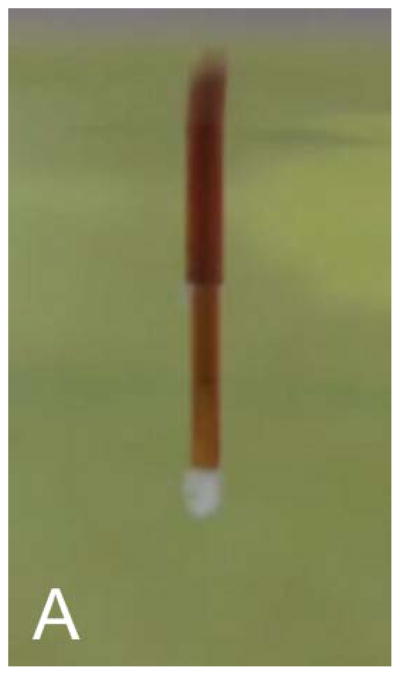


Tissue coring and expulsion during infusion in an open endport catheter pushed through ex-vivo brain into water below. Fig. 1A shows the catheter tip, with protruding tissue core, a few seconds before the pressure peak. At 21 sec, the pressure falls sharply, the tissue core is expelled, and infusate begins to flow visibly (1B). Figure 1C shows the infusion pressure during the first 30 sec. Pressure rises steadily for the first 21 sec, and no infusate (dye) is visible.
Figure 2.

Pressure plots for infusions into ex-vivo monkey brain at 1 μl/min. Solid lines represent stylet-covered insertions, dashed lines represent open endport insertions with the pump off, and dotted lines represent open endport flow insertions.
Two push-through infusions were performed with flow insertion of the open endport VT configuration. In both cases, the pressure rose during the 20–40 second of insertion (to 19 mmHg in the first case and 25 mmHg in the second). When the catheter tip exited the tissue and entered the water bath below a tissue core was expelled, the pressure fell rapidly to about 3 mmHg below the pre-insertion pressure, and infusate began to flow from the tip. Four push-through infusions were performed with closed endport insertions using the VT catheter’s stylet. The four insertions did not produce an observable tissue core expulsion. The maximum pressure rise was 1.4 mmHg, lacking the linear rise and sharp fall profile.
Additionally, insertions that stopped within brain tissue were performed followed by infusion at 1 μl/min into the tissue in order to observe the pressure behavior when the tip is surrounded by tissue rather than suspended in water. Two infusions were performed with each of the three insertion methods. Plots of the pressure for all six infusions are shown in Fig. 2. Open endport insertions with or without flow insertion had high pressure peaks and subsequent drops. The time to reach peak pressure was much greater than in the water bath, ranging from 2.5 – 5 min without flow insertion and from 7.5 – 13 min with flow insertion. The two stylet-covered insertions showed much lower pressure peaks with a small drop (7 mmHg) in one case, and no spike in the second.
Backflow does not differ under occluded versus non-occluded conditions
The in vivo open and closed endport tests in the NHP model evaluated whether pressure changes induced by tissue coring-induced affected backflow observed by intraoperative MRI. The bilateral infusions into monkey putamen were performed on four subjects at a flow rate of 1 μl/min. In Fig. 3, pressure traces for the first 15 minutes are shown for all eight infusions. Dashed lines indicate the four open endport insertions, and solid lines indicate the stylet-in-place insertions in the opposite hemispheres. The sharp pressure rise and large, rapid fall were observed only for the open endport insertions. The pressure peaks occurred within 1 – 3 min of the start of infusion in all but one case, where the pressure rise did not maintain the steep linear rise, and peaked at 10.3 min. Closed endport infusions had a significantly lower peak pressure of 28 ± 8 mmHg than the open endport insertions at 73 ± 26 mmHg; t(4)= −3.48, p= 0.03. The pressure drop was also significantly lower for the closed endport insertion at 3 ± 4 compared to the open at 49 ± 26 mmHg; t(3)= −3.48, p=0.04.
Figure 3.

Comparison of the pressures of 1μl/min infusions into monkey putamen with and without using a stylet closing the endport during insertion. Solid lines represent closed insertions, and dashed lines open endport insertions.
MR imaging of the catheter tips at the start of each infusion are shown in Fig. 4. No deformation of the catheter is observed. Although the closed endport insertions clearly lacked the large pressure spike that accompanied open end-port insertions, there was no discernible reduction in backflow distance in these four pairs of infusions. The measured backflow with stylet-covered insertions was 4.4 ± 2.4 mm compared to 3.9 ± 1.9 mm for the open endport control, an insignificant difference; t(6) = 0.35, p = 0.74. In Fig. 4, gadolinium is visible along the catheter track of the four open endport controls beyond the length of the backflow. This leakage occurs during catheter insertion without the stylet, and can be observed prior to the start of infusion, which helps to distinguish it from backflow.
Figure 4.

Visual comparison of backflow in-vivo in four open endport insertions (top row) and four closed endport insertions in the contralateral hemispheres (bottom row) in the monkey putamen. The extent of backflow in each case is indicated by an arrow.
In vivo flow insertion neither prevents occlusion nor decreases backflow
In vivo flow insertion tests in the swine model used changes in pressure spikes as an indirect measure of occlusions and intraoperative MRI to monitor backflow. Six infusions of each type, namely with and without flow insertion, were performed into the pig thalamus at a flow rate of 5 μl/min. Fig. 5 shows graphs of line pressures from a typical pair of infusions with and without flow insertion. Insets show T1-weighted real-time MRI images captured after 8 minutes of infusion. The pressure behavior appears similar in the two infusions, exhibiting an initial linear pressure rise and steep fall, and then leveling to a relatively fixed pressure. This pressure spike behavior was observed in all 12 infusions. The peak pressure for no-flow insertion ranged from 90 – 222 mmHg, averaging 155 ± 50 mmHg; flow insertion peak pressures averaged 149 ± 35 mmHg and ranged from 84 – 189 mmHg. The size of the post-peak pressure drop was 77 ± 22 mmHg without and 90 ± 35 mmHg with flow insertion. Neither the peak nor the drop differed significantly between the two methods. Reduction in backflow with flow insertion was not observed. An analysis of the backflow in all six pairs of infusions shows without flow insertion an average backflow of 4.6 ± 1.8 mm, and with flow insertion 6.1 ± 3.4 mm. In each method, four out of six infusions had low backflow (3 – 5 mm), and two out of six with backflow greater than 5 mm.
Figure 5.

Comparison of line pressure for in-vivo infusions into pig thalamus at 5 μl/min. (A) Standard insertion with the pump off, followed by 5 μl/min infusion. (B) Flow insertion and subsequent infusion at 5 μl/min. Insets show the T1-weighted real-time MRI captured 8 minutes after the start of the infusions.
DISCUSSION
In this study, as stated in the Introduction, we used ex vivo and in vivo methods to evaluate whether different insertion methods (open endport, closed endport, and flow insertion) affected tissue coring and catheter occlusion. The rate of 5ul/min was chosen to maximize the chance of preventing coring and in this context, the higher flow rate is appropriate. The backflow could be minimized by a lower flow rate, although coring would not have been prevented. Our paper explores the connection stated in other papers that reducing or preventing coring reduces backflow. The issue of how to reduce backflow by other means, and its effects on infusate distribution, are beyond the scope of this investigation, and are described for example in a previous publication13.
Our ex vivo and in vivo studies demonstrated that: 1) open endport catheters do core brain tissue during insertion in accordance with conventional belief; 2) the pressure inside the infusion lines increases with occlusion and decreases when the tissue plug is released in the ex vivo tests: subsequently, we assumed that such behavior could serve to distinguish occluded tissue from freely flowing infusate; 3) a stylet prevents catheter occlusion but flow insertion does not (as evidenced by the line pressure surrogate), and 4) in controlled conditions backflow is not affected by catheter occlusion and clearance.
The ex vivo ‘push-through’ experiments demonstrated that open endport catheters tend to core several millimeters of tissue during insertion, which then occludes the catheter tip at the start of infusion. Pressure builds up within the catheter lines until the core is rapidly expelled and pressure drops suddenly. Flow insertion at 1 μl/min did not alter this coring and subsequent pressure spike and core expulsion. A tight-fitting stylet that covers the endport during insertion and is then withdrawn before infusion eliminated the tissue coring and the corresponding pressure spike at the start of infusion. It can be argued that the distance covered by the catheter in a push through is much greater than in a normal insertion, yet infusions into deep brain structures such as the subthalamic nucleus (STN) in humans can be 8 cm deep, as can be inferred by careful measurements during DBS placements [23] (see Table 2 of the reference).
As we previously mentioned, tissue coring has been proposed for the characteristic pressure buildup and release from the very beginnings of CED application [1]. However, a subsequent study [14] failed to observe tissue coring upon insertion of needle through ex vivo brain tissue, which is contradictory to our observations. Interestingly, that study also failed to observe any pressure rise or fall in the experiments that failed to show coring. These discrepancies suggest that differences in technical methods, including sensitivity of pressure monitoring systems and/visualization methods, may have affected the results
Tissue coring during in vivo intraparenchymal infusion can not be directly confirmed, but based on our ex vivo tests, the characteristic pressure spike can be used as a surrogate indicator of its presence. The ex vivo brain studies confirmed that the same pressure spike behavior is present in open endport insertions, and absent when a stylet covers the endport during insertion. The peak pressure and the duration of the pressure rise was much greater when infusing into tissue that into the water bath. We speculate that the surrounding tissue will tend to hold the cored plug in place longer than was observed in the water bath, increasing the amount of fluid collected in the line and therefore, pressure.
Although coring can be avoided by using a closed endport during insertion, it did not seem to have a significant impact on the infusions, as in these studies the large pressure loss on occlusion clearance did not significantly increase chances for large backflow. These experiments were also unable to demonstrate any advantage for inserting with the infusate flowing. Previous protocols have used relatively low infusion rates during insertion, up to 1 μl/min [17, 18, 19], the rate at which tissue coring was observed in our ex vivo insertions. The in vivo flow insertions were performed at 5 μl/min in order to give the method the best chance to show an effect. In other words, we have used a higher flow rate during insertion than any reported in the literature, thus giving the best chance for removal of occlusions. However, the pressure traces in each case showed the spike associated with occlusion and subsequent clearance (in every case performed). It is thus not surprising that in addition no difference in backflow was shown for flow insertion. This also suggests that ramping up to 5 μl/min during the insertion process would not improve the probability of expelling tissue from the catheter lumen.
It may be argued that (i) the number of in vivo tests comparing flow insertion to insertion without flow is too small to disprove the assertion that there is no difference in line pressure behavior nor in the extent of backflow; (ii) that the lack of difference in tissue occlusion in such a comparison is inferred rather than demonstrated; and (iii) that the claim that there is no deleterious effect on backflow due to tissue occlusion is also not proven due to the small number of observations. The ex vivo studies that directly examine pressure behavior with coring of tissue resulted in a 100% correlation in 3 trials. The correlation between the coring and the pressure behavior receives further support from the four in-vivo coring tests, where preventing coring (by a blocking stylet) was shown to remove that pressure spike noted when coring occurred; and conversely when there was no blocking stylet there was indeed a pressure spike. While indirect, these results provide further evidence for the correlation directly noted in the ex vivo tests. Based on this data we conclude that (i) a lower flow rate upon insertion would not have prevented coring, and (ii) then infusing at 5 uL/min without ramping the flow rate, i.e. immediately upon placement, would not have lowered the backflow. Finally, although we did not observe it, tissue occlusion could possibly result in occasional ‘catastrophic’ backflow. Nevertheless, our failure to observe it at least indicates that backflow is not an inevitable result of having an open endport catheter and a pressure that rises, peaks, and falls abruptly after the start of the infusion.
To conclude, we have demonstrated that open endport catheters occlude during insertion, which can be prevented by a temporarily closing the port with stylet but not by infusing while inserting. Based on the present findings, the use of infusing while inserting procedure seems unnecessary. Furthermore, its clinical translation is worrisome, especially during the infusion of biologics, like gene transfer, where the use of flow insertions may increase the risk of gene delivery into areas that the catheter passes, thus increasing the risk of unwanted effects by therapy misplacement.
Acknowledgments
The investigators are grateful to Dr. K. Brunner for surgical support; Dr. E. Brodski for MRI support; V. Carter, N. Goecks, R. Velotta, J. Raschke, and D. Consigny, for excellent technical assistance.
This research was primarily supported by the Kinetics Foundation. Additional support was provided by NIH-NCRR grant P51 RR000167 (Wisconsin National Primate Research Center, University of Wisconsin-Madison), and NIH T32 CA009206 (University of Wisconsin-Madison). This research was conducted at a facility constructed with support from Research Facilities Improvement Program grants RR15459-01 and RR020141-01.
All of the authors, with the exception of the last (ME) have ownership in commercial entities involved with intraparenchymal infusions. The catheter used in these studies belongs to a company owned by Chris Ross. However, none of the authors have a financial interest in the outcome of these studies. In particular, these studies did not evaluate the performance of the catheter itself, only of infusion protocols used by the community. Finally, KK although employed by the agency funding these studies contributed to the discussions of the experimental designs.
Finally we thank an anonymous referee for comments that helped improve the presentation of the manuscript.
References
- 1.Bobo RH, Laske DW, Akbasak A, Morrison PF, Dedrick RL, Oldfield EH. Convection-enhanced delivery of macromolecules in the brain. Proc Natl Acad Sci USA. 1994;91:2076–80. doi: 10.1073/pnas.91.6.2076. [DOI] [PMC free article] [PubMed] [Google Scholar]
- 2.Kunwar S, Prados MD, Chang SM, et al. Direct intracerebral delivery of cintredekin besudotox (IL13-PE38QQR) in recurrent malignant glioma: a report by the Cintredekin Besudotox Intraparenchymal Study Group. J Clin Oncol Mar. 2007;25(7):837–44. doi: 10.1200/JCO.2006.08.1117. [DOI] [PubMed] [Google Scholar]
- 3.Lidar Z, Mardor Y, Jonas T, Pfeffer R, Faibel M, Nass D, Hadani M, Ram Z. Convection-enhanced delivery of paclitaxel for the treatment of recurrent malignant glioma: a phase I/II clinical study. J Neurosurg Mar. 2004;100(3):472–9. doi: 10.3171/jns.2004.100.3.0472. [DOI] [PubMed] [Google Scholar]
- 4.Nutt JG, Burchiel KJ, Comella CL, Jankovic J, Lang AE, Laws J, ER, Lozano AM, Penn RD, Simson J, RK, Stacy M, Wooten GF. Randomized, double-blind trial of glial cell line-derived neurotrophic factor (GDNF) in PD. Neurology. 2003 Jan;60(1):69–73. doi: 10.1212/wnl.60.1.69. [DOI] [PubMed] [Google Scholar]
- 5.Lang AE, Gill S, Patel NK, et al. Randomized controlled trial of intraputamenal glial cell line-derived neurotrophic factor infusion in Parkinson disease. Ann Neurol Mar. 2006;59(3):459–66. doi: 10.1002/ana.20737. [DOI] [PubMed] [Google Scholar]
- 6.Marks WJ, Bartus RT, Siffert J, et al. Gene delivery of AAV2-neurturin for Parkinson’s disease: a double-blind, randomized, controlled trial. Lancet Neurol. 2010 Dec;9(12):1164–72. doi: 10.1016/S1474-4422(10)70254-4. [DOI] [PubMed] [Google Scholar]
- 7.Morrison PF, Chen MY, Chadwick RS, Lonser RR, Oldfield EH. Focal delivery during direct infusion to brain: role of flow rate, catheter diameter, and tissue mechanics. Am J Physiol. 1999;277:R1218–29. doi: 10.1152/ajpregu.1999.277.4.R1218. [DOI] [PubMed] [Google Scholar]
- 8.Raghavan R, Mikaelian S, Brady M, Chen ZJ. Fluid infusions from catheters into elastic tissue: I. Azimuthally symmetric backflow in homogeneous media. Phys Med Biol. 2010;55:281–304. doi: 10.1088/0031-9155/55/1/017. [DOI] [PubMed] [Google Scholar]
- 9.Marks WJ, Ostrem JL, Verhagen L, Starr PA, Larson PS, Bakay RAE, Taylor R, Cahn-Weiner DA, Stoessl AJ, Olanow CW, Bartus RT. Safety and tolerability of intraputaminal delivery of CERE-120 (adeno-associated virus serotype 2—neurturin) to patients with idiopathic Parkinson’s disease: an open-label, phase I trial. Lancet Neurol May. 2008;7(5):400–8. doi: 10.1016/S1474-4422(08)70065-6. [DOI] [PubMed] [Google Scholar]
- 10.Kaplitt M, Feigin A, Tang C, Fitzsimons H, Mattis P, Lawlor P, Bland R, Young D, Strybing K, Eidelberg D, During M. Safety and tolerability of gene therapy with an adeno-associated virus (AAV) borne GAD gene for Parkinson’s disease: an open label, phase I trial. Lancet. 2007;369(9579):2097–105. doi: 10.1016/S0140-6736(07)60982-9. [DOI] [PubMed] [Google Scholar]
- 11.Sampson J, Brady M, Petry N, Croteau D, Friedman A, Friedman H, Wong T, Bigner D, Pastan I, Puri R, Pedain C. Intracerebral infusate distribution by convection-enhanced delivery in humans with malignant gliomas: descriptive effects of target anatomy and catheter positioning. Neurosurgery. 2007;60(2 Suppl 1):89–99. doi: 10.1227/01.NEU.0000249256.09289.5F. [DOI] [PubMed] [Google Scholar]
- 12.Mehta A, Choi B, Raghavan R, Brady M, Friedman A, Bigner D, Pastan I, Sampson J. Imaging of Convection Enhanced Delivery of Toxins in Humans. Toxins. 2011;3(3):201–206. doi: 10.3390/toxins3030201. [DOI] [PMC free article] [PubMed] [Google Scholar]
- 13.Brady ML, Raghavan R, Alexander A, Kubota K, Sillay K, Emborg ME. Pathways of Infusate Loss during Convection-Enhanced Delivery into the Putamen Nucleus. Stereotact Funct Neurosurg. 2013;91(2):69–78. doi: 10.1159/000342492. [DOI] [PMC free article] [PubMed] [Google Scholar]
- 14.Prabhu SS, Broaddus WC, Gillies GT, Loudon WG, Chen ZJ, Smith B. Distribution of macromolecular dyes in brain using positive pressure infusion: a model for direct controlled delivery of therapeutic agents. Surg Neur. 1998;50:367–375. doi: 10.1016/s0090-3019(97)00361-3. [DOI] [PubMed] [Google Scholar]
- 15.Bauman M, Gillies G, Raghavan R, Brady MPC. Physical characterization of neurocatheter performance in a brain phantom gelatin with nanoscale porosity: steady-state and oscillatory flows. Nanotechnology. 2004;15:92–97. [Google Scholar]
- 16.Oh S, Odland R, Wilson S, Kroeger K, Liu C, Lowenstein P, Castro M, Hall W, Ohlfest J. Improved distribution of small molecules and viral vectors in the murine brain using a hollow fiber catheter. J Neurosurg. 2007;107:568–577. doi: 10.3171/JNS-07/09/0568. [DOI] [PMC free article] [PubMed] [Google Scholar]
- 17.Su X, Kells AP, Aguilar Salegio EA, Richardson RM, Hadaczek P, Beyer J, Bringas J, Pivirotto P, Forsayeth J, Bankiewicz KS. Real-time MR Imaging With Gadoteridol Predicts Distribution of Transgenes After Convection-enhanced Delivery of AAV2 Vectors. Mol Ther Aug. 2010;18(8):1490–1495. doi: 10.1038/mt.2010.114. [DOI] [PMC free article] [PubMed] [Google Scholar]
- 18.Richardson RM, Kells AP, Martin AJ, Larson PS, Starr PA, Piferi PG, Bates G, Tansey L, Rosenbluth KH, Bringas JR, Berger MS, Bankiewicz KS. Novel platform for MRI-guided convection-enhanced delivery of therapeutics: preclinical validation in nonhuman primate br. Stereotact Funct Neurosurg. 2011;89(3):141–51. doi: 10.1159/000323544. [DOI] [PMC free article] [PubMed] [Google Scholar]
- 19.Yin D, Valles FE, Fiandaca MS, Bringas J, Gimenez F, Berger MS, Forsayeth J, Bankiewicz KS. Optimal region of the putamen for image-guided convection-enhanced delivery of therapeutics in human and non-human primates. Neuroimage Jan. 2011;54 (Suppl 1):S196–203. doi: 10.1016/j.neuroimage.2009.08.069. [DOI] [PMC free article] [PubMed] [Google Scholar]
- 20.Emborg ME, Joers V, Fisher R, Brunner K, Carter V, Ross C, Raghavan R, Brady M, Raschke J, Kubota K, Alexander A. Intraoperative intracerebral MRI-guided navigation for accurate targeting in nonhuman primates. Cell Transplant. 2010;19:1587–97. doi: 10.3727/096368910X514323. [DOI] [PMC free article] [PubMed] [Google Scholar]
- 21.Brodsky E, Block W, Alexander A, Emborg M, Ross C, Sillay K. Intraoperative device targeting using real-time MRI. Paper presented at: Biomed. Sci. and Eng. Conf; 2011; Oak Ridge, TN. [Google Scholar]
- 22.Grabow B, Raghavan R, Brady M, Kubota K, Hurley S, Brodsky E, Raschke J, Alexander A, Block W. Real-time monitoring for systematic investigation of catheter design and infusion protocol effect on CED performance. Paper presented at: Proc. ISMRM; 2013; Salt Lake City. [Google Scholar]
- 23.Sillay K, Kumbier L, Ross C, Brady M, Alexander A, Gupta N, Adluru N, Miranpuri G, Williams J. Perioperative brain shift and deep brain stimulating electrode deformation analysis: implications for rigid and non-rigid devices. Ann Biomed Eng. 2013;41:293–304. doi: 10.1007/s10439-012-0650-0. [DOI] [PMC free article] [PubMed] [Google Scholar]