

Abstract
The deployment of visuospatial attention and the programming of saccades are governed by the inferred likelihood of events. In the present study, we combined computational modeling of psychophysical data with fMRI to characterize the computational and neural mechanisms underlying this flexible attentional control. Sixteen healthy human subjects performed a modified version of Posner's location-cueing paradigm in which the percentage of cue validity varied in time and the targets required saccadic responses. Trialwise estimates of the certainty (precision) of the prediction that the target would appear at the cued location were derived from a hierarchical Bayesian model fitted to individual trialwise saccadic response speeds. Trial-specific model parameters then entered analyses of fMRI data as parametric regressors. Moreover, dynamic causal modeling (DCM) was performed to identify the most likely functional architecture of the attentional reorienting network and its modulation by (Bayes-optimal) precision-dependent attention. While the frontal eye fields (FEFs), intraparietal sulcus, and temporoparietal junction (TPJ) of both hemispheres showed higher activity on invalid relative to valid trials, reorienting responses in right FEF, TPJ, and the putamen were significantly modulated by precision-dependent attention. Our DCM results suggested that the precision of predictability underlies the attentional modulation of the coupling of TPJ with FEF and the putamen. Our results shed new light on the computational architecture and neuronal network dynamics underlying the context-sensitive deployment of visuospatial attention.
SIGNIFICANCE STATEMENT Spatial attention and its neural correlates in the human brain have been studied extensively with the help of fMRI and cueing paradigms in which the location of targets is pre-cued on a trial-by-trial basis. One aspect that has so far been neglected concerns the question of how the brain forms attentional expectancies when no a priori probability information is available but needs to be inferred from observations. This study elucidates the computational and neural mechanisms under which probabilistic inference governs attentional deployment. Our results show that Bayesian belief updating explains changes in cortical connectivity; in that directional influences from the temporoparietal junction on the frontal eye fields and the putamen were modulated by (Bayes-optimal) updates.
Keywords: attentional networks, Bayesian inference, fMRI, saccades, spatial cueing
Introduction
Saccades enable us to explore our visual environment efficiently and to focus on informative cues by foveal sampling with the highest visual acuity. Eye movements are crucially related to covert attention shifts (Rizzolatti et al., 1987; Awh et al., 2006), which precede saccades to select salient visual targets and adjust oculomotor programming. Therefore, eye movements and covert attention shifts share a common neuroanatomy (Corbetta et al., 1998; Nobre et al., 2000; Beauchamp et al., 2001; Fairhall et al., 2009).
Prior beliefs about the location of behaviorally relevant stimuli such as imminent saccade targets facilitate stimulus detection and increase response speed (RS). Prior beliefs can be induced by spatial cues, which indicate the probability of a target's location (percentage of cue validity, %CV) on a trial-by-trial basis (Posner, 1980). Sensory events that violate prior beliefs (invalid trials on which the target appears at the uncued location) elicit a response in a ventral frontoparietal network (comprising the temporoparietal junction, TPJ), but also in dorsal regions such as the frontal eye fields (FEFs) and intraparietal sulcus (IPS) (Corbetta et al., 2008; Corbetta and Shulman, 2011). In addition, behavioral performance and BOLD responses within these networks are modulated by the precision or predictability (%CV) (Vossel et al., 2006). The TPJ exhibits higher reorienting-related activity when the cue predicts the target location with a high probability (Vossel et al., 2012). The predictability of reorienting also affects activity in the striatum, insula, and frontal cortex (Shulman et al., 2009). In summary, attentional effects, both neuronally and behaviorally, are highly sensitive to probabilistic context; namely, the predictability or precision of prediction errors. However, the formal (computational) nature of these effects, and how they are implemented physiologically, has not been resolved as yet. Therefore, this study investigated the origin of these probability-dependent effects in terms of their computations and connectivity patterns within cortical networks.
In contrast to the classic location-cueing paradigm, in which subjects are explicitly informed about %CV, the likelihood of events in real life needs to be continuously inferred on the basis of recent observations. There is now considerable evidence that this inference process can be plausibly represented by hierarchical Bayesian models that provide a principled/normative description of how beliefs are updated optimally in the presence of new data (Behrens et al., 2007; Nassar et al., 2010; Payzan-LeNestour and Bossaerts, 2011; Iglesias et al., 2013). In the particular context of saccades, using an adapted version of Posner's location-cueing paradigm with unpredictable changes in %CV, RSs were found to covary with trialwise quantities derived from such a model (Vossel et al., 2014a). Although this suggests that the effects of predictability in the location-cueing paradigm follow Bayesian principles, it remains to be established whether—and in which brain areas—these computations are implemented neuronally. Moreover, it remains to be determined whether a Bayesian model outperforms simpler models of brain responses.
In the present study, we combined computational modeling (Vossel et al., 2014a, 2014b) with fMRI to investigate which neurophysiological processes may implement Bayesian inference for the deployment of attention and the programming of saccadic eye movements. We used a hierarchical Bayesian learning model (Mathys et al., 2011, 2014) to quantify the subjects' trialwise beliefs formally and used brain responses to identify the neuronal correlates of these beliefs. Accordingly, trialwise parameters from our computational model of behavioral responses were used as parametric explanatory variables in a general linear model (GLM) of our fMRI data. We then tested for modulation of neuronal activity in the areas of the frontoparietal attention networks and/or the striatum. The striatum is implicated in the learning of stimulus associations, actions, and rewards (Liljeholm and O'Doherty, 2012) and might contribute to attentional reorienting when reorienting is unexpected (Shulman et al., 2009). The parameters from the Bayesian model of behavior were also used as modulatory variables in analyses of effective connectivity to determine how Bayesian inference is mediated by connectivity within cortical or corticostriatal networks.
Materials and Methods
Subjects.
Eighteen healthy volunteers gave written informed consent to participate in the current study. Two subjects had to be excluded from further analysis due to technical difficulties with eye tracking in the MRI environment. Therefore, data from 16 subjects were analyzed (8 males, 8 females; age range, 19–31 years; mean age 24.9 years). All subjects were right-handed and had normal or corrected to normal vision. The study was approved by the local ethics committee (University College London).
Stimuli and experimental paradigm.
Stimuli were presented using a video projection screen mounted at the back of the magnet bore. Participants viewed the screen via a mirror system attached to the head coil. A location-cueing paradigm with central predictive cueing was used (Posner, 1980). On each trial, two peripherally located boxes were shown (2° wide and 8.4° eccentric in each visual field; Fig. 1A) that could contain target stimuli. A central diamond (0.7° eccentric in each visual field) was placed between them, serving as a fixation point. Cues were signaled by a 200 ms period of increasing brightness of one side of the diamond, creating an arrowhead pointing to one of the peripheral boxes. After an 800 ms stimulus onset asynchrony, the target, a vertical circular sinusoidal grating, appeared for 200 ms in one of the boxes.
Figure 1.

Experimental design and behavioral results. A, Exemplary illustration of a trial with a right, validly cued, target. In invalid trials, the target appeared at the location opposite to that cued. The subjects were instructed to maintain central fixation during the cue period and to make a saccade to the target stimulus as fast as possible. B, Trial-by-trial changes in precision-dependent attention α(π̂1(t)) that reflects the precision of the subject's belief that the target will appear at the cued location (black line) in relation to the experimentally manipulated cue validity (%CV, shaded areas). For this graph, α(π̂1(t)) was calculated on the basis of the average parameter estimates over all subjects. C, Mean RS for valid and invalid trials as a function of true (unknown) percentage of cue validity %CV. Error bars indicate SEM. D, Observed and predicted saccadic RSs as a function of precision-dependent attention α(π̂1(t)) derived from the hierarchical Bayesian learning scheme. For this graph, α(π̂1(t)) and predicted RS were calculated on the basis of group average values of the model parameters. Error bars indicate SEM.
Subjects were instructed to maintain central fixation during the cue period and to make a saccade to the target stimulus as fast as possible. They were encouraged to blink and refixate the central fixation dot after the saccade. On a separate day before the fMRI experiment, each subject completed two short practice sessions (one session with 100 trials with constant 80% predictive validity (%CV) and one session with 121 trials with changes in %CV). The fMRI experiment comprised 612 trials with blockwise changes in %CV that were unknown to the subjects. Each block with constant %CV contained an equal number of left and right targets, counterbalanced across valid and invalid trials. In addition, to optimize the statistical efficiency of our design, 192 null events (in which only the fixation dot and the two peripheral boxes were shown) were randomly intermixed with the experimental trials. %CV changed every 32–36 trials, switching randomly among levels of 88%, 69%, and 50% (Fig. 1B). Subjects were told in advance that there would be changes in %CV over the course of the experiment, but were not informed about the levels of these probabilities or when they would change. Each subject was presented with the same sequence of trials. This is a standard procedure in computational studies of trial-by-trial learning (Behrens et al., 2007; Daunizeau et al., 2010b; Iglesias et al., 2013) because the parameters of the learning process depend on the exact sequence of trials. This dependency will diminish asymptotically with an increasing number of trials. However, for the relatively short sequences (of a few hundred trials at best) that are feasible within a standard experiment, different trial sequences per participant could increase the variability of parameter estimates over and above the intrinsic interindividual differences per se. We therefore decided to keep the trial sequence constant to ensure that differences in model parameters can be attributed to subject-specific rather than task-specific factors. During the experiment, the subjects had four short rests of 50 s each in which the word “pause” was shown on the display. In total, the fMRI session lasted for 39 min.
Eye movement data recording and analysis.
Eye movements were recorded from the right eye with an EyeLink 1000 MR-compatible eye-tracker (SR Research) with a sampling rate of 1000 Hz. A 9- or 5-point eye-tracker calibration and validation were performed at the start of the experiment. The validation error was <1° of visual angle.
Eye movement data were analyzed with MATLAB (The MathWorks) and ILAB (Gitelman, 2002). Blinks were filtered out and pupil coordinates within a time window of 20 ms around the blink were removed. Trials with >20% missing data were discarded from the analyses. After target appearance, only the first saccade was analyzed. Saccades were identified when the eye velocity exceeded 30°/s (Fischer et al., 1993; Stampe, 1993). Moreover, the saccade amplitude needed to subtend at least 2/3 of the distance between fixation point and the target location. Saccadic RT was defined as the latency between target and saccade onset. Saccades in which the starting position was not within a region of 1° from the fixation point; saccades with a latency <90 ms (i.e., anticipated responses) were discarded. Our analyses focused on inverse response times (RTs) or RSs (RSs) because, in contrast to RTs, RSs are distributed normally (c.f. Carpenter and Williams, 1995; Brodersen et al., 2008).
In a first analysis, mean RSs were analyzed as a function of validity (valid/invalid) and true %CV (50%/69%/88%) using a within-subject ANOVA. Results from this analysis are reported at a significance level of p < 0.05 after Greenhouse–Geisser correction. This analysis was used to test for significant effects of predictability, which we then sought to model in terms of trialwise Bayesian belief updating.
Single-trial RSs were used to estimate parameters from a hierarchical Bayesian learning scheme. Herein, we will refer to this Bayesian hierarchical model as the perceptual model because this model provides a mapping from experimental causes to observations (Daunizeau et al., 2010a, 2010b; Vossel et al., 2014a; Fig. 2). Please note that, in our case, the observations do not represent the physical visual inputs (i.e., left and right cues and targets), but rather are defined at a higher level of abstraction in terms of the cue–target relationship (i.e., targets appearing at the cued or uncued location, respectively). However, as demonstrated in previous work (see derivation in the supplementary material to Iglesias et al., 2013), this formulation is formally identical to separately modeling two belief trajectories (for the two possible outcomes). The present formulation has the advantage of requiring a single belief trajectory only, allowing for a more compact model.
Figure 2.

Illustration of the perceptual model and the response model. The perceptual model comprises three hierarchical states (x1, x2, and x3). The subject-specific parameters ω and ϑ affect the updating of the subjects' beliefs about states of the world x and are estimated from individual RS data on the basis of precision-dependent attention α(π̂1(t)) that depends on the precision of the prediction at the first level of the perceptual model. Circles represent constants; diamonds represent quantities that change over time (trials); hexagons, like diamonds, represent quantities that change in time but that additionally depend on their previous state in time in a Markovian fashion.
In contrast, the response model describes the mapping from the subjects' beliefs, as derived from the perceptual model, to their responses as observed by the experimenter (i.e., saccadic RS; Fig. 2).
The perceptual model comprises three states denoted by x (Fig. 2). The state x1(t) represents the observation/environmental state of each trial, which, in the present paradigm, consisted of either a validly or invalidly cued saccade target (with x1(t) = 1 for valid and x1(t) = 0 for invalid trials). The probability distribution of x1(t) = 1 is a Bernoulli distribution governed by a sigmoidal transformation of the next higher state x2(t), which in turn changes over time as a Gaussian random walk. The volatility of x2(t) (i.e., how fast x2(t) changes after new observations) is determined by two quantities: x3(t) (the state of the next upper level of the hierarchy) and a subject-specific parameter ω. The third state x3(t) also changes as a Gaussian random walk, with the dispersion of the random walk being determined by a second subject-specific parameter ϑ. The values of the subject-specific parameters ω and ϑ were estimated from the individual RS data (see below).
To infer the probabilistic representations of the subject from environmental states, the perceptual model needs to be inverted; this yields the posterior densities of the three hidden states x(t). In the following, the sufficient statistics of the subject's posterior belief will be denoted by μ(t) (mean) and σ(t) (variance) or π(t) = (precision). We use the hat symbol (∧) to denote predictions before the observation of x1(t) on a given trial t. As described in detail in Mathys et al. (2011), variational model inversion under a mean field approximation yields simple analytical update equations in which belief updating rests on precision-weighted prediction errors. These update equations provide approximately Bayes-optimal rules for the trial-by-trial updating of the beliefs. In this experiment, they provide us with the subject's estimate of the probability that the target appears at the cued location on a particular trial (note that this is an individualized approximate Bayes optimality in reference to the subject-specific values for the parameters ω and ϑ).
A response model was used to map the subject's posterior beliefs to observed responses (Fig. 2). In our previous work (Vossel et al., 2014a), we compared three alternative response models and found that the most plausible model (the model with the highest evidence) was based upon the trialwise precision of the prediction at the first level of the perceptual model, π̂1(t). In this model, the precision π̂1(t) determines the amount of attentional resources allocated to the cued location, α(π̂1(t)), which varies between 0 and 1. Trialwise RSs can then be described as a linear function of α(π̂1(t)) as follows:
 |
π̂1(t) quantifies the precision of the prediction at the first level of the model before the observation of the target in trial t; that is, the precision of the prediction that the target will appear at the cued location. In our specific case, π̂1(t) has a minimal value of 4 when μ̂1(t) = 0.5 (both target locations are equally likely) and approaches infinity as μ̂1(t) approaches 1. The most parsimonious way to meet the constraints of the response model (namely that the amount of attentional resources α(t) varies between 0 and 1 and amounts to 0.5 for μ̂1(t) = 0.5) is to equate α(t) with a logistic function of π̂1(t) minus its minimum, α(π̂1(t)) = s(π̂1(t) − 4). Because the cue becomes a counterindication of outcome location when μ2(t−1) falls below 0 (or equivalently, when μ̂1(t) drops below 0.5), a suitable definition of α for the whole range of μ̂1(t) is α(π̂1(t)) = s(sign (μ2(t−1)) (π̂1(t) − 4)) (cf. Vossel et al., 2014a).
In the response model as outlined above α(π̂1(t)) determines trialwise RS according to a linear function. The linear relationship depends on the subject-specific response model parameters, ζ, which are estimated from the data. While ζ1v and ζ1i determine the constants of the linear equation (i.e., the overall levels of RSs), ζ2 parametrizes the slope of the affine function (i.e., the strength of the increase in RS with increased precision-dependent attention α(π̂1(t))).
The perceptual model parameters ω and ϑ, as well as the response model parameters ζ1v, ζ1i, and ζ2 were estimated from the trialwise RS measures using variational Bayes as implemented in the HGF toolbox (http://www.translationalneuromodeling.org/tapas/). Variational Bayes optimizes the (negative) free-energy F as a lower bound on the log evidence, such that maximizing F minimizes the Kullback–Leibler divergence between exact and approximate posterior distributions or, equivalently, the surprise about the inputs encountered (for details, see Friston et al., 2007).
Log-model evidence values can also be used to compare alternative models (Kass and Raftery, 1995). The relative differences between log-evidence values of different models (summed over individual subjects in a fixed-effects approach; Stephan et al., 2009) can be expressed as posterior probabilities of the model given the observed data. Here, we compared the hierarchical Bayesian model with a standard Rescorla–Wagner learning model (Rescorla and Wagner, 1972) in which the update of the probability estimate is the product of a fixed learning rate and a prediction error (i.e., the difference between the observed and predicted outcome). The learning rate was estimated from RSs by assuming a linear relationship with the estimated cue probability (analogous to the response model of the Bayesian model outlined above). Furthermore, we compared the Bayes and Rescorla–Wagner model with a model that assumed that RSs were explained by the true %CV levels.
MRI data acquisition.
T2*-weighted echoplanar (EPI) images with BOLD contrast (matrix size 64 × 64, voxel size 3 × 3 × 3 mm3) were obtained using a 3 T MRI System (Trio; Siemens). Before the functional scans, a B0 field map was acquired using a double-echo FLASH sequence for distortion correction of the acquired EPI images (Weiskopf et al., 2006). Field maps were estimated from the phase difference between the images acquired at the short and long TE using the FieldMap toolbox (Hutton et al., 2002). Additional high-resolution anatomical images (voxel size 1 × 1 × 1 mm3) were acquired using a T1-weighted 3D MDEFT sequence (Deichmann et al., 2004).
A total of 825 EPI volumes, each consisting of 40 axial slices were acquired sequentially (repetition time 2.8 s, echo time 30 ms). The first five volumes were discarded to allow for T1 equilibration effects. The data were preprocessed and analyzed with Statistical Parametric Mapping software SPM8 (Wellcome Department of Imaging Neuroscience, London; Friston et al., 1995; http://www.fil.ion.ucl.ac.uk/spm). Images were bias corrected. To correct for interscan movement, the images were spatially realigned to the first of the remaining 820 volumes and subsequently rerealigned to the mean of all images. The mean EPI image for each subject was then spatially normalized to the MNI single subject template using the “unified segmentation” function in SPM8. The ensuing deformation was subsequently applied to the individual EPI volumes and the T1 scan, which was coregistered to the mean of the realigned EPIs. All images were thereby transformed into standard stereotaxic space and resampled into 2 × 2 × 2 mm3 voxels. The normalized images were spatially smoothed using an 8 mm full-width half-maximum Gaussian kernel.
During scanning, peripheral measurements of subject pulse and breathing were acquired, together with scanner slice synchronization pulses using the Spike2 data acquisition system (Cambridge Electronic Design). The cardiac pulse signal was measured using an MRI-compatible pulse oximeter attached to the subject's finger. The respiratory signal (thoracic movement) was monitored using a pneumatic belt around the abdomen, close to the diaphragm. A physiological noise model was used to account for artifacts related to cardiac and respiratory phase and changes in respiratory volume (Hutton et al., 2011). Models for cardiac and respiratory phase and their aliased harmonics were based on RETROICOR (Glover et al., 2000). A Fourier series basis set, extending to the third harmonic, was used to model the physiological fluctuations. Additional terms were included to model changes in respiratory volume (Birn et al., 2006, 2008) and heart rate (Chang and Glover, 2009). This resulted in a total of 14 regressors, which were included as confounds in the first-level analysis for each subject (see below).
Statistical analysis of imaging data.
Data were analyzed using a random-effects general linear model (GLM). Four regressors of interest were defined at the single-subject level (valid and invalid trials for left and right targets, respectively). For each of these regressors, two parametric modulators were defined. The first parametric modulator was the (subject-specific) attentional weight (precision) for the cued location, α(π̂1(t)). The second regressor was the (subject-specific) volatility estimate (μ3(t)), orthogonalized with respect to α(π̂1(t)) (cf. den Ouden et al., 2010). Error trials (anticipated responses and incorrect/missing responses) were modeled separately. Events were time locked to the onset of the target and the resulting stimulus functions were convolved with a canonical hemodynamic response function (and its first and second derivative). The four rest periods, six movement parameters of the (rigid body) realignment, and the physiological regressors (see above) were included in the design matrix as additional regressors. Data were high-pass filtered at 1/128 Hz. For each subject, 12 condition-specific contrast images were created (for each trial type and parametric modulator).
For the main hemodynamic response function (HRF) regressor and the two parametric regressors precision α(π̂1(t)) and volatility μ3(t), the respective contrast images were analyzed according to 2 (validity: valid/invalid) × 2 (hemifield of target presentation: left/right) within-subject second-level ANOVAs. We focused on the analysis of main effects of validity, as well as its interaction with hemifield, by using planned t-contrasts. Moreover, to characterize the saccade network in the present study, we tested for a positive effect of the HRF regressor across all four conditions (valid and invalid left and right trials) in relation to the implicit baseline. In the analyses of the parametric regressors, we also tested for positive or negative effects across all four conditions. All contrasts were thresholded at p < 0.05 familywise error whole-brain corrected at the cluster-level (with a voxel-level cutoff of p < 0.001).
Bayesian model selection of alternative GLMs.
To determine whether the observed responses in the areas revealed by the ANOVA on the α(π̂1(t)) regressor were best explained by precision-dependent attention as derived from the hierarchical Bayesian model, we calculated log-evidence maps in these regions for the first-level GLM with precision-dependent attention α(π̂1(t)) for each subject (Penny et al., 2007). Moreover, log-evidence maps were calculated for GLMs with probability estimates derived from a Rescorla–Wagner model and from a model with the true probabilities as parametric regressors. The log-evidence maps from these three alternative models in the clusters of interest were compared at the second level using Bayesian model selection to evaluate group-level posterior probabilities (Rosa et al., 2010).
DCM.
To investigate effective connectivity and compare different models of functional architecture, DCM was performed using SPM12 (r6225).
Time series extraction.
DCMs were fitted to distributed BOLD time series from individual subjects. Subject-specific time series were extracted from specific ROIs that were selected on the basis of the group GLM analysis. Time series were extracted from the nearest local maximum within a radius of 8 mm from the group maximum in right FEF, TPJ, and the putamen. The first eigenvariate was then computed across all voxels within 6 mm of the subject-specific maximum. The resulting time series were adjusted for effects of no interest (e.g., rest periods, error trials) and physiological confounds so that the analyses focused on BOLD responses reflecting the effects of valid and invalid cueing and the modulation by precision (effects of the volatility regressor were also excluded).
Specification of DCMs and the model space.
On the basis of our GLM results, we specified bilinear deterministic DCMs (Friston et al., 2003). DCMs are defined in terms of fixed (endogenous) connections between brain areas and input-specific changes in the strength of these connections (i.e., modulatory or bilinear effects). In the present analysis, we focused on the connectivity between those three regions in which the response to invalidly versus validly cued targets was modulated by α(π̂1(t)) according to our GLM results (i.e., areas FEF, TPJ, and putamen in the right hemisphere). In all of the models we compared, we assumed full endogenous connectivity among the three areas (see Fig. 5). The target stimuli (collapsed over left and right validly and invalidly cued targets) were used as driving inputs. Driving input was assumed to enter the putamen because it receives visual input from the superior colliculi and thalamus (Redgrave and Gurney, 2006). Furthermore, we explored whether additional driving inputs into FEF and/or TPJ, respectively, improved the model. For simplicity, we did not include lower-level visual areas in our DCMs, focusing instead on the subgraph modeling of the attentional network engaged by our paradigm. Because the ranking of FEF and TPJ within the visual hierarchy is unclear, we specified three model families to determine whether the sensory input drives: (1) putamen and FEF; (2) putamen and TPJ; or (3) putamen, FEF and TPJ. For each of these three families, we specified models with different modulatory (bilinear) effects (see Fig. 5). Specifically, we tested whether the source of the precision-dependent processing was located in the putamen, FEF, or TPJ and how self-connections or efferent connections between the source region and connected regions changed as a function of α(π̂1(t)) on valid and invalid trials. Systematic combinations of the source of precision and its modulation of efferent connections resulted in 12 models for each visual input family (see Fig. 5). Because α(π̂1(t)) reflects the number of precision-dependent attentional resources directed to the cued location, we expected differential modulatory effects for valid and invalid trials: namely, negative modulation on valid trials and positive modulation on invalid trials (compare the results for the contrast of parametric regressors in the GLM analysis). Note that the DCM parameters for fixed and bilinear connections have zero prior means so that the directions of the modulations are not a priori included in the models.
Figure 5.

Illustration of the model space for Bayesian model selection: the sources of the driving inputs were varied to create three model families with 12 models each (PUT and FEF, PUT and TPJ, PUT, FEF and TPJ; families not shown in the figure). In a first step, the three model families were compared to reveal the most likely sources of driving inputs. Subsequently, the optimal model within the winning family was determined. PUT, Putamen.
Model selection and parameter inference.
We used a two-step fixed-effects approach to Bayesian model selection to determine which model best explained our observed responses in putamen, FEF, and TPJ. This analysis assumes that all subjects engage the same network for attentional deployment, but with different connection strengths (Stephan et al., 2010). In a first step, we used family-level inference (Penny et al., 2010) to determine whether models with visual input into putamen and FEF, putamen and TPJ, or all three areas best explained the observed data. Second, the models of the winning family were compared to identify the most plausible DCM of precision-related effects. The parameters of the winning DCM were summarized by Bayesian parameter averaging, which computes a joint posterior density for the entire group by combining the individual posterior densities (Neumann and Lohmann, 2003; Garrido et al., 2007).
Results
Behavioral data
The percentage of anticipated responses, incorrect or missing saccades, and saccades not starting from the fixation zone amounted to 1.6% (± 0.5 SEM), 2.3% (± 0.4), and 4.4% (± 1.2), respectively. These trials were excluded from further analysis of behavioral data and were modeled separately in the analysis of the fMRI data.
The 2 × 3 repeated-measures ANOVA on condition-specific mean RS as a function of validity (valid/invalid) and %CV (50/69/88%) revealed a significant main effect of validity (F(1,15) = 37.7, p < 0.001), reflecting faster responses to validly than to invalidly cued targets. The validity × %CV interaction effect was also significant (F(1.97,29.6) = 9.0, p = 0.001), indicating a differential impact of %CV on invalid and valid trials (Fig. 1C). The main effect of %CV was not significant (p > 0.5).
Figure 1B shows the trial-by-trial changes in precision-dependent attention α(π̂1(t)). This variable reflects the amount of attention to the cued location (based on the group average values of ω and ϑ). The RSs in relation to α(π̂1(t)), averaged across 0.1 bins, are shown in Figure 1D. A 2 × 6 repeated-measures ANOVA (validity: valid/invalid; α(π̂1(t)): 0.5/0.6/0.7/0.8/0.9/1.0) revealed a significant main effect of validity (F(1,15) = 37.4, p < 0.001), again reflecting faster responses to validly than to invalidly cued targets. Moreover, the validity × α(π̂1(t)) interaction effect was significant (F(2.25,33.7) = 7.7, p < 0.001), indicating a differential impact (in terms of opposing effects; Fig. 1D) of precision-dependent attention α(π̂1(t)) on valid and invalid trials. The main effect of α(π̂1(t)) was not significant (p > 0.4).
The comparison of the relative log-model evidences between the hierarchical Bayesian model, a Rescorla–Wagner model and a model informed by true %CV values revealed that the Bayesian model was clearly superior to the alternative models in explaining variations in RS (posterior probability of the Bayesian model = 1.0).
fMRI data
Whole-brain SPM analysis
In a first step, contrast images of the main HRF regressor were analyzed according to a 2 (validity: valid/invalid) × 2 (hemifield: left/right) factorial design (Table 1). Moreover, those brain areas that were generally more active in the experimental task than in the implicit baseline were identified. This contrast disclosed activation in bilateral precentral gyrus/FEF, left IPS, bilateral cerebellum, bilateral V1 and V5, as well as in the bilateral putamen.
Table 1.
Results of the ANOVA on the main HRF regressor
| Region | Direction | Side | MNI coordinates |
Voxels | Z-score | ||
|---|---|---|---|---|---|---|---|
| x | y | z | |||||
| All trials > baseline | |||||||
| Precentral gyrus/FEF | N/A | L | −48 | −4 | 44 | 2155 | 7.19 |
| N/A | R | 38 | −4 | 50 | 1054 | 6.74 | |
| IPS | N/A | L | −30 | −48 | 50 | 714 | 6.01 |
| Visual cortex/V1 | N/A | L | −8 | −76 | 8 | 8100 | 6.59 |
| N/A | R | 14 | −76 | 4 | 6.47 | ||
| Cerebellum | N/A | L | −10 | −74 | −20 | 6.96 | |
| N/A | R | 8 | −74 | −18 | 6.80 | ||
| Middle occipital gyrus/V5 | N/A | L | −38 | −62 | 6 | 6.38 | |
| N/A | R | 50 | −58 | 4 | 772 | 4.97 | |
| Putamen | N/A | L | −22 | 6 | 6 | 750 | 6.35 |
| N/A | R | 22 | 8 | 10 | 488 | 5.53 | |
| Main effect of validity (I vs V trials) | |||||||
| Superior frontal gyrus | I > V | R | 26 | 0 | 54 | 1641 | 4.97 |
| Precentral gyrus | I > V | R | 50 | 8 | 30 | 5.13 | |
| I > V | L | −28 | −2 | 60 | 1084 | 4.58 | |
| Middle temporal gyrus | I > V | R | 64 | −52 | −2 | 1062 | 4.47 |
| Supramarginal gyrus | I > V | R | 52 | −28 | 38 | 8711 | 5.48 |
| Superior parietal lobe | I > V | L | −36 | −48 | 62 | 4.83 | |
| Precuneus | I > V | L | −12 | −54 | 72 | 4.76 | |
| Validity × hemifield interaction | |||||||
| n.s. | |||||||
N/A, Not applicable; I, invalid; V, valid; n.s., not significant.
The network that was activated by invalid versus valid cues is shown in Figure 3 and comprised bilateral precentral gyrus/FEF (extending into ventral frontal cortex), IPS (extending into the inferior parietal lobe and into the postcentral gyrus in the left hemisphere), and middle temporal gyrus (see Table 1 for a complete list of activated regions and MNI coordinates). Figure 3B shows the overlay between the activity related to eye movements per se (as tested using the contrast of all trials vs baseline above, depicted in blue) and the effects of validity in the FEF. No significant effects were obtained when testing for interaction effects of validity with the hemifield of target presentation.
Figure 3.
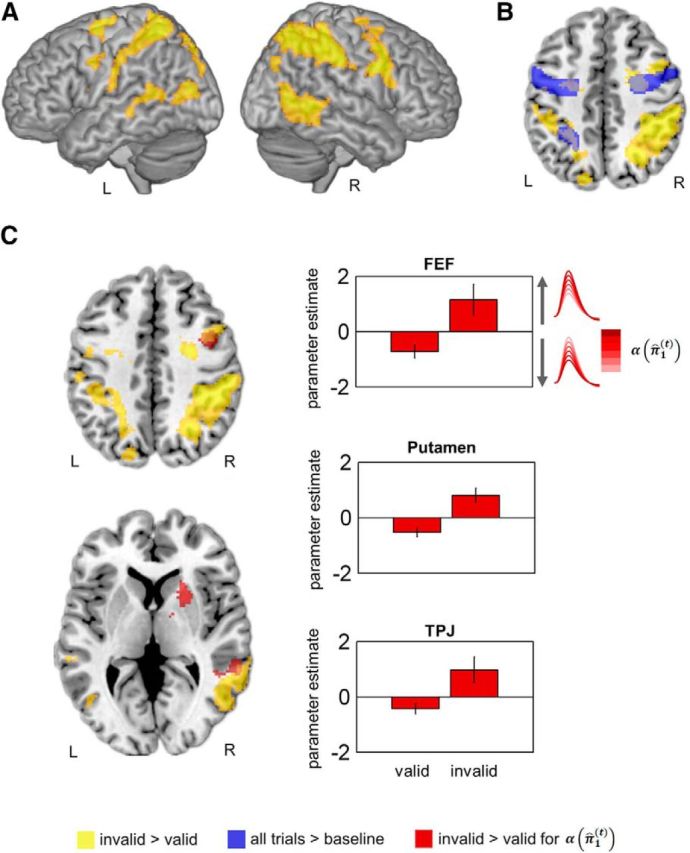
Results of the GLM analysis. A, Reorienting network as revealed by a t-contrast (invalid > valid) for the main HRF regressor. B, Overlap between the saccade network and the reorienting network in the FEF. C, Precision-dependent differences between invalid and valid trials as revealed by a t-contrast (invalid > valid) for the parametric modulation with α(π̂1(t)). The bar charts depict the mean parameter (β) estimates (± SEM) for the parametric regressor for valid and invalid trials.
The ANOVA on the precision-dependent attention regressor α(π̂1(t)) did not reveal positive or negative effects of α(π̂1(t)) across all trials (Table 2). However, we observed a significant main effect of validity: precision-dependent attentional reorienting effects were expressed in the right FEF (x = 42, y = 4, z = 42, 314 voxels, Z = 3.9), right TPJ (x = 46, y = −46, z = 6, 214 voxels, Z = 3.75) and the right anterior putamen (x = 22, y = 16, z = 4, 173 voxels, Z = 4.38) (see red activations in Fig. 3C). In these areas, the sensitivity to α(π̂1(t)) was significantly higher for invalid than for valid trials, with positive slopes for invalid and negative slopes for valid trials (cf. bar charts in Fig. 3C). In other words, higher confidence or a more precise prediction that the target would appear at the cued location decreased BOLD amplitudes on valid trials (when the prediction was fulfilled) and increased BOLD amplitudes on invalid trials (when the target appeared at the uncued location and the prediction was violated). Again, there was no interaction effect with the hemifield of target appearance. The analyses of parametric effects with the trial-specific volatility estimates (μ3(t)) did not reveal any significant effects.
Table 2.
Results of the ANOVA on the two parametric regressors for precision-dependent attention α(π̂1(t)) and volatility μ3(t)
| Region | Direction | Side | MNI coordinates |
Voxels | Z-score | ||
|---|---|---|---|---|---|---|---|
| x | y | z | |||||
| Parametric regressor: precision-dependent attention α(π̂1(t)) | |||||||
| All trials | |||||||
| n.s. | |||||||
| Main effect of validity (I vs V trials) | |||||||
| Precentral gyrus/FEF | I > V | R | 42 | 4 | 42 | 314 | 3.9 |
| TPJ | I > V | R | 46 | −46 | 6 | 214 | 3.75 |
| Putamen | I > V | R | 22 | 16 | 4 | 173 | 4.38 |
| Validity × hemifield interaction | |||||||
| n.s. | |||||||
| Parametric regressor: volatility μ3(t) | |||||||
| All effects n.s. | |||||||
n.s., Not significant; I, invalid; V, valid.
Bayesian model selection of alternative GLMs
In analogy to the model comparison of the behavioral data, we tested whether brain responses in FEF, TPJ, and the putamen were best explained by the hierarchical Bayesian model, or if simpler models such as the Rescorla–Wager model or a model based on true %CV would provide better explanations. Voxelwise log-evidence maps were calculated for the three alternative models in the three ROIs in each subject and compared at the second level. In all three regions, the posterior probabilities were clearly higher for the Bayesian model than for the other two models (Fig. 4) and there were no voxels in which responses were better explained by the Rescorla–Wagner or true %CV model.
Figure 4.

Results from the Bayesian model selection of competing GLMs comprising the parametric regressors from the Bayesian model, a Rescorla–Wagner model, and a model based upon true %CV. Posterior probabilities >0.9 for the Bayesian model in the three ROIs are shown.
DCM
DCM was used to shed light on the context-sensitive interactions between those areas that our SPM analysis found to exhibit precision-dependent attention effects (i.e., right putamen, FEF, and TPJ; Fig. 5). First, family-level Bayesian model selection was used to reveal the most likely configuration of driving inputs. Models with visual input into putamen and TPJ were clearly superior to models with input into putamen and FEF or all three regions (posterior probability = 1.0). Among the 12 models of the winning visual input family, model 10 was superior to the other 12 models (posterior probability = 0.99). Figure 6 depicts the results of the Bayesian parameter averaging across subjects for the connections of this model and their attentional modulation by precision.
Figure 6.

Results of the Bayesian parameter averaging across subjects under the winning model (model 10 of Fig. 5 with inputs into putamen und TPJ). Illustration of fixed connections and modulations of connections by α(π̂1(t)) in valid and invalid trials: parameter estimates for valid and invalid trials were contrasted against each other (cf. graphs on the right). Tables depict the Bayesian parameter averages with posterior probabilities in parentheses.
Inspection of the modulatory parameters on valid and invalid trials showed that higher values of precision-dependent attention α(π̂1(t)) decreased connectivity between TPJ and FEF on valid trials. In contrast, connectivity strongly increased with higher α(π̂1(t)) on invalid trials between TPJ and FEF. The modulations of the TPJ→putamen connection showed the same pattern, but the posterior probabilities just failed to reach the 90% threshold. However, the parameters were higher for invalid than for valid trials for both the TPJ→FEF and TPJ→PUT connections (Fig. 6).
Discussion
In this study, we combined computational modeling of psychophysical data with fMRI to investigate how probabilistic inference guides the deployment of visuospatial attention and explains the activity of attentional networks. Replicating previous results, RS was affected by probabilistic context (%CV) and could plausibly be explained by Bayesian updates of precision that govern the deployment of attention. Neuronal activity was enhanced on invalid compared with valid trials in a bilateral frontoparietal network. In the right FEF, TPJ, and putamen, reorienting-related responses were modulated by the precision of—or confidence in—the belief that the target will appear at the cued location. DCM suggested that precision-dependent attention differentially modulated connectivity between TPJ and FEF, as well as between TPJ and the putamen, on valid and invalid trials. The trial-by-trial connection strength from TPJ to FEF changed with precision-dependent attention, depending upon the outcome: connection strength decreased with precision on valid and increased on invalid trials. These context-sensitive coupling changes may be interpreted as a reflection of the optimal deployment of attentional resources mediated by (Bayes-optimal) precision updates.
Contrasting invalid and valid trials revealed brain areas of two well described attention networks (i.e., dorsal and ventral frontoparietal regions). The TPJ, for which a right-hemispheric lateralization has been proposed (but see Geng and Vossel, 2013), was activated in the left hemisphere in this contrast between all invalid and valid trials for the main HRF regressor. However, the right TPJ showed a parametric reorienting response that was modulated by precision-dependent attention. This finding is consistent with previous results according to which right TPJ activity is modulated by the explicit knowledge of %CV (Vossel et al., 2006; Vossel et al., 2012). In addition, the right putamen and right FEF showed parametric precision-dependent reorienting responses. More specifically, these regions showed decreased activity on valid trials and this deactivation grew with the precision of the prediction. Conversely, activity was increased on invalid trials and this activation increased with precision.
The effect in this right-hemispheric network did not depend on the hemifield of target presentation (or saccade direction, respectively). From the perspective of monkey single-unit recordings, one could have expected contralateral activation in the FEF. However, human imaging studies often fail to report this lateralization, which might be too subtle to be picked up with fMRI (Neggers et al., 2012). Interestingly, fMRI studies using anti-saccade tasks have observed a preferential involvement of right frontal cortex structures in antisaccades compared with prosaccades (regardless of saccade direction; McDowell et al., 2002; Desouza et al., 2003) and gray matter volume within right FEF is negatively correlated with anti-saccade errors (Ettinger et al., 2005). These findings highlight the different specialization of left and right FEF, which has also been demonstrated by concurrent transcranial magnetic stimulation (TMS)/fMRI studies (Ruff et al., 2009). Interestingly, Ronconi et al. (2014) showed that TMS of the right (but not left) FEF disrupts updates of attentional focus (zooming) in response to cues with different spatial precision. This dynamic zooming may also play a role in the precision-dependent FEF response in the present study.
The involvement of the putamen in the present study could be related to two factors. First, the putamen has been implicated in the processing of stimulus contingencies and probabilistic inference and the coding of prediction errors (den Ouden et al., 2009, 2010; Liljeholm and O'Doherty, 2012). With regard to attentional reorienting, it has been observed that basal ganglia activation is affected by the degree to which reorienting can be expected (Shulman et al., 2009) and this is consistent with the present findings. Second, functional and structural imaging data have highlighted the role of the putamen in the control of saccadic eye movements and have challenged the designation of the nucleus caudatus and putamen as “oculomotor” versus “skeletomotor” striatum, respectively (Neggers et al., 2012). In the study by Neggers et al. (2012), the putamen was consistently involved in three different saccade tasks and was principally connected with FEF subregions, as revealed by DTI fiber tracking. Also in the present task, the mere execution of saccades activated the putamen (Table 1). Given its involvement in both probabilistic inference per se and eye movement control, the results of the present study motivate future research on the generality and specificity of the putamen in Bayesian inference in different attentional and motor-intentional cognitive systems.
Comparison of different model families revealed that visual stimulation evoked by the target stimuli was primarily conveyed to the TPJ and the putamen. Moreover, model comparison within this winning model family identified the TPJ as a likely source of precision-dependent effects on putamen and FEF. High values of precision (high certainty about the imminent saccade target location) decreased the modulatory influences from the TPJ to the FEF on valid trials, whereas the reverse effect (increased connectivity) was observed for invalid trials. A similar but weaker pattern was observed for the modulatory influences from the TPJ to the putamen. The TPJ is the key node of the ventral attention system of the human brain, whereas the FEF is part of the dorsal system. Previous DCM of the architecture of the dorsal and ventral system has highlighted the role of ventral to dorsal modulatory influences during attentional reorienting (Vossel et al., 2012). In this previous study, invalid cueing enhanced connectivity between visual areas and the right TPJ, as well as between the right TPJ and the IPS. Our present finding is consistent with this earlier result, because visual stimulation drove right TPJ activity and ventral to dorsal pathways (TPJ to FEF) were differentially modulated on invalid and valid trials. These findings do not necessarily imply that the right TPJ sends an early signal that triggers attentional reorienting. This idea was initially proposed by Corbetta and Shulman (2002), but more recent work provides evidence against an early reorienting signal in the right TPJ (Geng and Vossel, 2013; Macaluso and Doricchi, 2013; DiQuattro et al., 2014; Han and Marois, 2014). Instead, the TPJ might be involved in the updating of internal models (Geng and Vossel, 2013; Han and Marois, 2014) and the detection of mismatches between expected and actual stimuli (Doricchi et al., 2010). Our present finding can be plausibly interpreted along these lines: depending on the confirmation or violation of the model predictions that the target appears at the cued location, the TPJ suppressed or boosted activity in the FEF (and, to a lesser degree, also in the putamen), respectively. Given that the right FEF is involved in the top-down controlled allocation of attentional resources and the scaling of the attentional focus (Ronconi et al., 2014), the TPJ inputs could be regarded as update signals to these regions after the observation of new outcomes.
From a hierarchical message-passing perspective, one might expect that precision effects are reflected by changes in postsynaptic gain. DCM studies of other tasks using EEG and MEG have supported this notion (Brown and Friston, 2013; Moran et al., 2013). In contrast to DCM for M/EEG, where changes in gain are represented by changes of postsynaptic response amplitude (colloquially referred to as “intrinsic connectivity”), DCM for fMRI only allows for a more phenomenological representation of gain via the modulation of self-connections. In the present study, models with modulations of self-connections were inferior to models with modulations of interregional connections. Given that DCM for M/EEG relies upon more detailed neurobiological models with different cell populations and a more veridical representation of gain, our future work will use EEG or MEG studies of the precision-dependent effects observed in this study.
Although the effects were weaker, precision-dependent attention also affected the connection from the TPJ to the putamen. It has been proposed that the striatum receives a phasic dopaminergic input via retino-tecto-nigro-striatal projections (Redgrave and Gurney, 2006). Given its short latency (70–100 ms), this dopamine signaling is presumably based on preattentive/presaccadic sensory processing and may underlie the learning of contingencies. One could speculate that these signals provide the basis for an early reorienting response to unexpected events. However, such an effect was not observable in our DCM results (i.e., we did not find modulations of efferent connections from the putamen). Instead, the DCM results were dominated by TPJ signaling. Nevertheless, this does not preclude the existence of both early and late modulations, and neuromodulatory (e.g., dopaminergic) influences are likely to be related to precision-dependent gain in cortical systems (Friston et al., 2012).
The test for general effects of the precision-dependent attention regressor across valid and invalid trials did not reveal any significant effects (nor did the test of the volatility regressor). The design of our experimental task, in which the target followed the cue with a fixed 800 ms stimulus onset asynchrony, did not allow for a separate characterization of cue- and target-related BOLD responses. The finding of significant validity effects of precision-dependent attention, in the absence of a general condition-unspecific effect, may reflect that the signal was dominated by the target-related response with differential parametric effects (i.e., a negative modulation for valid and a positive modulation for invalid trials). M/EEG will be helpful in investigating preparatory and target-related responses and their modulation by precision-dependent attention in the future.
Footnotes
This work was supported by the Deutsche Forschungsgemeinschaft (Grant Vo1733/1-1 to S.V.), the Federal Ministry of Education and Research (BMBF Grant 01GQ1401 to S.V.), the Wellcome Trust (K.J.F.), the University of Zurich (K.E.S.), and the René and Susanne Braginsky Foundation (K.E.S.). The Wellcome Trust Centre for Neuroimaging is supported by core funding from the Wellcome Trust (Grant 091593/Z/10/Z).
The authors declare no competing financial interests.
This is an Open Access article distributed under the terms of the Creative Commons Attribution License Creative Commons Attribution 4.0 International, which permits unrestricted use, distribution and reproduction in any medium provided that the original work is properly attributed.
References
- Awh E, Armstrong KM, Moore T. Visual and oculomotor selection: links, causes and implications for spatial attention. Trends Cogn Sci. 2006;10:124–130. doi: 10.1016/j.tics.2006.01.001. [DOI] [PubMed] [Google Scholar]
- Beauchamp MS, Petit L, Ellmore TM, Ingeholm J, Haxby JV. A parametric fMRI study of overt and covert shifts of visuospatial attention. Neuroimage. 2001;14:310–321. doi: 10.1006/nimg.2001.0788. [DOI] [PubMed] [Google Scholar]
- Behrens TE, Woolrich MW, Walton ME, Rushworth MF. Learning the value of information in an uncertain world. Nat Neurosci. 2007;10:1214–1221. doi: 10.1038/nn1954. [DOI] [PubMed] [Google Scholar]
- Birn RM, Diamond JB, Smith MA, Bandettini PA. Separating respiratory-variation-related fluctuations from neuronal-activity-related fluctuations in fMRI. Neuroimage. 2006;31:1536–1548. doi: 10.1016/j.neuroimage.2006.02.048. [DOI] [PubMed] [Google Scholar]
- Birn RM, Smith MA, Jones TB, Bandettini PA. The respiration response function: the temporal dynamics of fMRI signal fluctuations related to changes in respiration. Neuroimage. 2008;40:644–654. doi: 10.1016/j.neuroimage.2007.11.059. [DOI] [PMC free article] [PubMed] [Google Scholar]
- Brodersen KH, Penny WD, Harrison LM, Daunizeau J, Ruff CC, Duzel E, Friston KJ, Stephan KE. Integrated Bayesian models of learning and decision making for saccadic eye movements. Neural Netw. 2008;21:1247–1260. doi: 10.1016/j.neunet.2008.08.007. [DOI] [PMC free article] [PubMed] [Google Scholar]
- Brown HR, Friston KJ. The functional anatomy of attention: a DCM study. Front Hum Neurosci. 2013;7:784. doi: 10.3389/fnhum.2013.00784. [DOI] [PMC free article] [PubMed] [Google Scholar]
- Carpenter RH, Williams ML. Neural computation of log likelihood in control of saccadic eye movements. Nature. 1995;377:59–62. doi: 10.1038/377059a0. [DOI] [PubMed] [Google Scholar]
- Chang C, Glover GH. Effects of model-based physiological noise correction on default mode network anti-correlations and correlations. Neuroimage. 2009;47:1448–1459. doi: 10.1016/j.neuroimage.2009.05.012. [DOI] [PMC free article] [PubMed] [Google Scholar]
- Corbetta M, Shulman GL. Spatial neglect and attention networks. Annu Rev Neurosci. 2011;34:569–599. doi: 10.1146/annurev-neuro-061010-113731. [DOI] [PMC free article] [PubMed] [Google Scholar]
- Corbetta M, Shulman GL. Control of goal-directed and stimulus-driven attention in the brain. Nat Rev Neurosci. 2002;3:201–215. doi: 10.1038/nrn755. [DOI] [PubMed] [Google Scholar]
- Corbetta M, Akbudak E, Conturo TE, Snyder AZ, Ollinger JM, Drury HA, Linenweber MR, Petersen SE, Raichle ME, Van Essen DC, Shulman GL. A common network of functional areas for attention and eye movements. Neuron. 1998;21:761–773. doi: 10.1016/S0896-6273(00)80593-0. [DOI] [PubMed] [Google Scholar]
- Corbetta M, Patel G, Shulman GL. The reorienting system of the human brain: from environment to theory of mind. Neuron. 2008;58:306–324. doi: 10.1016/j.neuron.2008.04.017. [DOI] [PMC free article] [PubMed] [Google Scholar]
- Daunizeau J, den Ouden HE, Pessiglione M, Kiebel SJ, Stephan KE, Friston KJ. Observing the observer (I): Meta-Bayesian models of learning and decision-making. PLoS One. 2010a;5:e15554. doi: 10.1371/journal.pone.0015554. [DOI] [PMC free article] [PubMed] [Google Scholar]
- Daunizeau J, den Ouden HE, Pessiglione M, Kiebel SJ, Friston KJ, Stephan KE. Observing the observer (II): deciding when to decide. PLoS One. 2010b;5:e15555. doi: 10.1371/journal.pone.0015555. [DOI] [PMC free article] [PubMed] [Google Scholar]
- Deichmann R, Schwarzbauer C, Turner R. Optimisation of the 3D MDEFT sequence for anatomical brain imaging: technical implications at 1.5 and 3T. Neuroimage. 2004;21:757–767. doi: 10.1016/j.neuroimage.2003.09.062. [DOI] [PubMed] [Google Scholar]
- den Ouden HE, Friston KJ, Daw ND, McIntosh AR, Stephan KE. A dual role for prediction error in associative learning. Cereb Cortex. 2009;19:1175–1185. doi: 10.1093/cercor/bhn161. [DOI] [PMC free article] [PubMed] [Google Scholar]
- den Ouden HE, Daunizeau J, Roiser J, Friston KJ, Stephan KE. Striatal prediction error modulates cortical coupling. J Neurosci. 2010;30:3210–3219. doi: 10.1523/JNEUROSCI.4458-09.2010. [DOI] [PMC free article] [PubMed] [Google Scholar]
- DeSouza JF, Menon RS, Everling S. Preparatory set associated with pro-saccades and anti-saccades in humans investigated with event-related fMRI. J Neurophysiol. 2003;89:1016–1023. doi: 10.1152/jn.00562.2002. [DOI] [PubMed] [Google Scholar]
- DiQuattro NE, Sawaki R, Geng JJ. Effective connectivity during feature-based attentional capture: evidence against the attentional reorienting hypothesis of TPJ. Cereb Cortex. 2014;24:3131–3141. doi: 10.1093/cercor/bht172. [DOI] [PubMed] [Google Scholar]
- Doricchi F, Macci E, Silvetti M, Macaluso E. Neural correlates of the spatial and expectancy components of endogenous and stimulus-driven orienting of attention in the Posner task. Cereb Cortex. 2010;20:1574–1585. doi: 10.1093/cercor/bhp215. [DOI] [PubMed] [Google Scholar]
- Ettinger U, Antonova E, Crawford TJ, Mitterschiffthaler MT, Goswani S, Sharma T, Kumari V. Structural neural correlates of prosaccade and anstisaccade eye movements in healthy humans. Neuroimage. 2005;24:487–494. doi: 10.1016/j.neuroimage.2004.08.019. [DOI] [PubMed] [Google Scholar]
- Fairhall SL, Indovina I, Driver J, Macaluso E. The brain network underlying serial visual search: comparing overt and covert spatial orienting, for activations and for effective connectivity. Cereb Cortex. 2009;19:2946–2958. doi: 10.1093/cercor/bhp064. [DOI] [PubMed] [Google Scholar]
- Fischer B, Biscaldi M, Otto P. Saccadic eye movements of dyslexic adult subjects. Neuropsychologia. 1993;31:887–906. doi: 10.1016/0028-3932(93)90146-Q. [DOI] [PubMed] [Google Scholar]
- Friston KJ, Holmes AP, Worsley KJ, Poline J-P, Frith CD, Frackowiak RJS. Statistical parametric maps in functional imaging: a general linear approach. Hum Brain Mapp. 1995;2:189–210. doi: 10.1002/hbm.460020402. [DOI] [Google Scholar]
- Friston KJ, Harrison L, Penny W. Dynamic causal modelling. Neuroimage. 2003;19:1273–1302. doi: 10.1016/S1053-8119(03)00202-7. [DOI] [PubMed] [Google Scholar]
- Friston K, Mattout J, Trujillo-Barreto N, Ashburner J, Penny W. Variational free energy and the Laplace approximation. Neuroimage. 2007;34:220–234. doi: 10.1016/j.neuroimage.2006.08.035. [DOI] [PubMed] [Google Scholar]
- Friston KJ, Shiner T, FitzGerald T, Galea JM, Adams R, Brown H, Dolan RJ, Moran R, Stephan KE, Bestmann S. Dopamine, affordance and active inference. PLoS Comput Biol. 2012;8:e1002327. doi: 10.1371/journal.pcbi.1002327. [DOI] [PMC free article] [PubMed] [Google Scholar]
- Garrido MI, Kilner JM, Kiebel SJ, Stephan KE, Friston KJ. Dynamic causal modelling of evoked potentials: a reproducibility study. Neuroimage. 2007;36:571–580. doi: 10.1016/j.neuroimage.2007.03.014. [DOI] [PMC free article] [PubMed] [Google Scholar]
- Geng JJ, Vossel S. Re-evaluating the role of TPJ in attentional control: contextual updating? Neurosci Biobehav Rev. 2013;37:2608–2620. doi: 10.1016/j.neubiorev.2013.08.010. [DOI] [PMC free article] [PubMed] [Google Scholar]
- Gitelman DR. ILAB: a program for postexperimental eye movement analysis. Behav Res Methods Instrum Comput. 2002;34:605–612. doi: 10.3758/BF03195488. [DOI] [PubMed] [Google Scholar]
- Glover GH, Li TQ, Ress D. Image-based method for retrospective correction of physiological motion effects in fMRI: RETROICOR. Magn Reson Med. 2000;44:162–167. doi: 10.1002/1522-2594(200007)44:1<162::aid-mrm23>3.0.co;2-e. [DOI] [PubMed] [Google Scholar]
- Han SW, Marois R. Functional fractionation of the stimulus-driven attention network. J Neurosci. 2014;34:6958–6969. doi: 10.1523/JNEUROSCI.4975-13.2014. [DOI] [PMC free article] [PubMed] [Google Scholar]
- Hutton C, Bork A, Josephs O, Deichmann R, Ashburner J, Turner R. Image distortion correction in fMRI: a quantitative evaluation. Neuroimage. 2002;16:217–240. doi: 10.1006/nimg.2001.1054. [DOI] [PubMed] [Google Scholar]
- Hutton C, Josephs O, Stadler J, Featherstone E, Reid A, Speck O, Bernarding J, Weiskopf N. The impact of physiological noise correction on fMRI at 7T. Neuroimage. 2011;57:101–112. doi: 10.1016/j.neuroimage.2011.04.018. [DOI] [PMC free article] [PubMed] [Google Scholar]
- Iglesias S, Mathys C, Brodersen KH, Kasper L, Piccirelli M, den Ouden HE, Stephan KE. Hierarchical prediction errors in midbrain and basal forebrain during sensory learning. Neuron. 2013;80:519–530. doi: 10.1016/j.neuron.2013.09.009. [DOI] [PubMed] [Google Scholar]
- Kass RE, Raftery AE. Bayes factors. J Am Stat Assoc. 1995;90:773–795. doi: 10.1080/01621459.1995.10476572. [DOI] [Google Scholar]
- Liljeholm M, O'Doherty JP. Contributions of the striatum to learning, motivation, and performance: an associative account. Trends Cogn Sci. 2012;16:467–475. doi: 10.1016/j.tics.2012.07.007. [DOI] [PMC free article] [PubMed] [Google Scholar]
- Macaluso E, Doricchi F. Attention and predictions: control of spatial attention beyond the endogenous-exogenous dichotomy. Front Hum Neurosci. 2013;7:685. doi: 10.3389/fnhum.2013.00685. [DOI] [PMC free article] [PubMed] [Google Scholar]
- Mathys C, Daunizeau J, Friston KJ, Stephan KE. A Bayesian foundation for individual learning under uncertainty. Front Hum Neurosci. 2011;5:39. doi: 10.3389/fnhum.2011.00039. [DOI] [PMC free article] [PubMed] [Google Scholar]
- Mathys CD, Lomakina EI, Daunizeau J, Iglesias S, Brodersen KH, Friston KJ, Stephan KE. Uncertainty in perception and the Hierarchical Gaussian Filter. Front Hum Neurosci. 2014;8:825. doi: 10.3389/fnhum.2014.00825. [DOI] [PMC free article] [PubMed] [Google Scholar]
- McDowell JE, Brown GG, Paulus M, Martinez A, Stewart SE, Dubowitz DJ, Braff DL. Neural correlates of refixation saccades and antisaccades in normal and schizophrenia subjects. Biol Psychiatry. 2002;51:216–223. doi: 10.1016/S0006-3223(01)01204-5. [DOI] [PubMed] [Google Scholar]
- Moran RJ, Campo P, Symmonds M, Stephan KE, Dolan RJ, Friston KJ. Free energy, precision and learning: the role of cholinergic neurotransmission. J Neurosci. 2013;33:8227–8236. doi: 10.1523/JNEUROSCI.4255-12.2013. [DOI] [PMC free article] [PubMed] [Google Scholar]
- Nassar MR, Wilson RC, Heasly B, Gold JI. An approximately Bayesian delta-rule model explains the dynamics of belief updating in a changing environment. J Neurosci. 2010;30:12366–12378. doi: 10.1523/JNEUROSCI.0822-10.2010. [DOI] [PMC free article] [PubMed] [Google Scholar]
- Neggers SF, van Diepen RM, Zandbelt BB, Vink M, Mandl RC, Gutteling TP. A functional and structural investigation of the human fronto-basal volitional saccade network. PLoS One. 2012;7:e29517. doi: 10.1371/journal.pone.0029517. [DOI] [PMC free article] [PubMed] [Google Scholar]
- Neumann J, Lohmann G. Bayesian second-level analysis of functional magnetic resonance images. Neuroimage. 2003;20:1346–1355. doi: 10.1016/S1053-8119(03)00443-9. [DOI] [PubMed] [Google Scholar]
- Nobre AC, Gitelman DR, Dias EC, Mesulam MM. Covert visual orienting and saccades: overlapping neural systems. Neuroimage. 2000;11:210–216. doi: 10.1006/nimg.2000.0539. [DOI] [PubMed] [Google Scholar]
- Payzan-LeNestour E, Bossaerts P. Risk, unexpected uncertainty, and estimation uncertainty: Bayesian learning in unstable settings. Plos Comput Biol. 2011;7:e1001048. doi: 10.1371/journal.pcbi.1001048. [DOI] [PMC free article] [PubMed] [Google Scholar]
- Penny WD, Stephan KE, Daunizeau J, Rosa MJ, Friston KJ, Schofield TM, Leff AP. Comparing families of dynamic causal models. PLoS Comput Biol. 2010;6:e1000709. doi: 10.1371/journal.pcbi.1000709. [DOI] [PMC free article] [PubMed] [Google Scholar]
- Penny W, Flandin G, Trujillo-Barreto N. Bayesian comparison of spatially regularised general linear models. Hum Brain Mapp. 2007;28:275–293. doi: 10.1002/hbm.20327. [DOI] [PMC free article] [PubMed] [Google Scholar]
- Posner MI. Orienting of attention. Q J Exp Psychol. 1980;32:3–25. doi: 10.1080/00335558008248231. [DOI] [PubMed] [Google Scholar]
- Redgrave P, Gurney K. The short-latency dopamine signal: a role in discovering novel actions? Nat Rev Neurosci. 2006;7:967–975. doi: 10.1038/nrn2022. [DOI] [PubMed] [Google Scholar]
- Rescorla RA, Wagner AR. A theory of Pavlovian conditioning: variations in the effectiveness of reinforcement. In: Black AH, Prokasy WF, editors. Classical conditioning, Vol II: Current research and theory. New York: Appleton-Century-Crofts; 1972. pp. 64–99. [Google Scholar]
- Rizzolatti G, Riggio L, Dascola I, Umiltá C. Reorienting attention across the horizontal and vertical meridians: evidence in favor of a premotor theory of attention. Neuropsychologia. 1987;25:31–40. doi: 10.1016/0028-3932(87)90041-8. [DOI] [PubMed] [Google Scholar]
- Ronconi L, Basso D, Gori S, Facoetti A. TMS on right frontal eye fields induces an inflexible focus of attention. Cereb Cortex. 2014;24:396–402. doi: 10.1093/cercor/bhs319. [DOI] [PubMed] [Google Scholar]
- Rosa MJ, Bestmann S, Harrison L, Penny W. Bayesian model selection maps for group studies. Neuroimage. 2010;49:217–224. doi: 10.1016/j.neuroimage.2009.08.051. [DOI] [PMC free article] [PubMed] [Google Scholar]
- Ruff CC, Blankenburg F, Bjoertomt O, Bestmann S, Weiskopf N, Driver J. Hemispheric differences in frontal and parietal influences on human occipital cortex: direct confirmation with concurrent TMS-fMRI. J Cogn Neurosci. 2009;21:1146–1161. doi: 10.1162/jocn.2009.21097. [DOI] [PMC free article] [PubMed] [Google Scholar]
- Shulman GL, Astafiev SV, Franke D, Pope DL, Snyder AZ, McAvoy MP, Corbetta M. Interaction of stimulus-driven reorienting and expectation in ventral and dorsal frontoparietal and basal ganglia-cortical networks. J Neurosci. 2009;29:4392–4407. doi: 10.1523/JNEUROSCI.5609-08.2009. [DOI] [PMC free article] [PubMed] [Google Scholar]
- Stampe DM. Heuristic filtering and reliable calibration methods for video-based pupil-tracking systems. Behav Res Methods Instrum Comput. 1993;25:137–142. doi: 10.3758/BF03204486. [DOI] [Google Scholar]
- Stephan KE, Penny WD, Daunizeau J, Moran RJ, Friston KJ. Bayesian model selection for group studies. Neuroimage. 2009;46:1004–1017. doi: 10.1016/j.neuroimage.2009.03.025. [DOI] [PMC free article] [PubMed] [Google Scholar]
- Stephan KE, Penny WD, Morn RJ, den Ouden HE, Daunizeau J, Friston KJ. Ten simple rules for dynamic causal modelling. Neuroimage. 2010;49:3099–3109. doi: 10.1016/j.neuroimage.2009.11.015. [DOI] [PMC free article] [PubMed] [Google Scholar]
- Vossel S, Thiel CM, Fink GR. Cue validity modulates the neural correlates of covert endogenous orienting of attention in parietal and frontal cortex. Neuroimage. 2006;32:1257–1264. doi: 10.1016/j.neuroimage.2006.05.019. [DOI] [PubMed] [Google Scholar]
- Vossel S, Weidner R, Driver J, Friston KJ, Fink GR. Deconstructing the architecture of dorsal and ventral attention systems with dynamic causal modeling. J Neurosci. 2012;32:10637–10648. doi: 10.1523/JNEUROSCI.0414-12.2012. [DOI] [PMC free article] [PubMed] [Google Scholar]
- Vossel S, Mathys C, Daunizeau J, Bauer M, Driver J, Friston KJ, Stephan KE. Spatial Attention, precision, and Bayesian inference: a study of saccadic response speed. Cereb Cortex. 2014a;24:1436–1450. doi: 10.1093/cercor/bhs418. [DOI] [PMC free article] [PubMed] [Google Scholar]
- Vossel S, Bauer M, Mathys C, Adams RA, Dolan RJ, Stephan KE, Friston KJ. Cholinergic stimulation enhances Bayesian belief updating in the deployment of spatial attention. J Neurosci. 2014b;34:15735–15742. doi: 10.1523/JNEUROSCI.0091-14.2014. [DOI] [PMC free article] [PubMed] [Google Scholar]
- Weiskopf N, Hutton C, Josephs O, Deichmann R. Optimal EPI parameters for reduction of susceptibility-induced BOLD sensitivity losses: a whole-brain analysis at 3T and 1.5T. Neuroimage. 2006;33:493–504. doi: 10.1016/j.neuroimage.2006.07.029. [DOI] [PubMed] [Google Scholar]