

ABSTRACT
Mitochondrial fission is important for organelle transport, quality control and apoptosis. Changes to the fission process can result in a wide variety of neurological diseases. In mammals, mitochondrial fission is executed by the GTPase dynamin-related protein 1 (Drp1; encoded by DNM1L), which oligomerizes around mitochondria and constricts the organelle. The mitochondrial outer membrane proteins Mff, MiD49 (encoded by MIEF2) and MiD51 (encoded by MIEF1) are involved in mitochondrial fission by recruiting Drp1 from the cytosol to the organelle surface. In addition, endoplasmic reticulum (ER) tubules have been shown to wrap around and constrict mitochondria before a fission event. Up to now, the presence of MiD49 and MiD51 at ER–mitochondrial division foci has not been established. Here, we combine confocal live-cell imaging with correlative cryogenic fluorescence microscopy and soft x-ray tomography to link MiD49 and MiD51 to the involvement of the ER in mitochondrial fission. We gain further insight into this complex process and characterize the 3D structure of ER–mitochondria contact sites.
KEY WORDS: Confocal microscopy, Endoplasmic reticulum, Microscopy imaging, Mitochondria, Mitochondrial fission, Soft X-ray tomography, Correlative imaging
Highlighted Article: Confocal live-cell imaging combined with correlative cryogenic fluorescence microscopy and soft X-ray tomography provide new insights into the complex process of mitochondrial fission in mammalian cells.
INTRODUCTION
Mitochondria are highly dynamic organelles that constantly move and undergo structural changes (Westermann, 2010; Otera and Mihara, 2011a; Labbe et al., 2014; Mishra and Chan, 2014). As they cannot be created de novo, individual mitochondria can undergo fusion and fission events, thus enabling the proper distribution of mitochondria within the cell (Varadi et al., 2004; Campello and Scorrano, 2010), as well as the proper distribution of vital components within the mitochondrial network (Parone et al., 2008). Fission events are crucial for the maintenance of mitochondrial and cellular function by contributing to the proper distribution of mitochondria in response to the metabolic needs of the cell for ATP (Parone et al., 2008; Otera and Mihara, 2011a). Likewise, during cell division, the mitochondrial network has to undergo extensive fragmentation to ensure equal distribution of the mitochondria and the mitochondrial DNA (mtDNA) into the two daughter cells.
One of the main functions of mitochondria is to supply cellular energy through the process of oxidative phosphorylation. Furthermore, mitochondria are involved in a range of other processes, such as intracellular signaling and apoptosis (Ryan and Hoogenraad, 2007). In accordance with these functions, mitochondrial defects and consequent changes in their morphology have been linked to several human diseases. Numerous mitochondrial diseases and other cell-destructive processes, such as aging and apoptosis, have been linked to a fragmented mitochondrial network, which has resulted from enhanced fission activity (Arduino et al., 2011; Glauser et al., 2011; Nakamura et al., 2011; Song et al., 2011; Elgass et al., 2013).
A number of proteins on the mitochondrial outer membrane mediate mitochondrial fission by recruiting the master fission mediator Drp1 (also known as DNM1L) (Legesse-Miller et al., 2003; Ingerman et al., 2005; Lackner and Nunnari, 2009; Mears et al., 2011) from the cytosol to mitochondria. These include the mitochondrial fission factor, Mff (Gandre-Babbe and van der Bliek, 2008; Otera et al., 2010; Otera and Mihara, 2011b) and the mitochondrial dynamics proteins MiD49 and MiD51 (also known as MIEF2 and MIEF1, respectively) (Palmer et al., 2011, 2013; Koirala et al., 2013; Loson et al., 2013, 2014; Richter et al., 2014). However, little is known about the complex interplay between these proteins, the precise mechanisms regulating the fission process or the involvement of the endoplasmic reticulum (ER) (Friedman et al., 2011; Friedman and Nunnari, 2014) and actin filaments (De Vos et al., 2005; Korobova et al., 2013).
A connection between mitochondria and the ER in Ca2+ signaling and apoptosis has been well established. Contact sites between mitochondria and the ER are important for phospholipid synthesis and Ca2+ signaling (Szabadkai et al., 2004; de Brito and Scorrano, 2010). A key finding about ER–mitochondrial contacts was made by de Brito and colleagues, who reported that the fusion protein Mfn2 is also involved in tethering mitochondria to the ER (de Brito and Scorrano, 2008). It has also been discovered recently that the ER is involved in regulating mitochondrial dynamics by marking the prospective sites of mitochondrial division (Friedman et al., 2011). Mitochondrial fission occurs at positions where ER tubules are wrapped around mitochondria, thus mediating constriction of the mitochondrial membranes and reduction of the mitochondrial diameter by approximately 30% before Drp1 recruitment. Wrapping of the ER around mitochondria is mainly observed at positions of Mff and Drp1 foci. However, in cells that have been depleted of Drp1 or Mff, mitochondrial constriction at sites of ER contact are observed, indicating that ER-mediated constriction of mitochondrial tubules proceeds independently of both Mff and Drp1 (Friedman et al., 2011). Recent studies have provided further insight into the process of ‘ER-associated mitochondrial division’ in yeast (Lackner et al., 2013; Murley et al., 2013; Friedman and Nunnari, 2014) and mammalian cells, which include the additional involvement of INF2, actin and myosin II (Korobova et al., 2013, 2014; Hatch et al., 2014).
Here, we investigate the link between MiD49, MiD51 and the ER in mitochondrial constriction and fission using a unique approach that combines confocal live-cell imaging, correlative cryogenic fluorescence microscopy and soft x-ray tomography (CFM–SXT) (Larabell and Nugent, 2010; McDermott et al., 2012; Parkinson et al., 2013; Smith et al., 2014b).
RESULTS
MiD foci combine during constriction of mitochondria
We have recently reported that mitochondrial fission events are apparent at low expression levels of ectopic MiD proteins (Palmer et al., 2013; Richter et al., 2014), whereas at higher expression levels, fission events are blocked owing to Drp1 sequestration on the mitochondrial surface, leading to unopposed fusion (Fig. 1A) (Palmer et al., 2011). Indeed, further analysis and quantification of our data demonstrated that there was an initial increase in fission events (Fig. 1B) and mitochondrial number (Fig. 1C), resulting in fragmented mitochondria following expression of green fluorescent protein (GFP)-tagged MiD51 (MiD51–GFP). Longer-term expression resulted in the fragmented mitochondria moving to a more networked state (moderate MiD levels), followed by mitochondrial elongation (at high MiD levels) (Fig. 1A). Fig. 1D shows the corresponding timecourse of MiD51–GFP expression, as determined by measuring the fluorescence intensity. To verify that the changes we saw in mitochondrial number over time are caused by MiD51–GFP, we also expressed a MiD51 mutant (MiD51R235A–GFP) that is unable to recruit Drp1 (Richter et al., 2014). As expected, we did not observe any changes in mitochondrial number over time with this mutant, whereas the number of mitochondria decreased over time following MiD51 expression, owing to the block in fission and unopposed fusion (supplementary material Fig. S1, Table S1).
Fig. 1.

Low levels of MiD-protein overexpression increases the number of fission events and mitochondria in a cell. (A) Time-lapse images of a single COS-7 cell after transfection with MiD51–GFP (green). Mitochondria were stained with MitoTracker Red. (B) The number of observed fission events increased in the first 15 min after beginning observation (timepoint 0=observation start, i.e. several hours after transfection when GFP fluorescence was just detectable); subsequently, with increasing levels of MiD51–GFP expression, fission was blocked and the number of observed fission events decreased substantially. (C) The number of mitochondria increased in the first 15 min after beginning observation; subsequently, with increasing levels of MiD51–GFP expression, fission was blocked and the number of mitochondria decreased accordingly. (D) The intensity of MiD51–GFP fluorescence increased over time following transfection. Fluorescence intensity was normalized to that at time point 0. Scale bars: 10 µm.
In contrast to what has been reported in the literature for other fission mediators, namely Mff and Drp1 (Legesse-Miller et al., 2003; Friedman et al., 2011), foci comprising MiD proteins (MiD foci) were observed not only at mitochondrial constriction sites but were also frequently observed at other sites of the outer mitochondrial membrane (Fig. 2A). In some cases, several MiD foci appeared to combine during the formation of a constriction site (Fig. 2A,B; supplementary material Movie 1). Constriction of a mitochondrion at MiD foci does not necessarily lead to an immediate scission event; observed constrictions appeared to be reversed and/or underwent several constriction–expansion cycles before finally being divided (Fig. 2B; supplementary material Movie 2). Nevertheless, using live-cell time-lapse imaging, we were able to show colocalization of MiD51 with Drp1 in the same fission foci during fission events (Fig. 2C; supplementary material Movie 3). Of note, we did not observe colocalization of the different proteins exclusively at fission and/or constriction sites (Fig. 3A–D). However, some foci might represent remnant assemblies following a fission event [e.g. as can be seen in the last image of the MiD51 and Drp1 fission-event time series (Fig. 2C, far right image)].
Fig. 2.
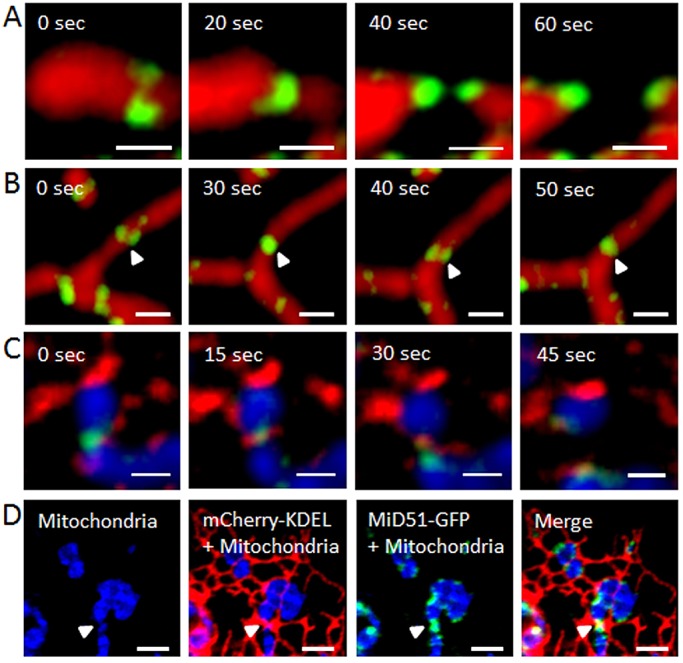
Fission events at foci of MiD51–GFP. (A) MiD51–GFP foci (green) were observed at mitochondria before constriction and combined during the event at the constriction site. Mitochondria were stained with MitoTracker Red (red). (B) Mitochondrion (red) undergoing constriction at MiD51–GFP foci (white arrowhead), followed by subsequent relaxation and reformation of the constriction. (C) Fission event at MiD51–GFP foci (green) in the presence of Drp1 (red). Mitochondria were stained with MitoTracker Deep Red and false colored in blue. (D) ER tubules (expressing mCherry-KDEL, red) contact mitochondria (blue) at a MiD51–GFP-foci constriction site (white arrowhead). Snapshots from time-lapse imaging of this constriction site are shown in Fig. 4A. Scale bars: 1 µm (A–C); 3 µm (D).
Fig. 3.

MiD proteins and other fission proteins can colocalize and interact in the same foci at mitochondria. (A) MiD51–GFP (green) and mCherry–Mff (red) colocalize in foci at mitochondria (blue). An overview image is shown (left panel) along with magnifications of the area indicated by the white dashed square (right panels) as indicated. (B) MiD49–GFP (green) and mCherry–Mff colocalize in foci at mitochondria (blue). Overview image and magnifications are shown as described in A. (C) MiD51–GFP (green) and RFP–Drp1 colocalize in foci at mitochondria (blue). Overview image and magnifications are shown as described in A. Outlines of mitochondria are indicated by white lines in the magnified views. (D) Quantitative analysis of colocalizing (light gray) versus individual (dark gray) foci for the GFP and RFP and/or mCherry constructs (as indicated per panel on the x-axis). Total foci counts for cells expressing the following constructs: 91, MiD51–GFP and MiD49–mCherry; 80, MiD51–GFP and mCherry–Mff; 144, MiD51–mCherry and RFP–Drp1. (E) Fluorescence Resonance Energy Transfer (FRET) efficiencies between various fission proteins as detected and analyzed using acceptor photobleaching (see Materials and Methods). Combinations used were (from left to right): MiD51–GFP and mCherry–Mff; GFP–Mff and mCherry–Mff; MiD51–GFP and MiD51–mCherry; GFP–Mff and RFP–Drp1; MiD51–GFP and RFP–Drp1; GFP–Drp1 and RFP–Drp1; GFP–Fis1 and RFP–Drp1. The highest signals were detected for MiD51–MiD51, Drp1–Drp1 and MiD51–Drp1 interactions. Error bars represent mean±s.e.m. Scale bars: 10 µm (A–C, overview images); 1 µm (A–C, magnification images).
Colocalization and interaction of fission proteins in the same foci at mitochondria
Hatch and colleagues have noted the potential existence of several independent fission mechanisms in mammalian cells (Hatch et al., 2014). As MiD49, MiD51 and Mff have been separately observed at mitochondrial fission sites, we asked whether these proteins colocalize at mitochondria and are therefore part of the same fission machinery. Using confocal microscopy we were indeed able to observe the presence of MiD51 and the splice isoform 1 of Mff (hereafter always referred to as Mff) (Fig. 3A), as well as MiD49 and Mff (Fig. 3B), within the same foci at mitochondria. To gain further insight into the presence and interplay of the different fission proteins in a single fission event, we assessed the colocalization of different combinations of fission proteins within foci. As can be seen, MiD51 in most cases (90–98%) was found in foci with a partner protein (MiD49, Mff or Drp1; Fig. 3D). Likewise, Drp1 almost always colocalized with MiD51 (99%). By contrast, ∼60% of Mff foci had MiD51 as a partner. As an additional indicator of protein–protein interactions between different fission proteins, we used Foerster Resonance Energy Transfer (FRET) analysis of donor de-quenching upon acceptor photobleaching (Fig. 3E). We observed interactions between the investigated fission proteins MiD51, Mff and Drp1, and the strongest signals of interaction were detected for MiD51–Drp1, Drp1–Drp1 and MiD51–MiD51. Under the conditions used here, we did not observe a FRET signal for Fis1–Drp1. This is consistent with recent data indicating that Fis1 is not required for mitochondrial fission (Otera et al., 2010) and that it might instead be involved in mitophagy (Shen et al., 2014). However, we cannot exclude the possibility of a transient interaction that is too short-lived to be detected by using FRET.
Mitochondrial fission occurs at MiD foci at mitochondria–ER contact sites
Although MiD49, MiD51 and the ER have been independently shown to be involved in mitochondrial fission, details about how they act together in time and space to drive mitochondrial fission are still missing. To shed light on the possible interplay between these proteins during fission, we used live-cell confocal fluorescence microscopy to image mitochondrial fission events at MiD foci in relation to the ER tubules (supplementary material Movies 4, 5). Fig. 2D shows the simultaneous presence of ER tubules (red) and MiD proteins (green) at a mitochondrial constriction site (arrowhead). The same constriction site subsequently underwent mitochondrial fission (Fig. 4A, arrowhead; supplementary material Movie 4), and ER tubules were present throughout the complete fission process and connected the two daughter organelles after the fission process had been completed. By contrast, Fig. 4B and supplementary material Movie 6 show a mitochondrion undergoing constriction at sites of MiD51–ER contacts, which is followed by a subsequent relaxation of the constriction rather than the final fission event. The live-cell imaging experiments also showed that ER contacts at MiD foci were not limited to mitochondrial constriction sites (Fig. 4B,C, white arrowheads) but that mitochondrial constriction could subsequently occur at these foci (Fig. 4B,C, yellow arrowheads, supplementary material Movies 6, 7). In fact, less than 40% of observed ER–mitochondria contacts at MiD foci (ncells=5) were located at constriction sites. Upon single- and double-knockdown of MiD49 and/or MiD51 (Palmer et al., 2011), constriction sites were still observed (Fig. 5A,B; supplementary material Fig. S2); however, the number of constriction sites was only significantly reduced upon double-knockdown (Fig. 5B; supplementary material Table S2, P<0.05).
Fig. 4.

Constriction and fission events at MiD51–GFP ER contact sites. (A) Time-lapse imaging of the constriction site (white arrowhead) shown in Fig. 2D. The mitochondrion (stained with MitoTracker Deep Red; blue) divides at the MiD51–GFP foci constriction site. After the scission event, both daughter organelles remain connected by the ER tubule (expressing mCherry-KDEL, red). (B) MiD51–GFP ER constriction sites do not necessarily undergo fission, but the constriction event (center image, yellow arrowhead) can be reversed (right image, white arrowhead). (C) MiD foci at sites of ER contact are not limited to mitochondrial constriction sites (white arrowheads) but can then subsequently lead to mitochondrial constriction (right image, yellow arrowhead). Scale bars: 4 μm (A, left panel of C); 2 μm (B, right panels of C). Times relate to the commencement of observations.
Fig. 5.
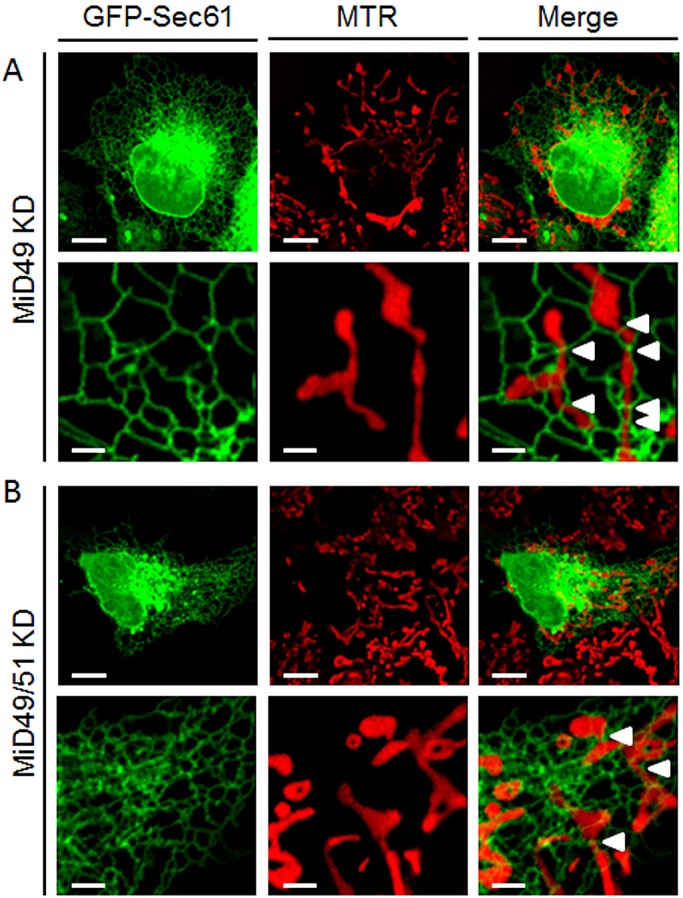
Mitochondrial constriction sites can be observed upon MiD49 single-, and MiD49 and MiD51 double-knockdown but appear to be reduced in MiD49 and MiD51 double-knockdown cells. Mitochondria were stained with MitoTracker Red (MTR; red), and ER was stained with GFP–Sec61. White arrowheads indicate mitochondrial constriction at sites of contact with the ER. (A) Representative image of a COS-7 cell following knockdown (KD) of MiD49. (B) Representative image of a COS-7 cell following MiD49 and MiD51 double-knockdown (MiD49/51 KD). The number of mitochondrial constriction sites (arrowheads) was reduced upon double-knockdown of MiD49 and MiD51 (see supplementary material Table S2). In both panels, the upper row shows overview images, and the bottom row shows magnification images. Scale bars: 10 µm (overview images); 2 µm (magnification images).
Correlative cryogenic fluorescence microscopy and soft x-ray tomography reveals short ER extensions that contact mitochondria at MiD foci
To characterize the MiD-specific structure of ER–mitochondria contact sites in three dimensions with high spatial resolution, we used correlated CFM–SXT analyses. SXT analysis of specimens that had been mounted in thin glass capillaries with a diameter of less than 15 µm and a wall thickness of <500 nm yields three-dimensional (3D) reconstructions with isotropic resolution (McDermott et al., 2012; Parkinson et al., 2013; Cinquin et al., 2014). Therefore, small suspension cells, such as the viral (v)-Abl-transformed lymphoma mouse B-cell line that we used for these experiments, are quite suitable for this approach. In order to demonstrate that MiD proteins remain functional in these cells, we verified that MiD proteins form foci (supplementary material Fig. S3A,B) and recruit Drp1 to mitochondria (supplementary material Fig. S3C,D). In order to perform CFM–SXT analyses, transfected cells were loaded in glass capillaries and then sequentially imaged, first in the brightfield and fluorescence channels using cryogenic spinning disk microscopy, followed by SXT. A diagram of the workflow is shown in supplementary material Fig. S4. This correlative technique allowed us to identify the presence of short extensions protruding from ER sheets at ER–mitochondria contact sites that contained MiD51–GFP foci. A representative slice generated using CFM–SXT, the SXT-generated slice without the fluorescence overlay and a magnification of the area exhibiting MiD51–GFP fluorescence are shown in Fig. 6. Several short ER extensions that protrude from the ER sheet and connect it to the mitochondrion can be distinguished in two dimensions (Fig. 6C, white arrowheads; Fig. 7D). To characterize these features in three dimensions, SXT tomograms were segmented into different subcellular compartments (Fig. 6D–F). A representative segmented ER–mitochondrion contact site also exhibiting MiD51-GFP fluorescence was identified from within the 3D reconstruction (Fig. 6G) and is shown in detail in Fig. 6H. On average, ER extensions exhibited a length of 168±13 nm (mean±s.e.m.) and are therefore below the resolution limit of conventional confocal fluorescence microscopy, but are resolved well by using SXT analysis, which has a 50-nm (isotropic) spatial resolution using the x-ray optics and tomographic data collection protocol used in this study (McDermott et al., 2012; Parkinson et al., 2013; Cinquin et al., 2014). Fig. 7 shows four correlative 2D CFT-SXT slices taken from different planes within the cell and an enlargement of regions showing a high intensity of local MiD51–GFP fluorescence. Consistent with the data shown in Fig. 6, all the magnified views in Fig. 7D show the presence of MiD51–GFP where ER extensions contact mitochondria.
Fig. 6.

CFM–SXT analysis reveals short ER extensions that contact mitochondria at MiD foci. (A) Two-dimensional computer-generated slice from a reconstruction of a mouse lymphoblastoid cell expressing MiD51–GFP (green), generated using correlated CFM–SXT. (B) The same computer-generated slice from the SXT reconstruction as presented in A without fluorescence overlay. The orange rectangle outlines the area of concentrated MiD51–GFP fluorescence. (C) Magnification of the area shown in A and B containing a concentration of MiD51–GFP. White arrowheads indicate positions of ER–mitochondria contact sites. (D) Maximum intensity projection of the full 3D SXT reconstruction with the contrast reversed so that features that are low-absorbing are shaded black and features that are highly absorbent are shaded white. (E) ER (green) and mitochondria (red) segmented out and overlaid with the reconstruction. (F) Surface-rendering of segmented cellular features, including the nucleus (orange), lipid droplets (blue), ER (green) and mitochondria (red). (G) Three-dimensional cutaway of the SXT-generated reconstruction reveals the same 3D location of the MiD51–GFP fluorescence of that shown in A. (H) Detailed view of small ER extensions contacting the mitochondria at the MiD51 foci. Scale bars: 2 µm (A,B,D–F); 400 nm (C); 1 µm (H).
Fig. 7.

CFM–SXT reveals foci of MiD51–GFP fluorescence at several ER–mitochondria contact sites. (A) Fluorescence confocal slice, (B) virtual section of the SXT-generated reconstruction, and (C) correlative CFM–SXT overlay are shown at four different planes, or virtual sections, within the cell volume. (D) The rightmost panels show magnifications of the boxed areas in C, which indicate ER–mitochondria contact sites that overlap with MiD51–GFP fluorescence foci (white arrowheads). Scale bars: 2 µm (A–C).
SXT LAC values of ER and mitochondria reflect mitochondrial morphology
SXT analysis provides quantitative information on the density of the biomolecules present in subcellular structures (Hanssen et al., 2012) in the form of the linear absorption coefficient (LAC) value that is associated with each voxel. Different LAC values are typically represented as different grey values in the final SXT reconstruction. Soft x-ray tomograms were segmented for mitochondria and ER (Fig. 8A,B) to assess mitochondrial morphology, as well as mitochondrial and ER LAC values (see Materials and Methods). We found that the LAC values of mitochondria decreased upon overexpression of MiD and that the mitochondrial network underwent subsequent fragmentation, compared with untransfected control cells (a two-tailed, unequal variance t-test results in Pmito=0.023) (Fig. 8C). The cell shown in Fig. 8A is representative for all cells within the red-boxed area in Fig. 8D, which showed a fragmented mitochondrial network, whereas the cell in Fig. 8B is representative for all the cells within the green-boxed area in Fig. 8D, which showed a normal mitochondrial network.
Fig. 8.
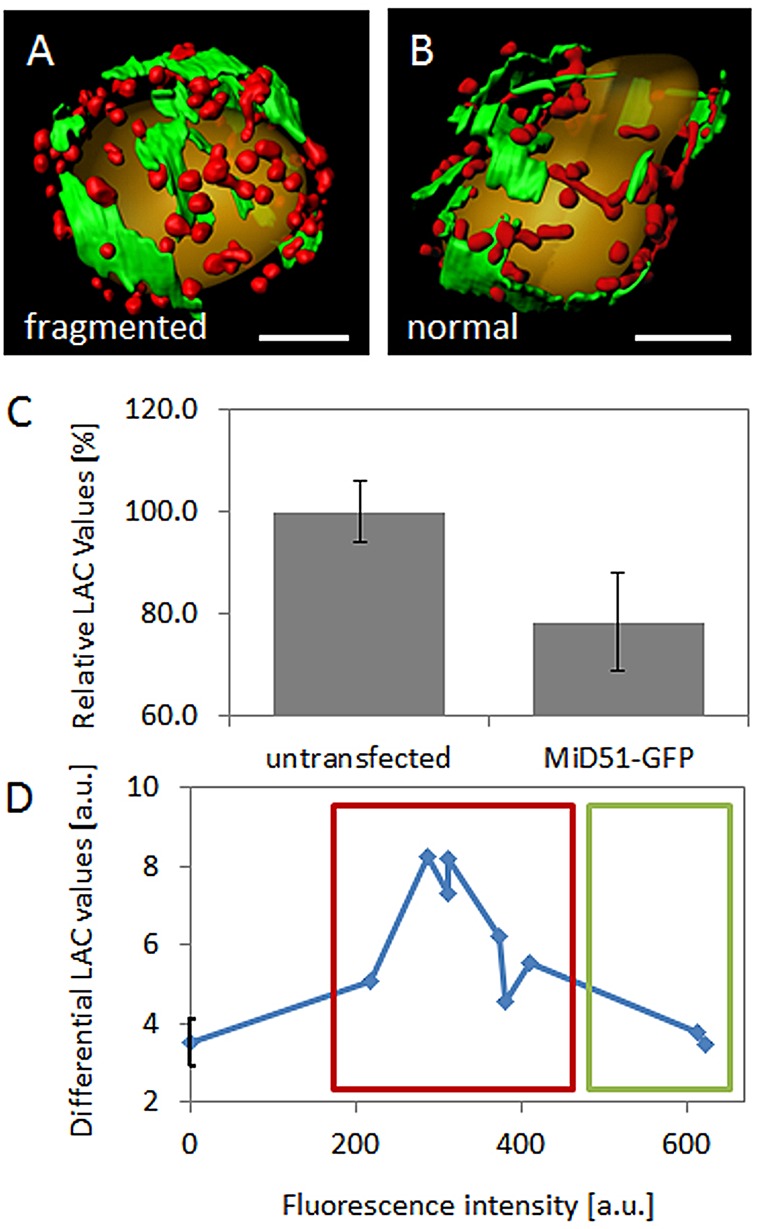
SXT LAC values change upon MiD51-GFP overexpression. (A,B) Three-dimensional surface-rendering of SXT segmentations showing a fragmented (A) and a normal (B) mitochondrial network. (C) The relative SXT LAC values of mitochondria decrease upon MiD51–GFP overexpression. For calculation of the relative LAC values, the absolute LAC mean values of ER and mitochondria in control cells were set to 100% and used for normalization. Error bars represent mean±s.e.m. (D) The difference between the LAC values of the ER and mitochondria changed with the level of MiD51–GFP expression, concomitant with mitochondrial morphology changes. Differential LAC values increased at very low expression levels and consequent fragmentation of the mitochondrial network (red-boxed area and panel A) and decreased upon slightly higher expression levels, as the mitochondrial network returns to normal (green-boxed area and panel B). The fluorescence intensity in D represents the mean fluorescence intensity of MiD51–GFP as determined in each foci and averaged per cell. The fluorescence intensity per foci was chosen rather than per cell to account for differently sized cells and the different numbers of foci per cell. Scale bars: 3 µm (A,B).
For CFM–SXT, all cells were sorted for low levels of MiD51–GFP fluorescence. Therefore, SXT experiments were exclusively performed on cells that showed either the fragmented phenotype at very low expression levels or the normal phenotype observed at slightly higher expression levels (the corresponding timepoints in Fig. 1A are 10 min and 15 min, respectively). Interestingly, we found that changes in differential LAC values resulting from the intensity of MiD51–GFP fluorescence also correlated with dramatic changes in mitochondrial morphology because networks appeared fragmented in cells that exhibited higher differential LAC values (Fig. 8A and red rectangle in Fig. 8D) and normal in cells that exhibited lower differential LAC values (Fig. 8B and green rectangle in Fig. 8D). In fragmented cells, MiD–ER contacts could be observed; however, owing to the typically spherical shape of fragmented mitochondria, no constriction sites were observed.
DISCUSSION
Interplay of fission components at ER–mitochondria division foci
In this work, we provide evidence that both Mff and MiD proteins can associate and colocalize with Drp1 at ER–mitochondria division foci. Therefore, we conclude that these proteins are part of the same fission machinery. The results of the colocalization and FRET analyses that we present here demonstrate that interactions occur between all of the investigated fission proteins. Both colocalization and FRET analyses indicated that the highest levels of interaction occurred between MiD51 and Drp1, whereas Mff showed a lower degree of correlation with MiD51. It has been previously shown that Mff can still form foci in cells that have been depleted of Drp1 (Otera et al., 2010; Friedman et al., 2011), consistent with previous reports that Mff forms mitochondrial constrictions with the ER independently of Drp1 (Friedman et al., 2011). In contrast to the findings pertaining to Mff, we have recently shown that MiD proteins require the presence of Drp1 in order to associate within foci (Richter et al., 2014). Our data suggests that Mff functions upstream of MiD proteins, potentially by aiding the formation of constriction sites before recruitment of Drp1 and MiD proteins, which then execute fission. These results are consistent with a recent study showing that MiD49 enhances the ability of Drp1 to execute constriction (Koirala et al., 2013). We also found that MiD foci can undergo several constriction and relaxation cycles before the final fission event (Fig. 2B; supplementary material Movie 2). This cycling might be due to partial assembly of the fission machinery at this stage or the requirement of other signaling events, including post-translational activation of Drp1 (Elgass et al., 2013; Arasaki et al., 2015), the involvement of other components of the fission machinery (Hatch et al., 2014) or the binding of co-factors to MiD proteins (Loson et al., 2014; Richter et al., 2014). The exact signal for this awaits further analysis.
The nature of short ER extensions
In previous studies, both ER and actin have been shown to contact mitochondria at fission sites (Friedman et al., 2011; Korobova et al., 2013, 2014). Similar to the electron-dense tethers that have been described by using electron microscopy tomography (Rowland and Voeltz, 2012), by using SXT, we observed short, 80-nm diameter extensions that connected the ER to the mitochondrial membrane. ER sheets and tubules have been reported to exhibit a thickness of approximately 60–100 nm (Puhka et al., 2007), suggesting that the features we observed are derived from ER rather than actin. Individual actin fibers have been reported to be much thinner (7–10 nm) (Osborn et al., 1977). However, it cannot be fully excluded that we observed very thick, or highly absorbent actin bundles, because it has been suggested that actin polymerization and/or myosin-II-driven condensation of individual fibers into compact ring structures have a role in mitochondrial fission (Hatch et al., 2014; Korobova et al., 2014).
Reduced mitochondrial LAC values in cells with fragmented mitochondrial morphology
CFT-SXT analysis showed that mitochondrial LAC values decreased upon overexpression of MiD proteins. The LAC value in a SXT-generated reconstruction reflects the amount of soft x-ray absorption that occurs in that voxel of the specimen, and therefore the density of carbon and nitrogen (Hanssen et al., 2012). Because ER and mitochondria comprise lipids and proteins, changes in LAC values reflect changes to concentrations of either lipids or proteins, or both. The observed reduction of the overall LAC value for mitochondria upon low levels of MiD overexpression correlates with a change in the overall mitochondrial morphology, from normal to fragmented; the spherical shape of fragmented mitochondria indicates the loss of constriction sites and, therewith, the loss of protein-dense areas.
Both ER and mitochondrial LAC values decreased upon mitochondrial fragmentation, but the ER LAC changes were more prominent. This implies that mitochondrial fragmentation affects the connection between the ER and mitochondria not only with respect to contact sites but, potentially, also with respect to communication and component exchange between the two organelles. Our results therefore suggest that the role of ER–mitochondria contacts in the regulation of mitochondrial morphology is not limited to ER-tubule-mediated constriction of mitochondria before fission events. Either fragmentation of mitochondria in general or MiD overexpression specifically appears to decouple or otherwise hinder ER–mitochondria exchange, which is re-established upon restoration of normal mitochondrial morphology.
Potential use of CFM–SXT to study intracellular changes throughout the cell
CFM–SXT enables the observation of effects that are due to protein overexpression throughout the cell, not only with respect to morphology but also to the composition of various subcellular compartments, along with variations between those compartments, as demonstrated by the differential LAC values of ER and mitochondria in our experiments. Compared with confocal fluorescence microscopy and the super-resolution techniques that have been developed recently, such as photo-activated localization microscopy (PALM) and stochastic optical reconstruction microscopy (STORM) (Sengupta et al., 2012, 2014; Hensel et al., 2013), CFM–SXT accesses a variety of subcellular compartments simultaneously with higher resolution than confocal microscopy, but in the same range as most super-resolution techniques, and without the need for additional staining – apart from that of the protein of interest. Compared with correlative electron microscopy, whole cells can be imaged within several minutes without the need to cut thin slices and to subsequently stitch together the individually recorded images. Additionally, no artificial enhancement of contrast is necessary thanks to the naturally high contrast of soft x-ray imaging in the water window, where water has an inherently low x-ray absorption. CFM–SXT therefore represents a highly useful technique for intracellular imaging. The LAC data from our correlative experiments also demonstrate the potential use of CFM–SXT to assess – with high accuracy – subcellular changes that result from minor changes in protein expression levels, without additional labelling.
MATERIALS AND METHODS
Plasmids and reagents
MiD49–GFP, MiD51–GFP, GFP–Drp1 and RNA interference constructs have been described previously (Palmer et al., 2011). GFP–Fis1 has also been described previously (Stojanovski et al., 2004). GFP–Sec61, GFP–Mff (isoform 1), mCherry–Sec61 and mCherry-KDEL were a kind gift from Gia Voeltz (University of Colorado, Boulder, CO). mCherry–Mff, MiD51–mCherry and MiD49–mCherry were cloned from the respective GFP constructs by removing GFP from the vector and replacing it with the mCherry sequence. Red fluorescent protein (RFP)-tagged Drp1 (RFP–Drp1) was cloned using the same approach. Commercial antibodies used were against cytochrome c (BD Pharmingen) and suitable secondary antibodies conjugated to AlexaFluor 647 (Invitrogen).
Cell culture, transfections and treatments
COS-7 cells were grown as previously described (Palmer et al., 2011), and transfections were performed using Lipofectamine 2000 (Invitrogen) according to the manufacturer's instructions. Cells were incubated with 50 nM MitoTracker Red CMXRos (Molecular Probes) or 50 nM MitoTracker Deep Red (Molecular Probes). Single- and double-knockdown was performed as previously described (Palmer et al., 2011).
A female mouse v-Abl-transformed lymphoma B-cell line was provided by Barbara Panning (University of California, San Francisco, CA) (D'Andrea et al., 1987). The cell line was maintained in RPMI 1640 medium (GIBCO, Invitrogen, Life Technologies, Grand Island, NY) that had been supplemented with 10% fetal bovine serum (FBS; American Type Culture Collection, Manassas, VA). Cells were grown in vented polystyrene tissue-culture flasks (Corning Incorporated Life Sciences, Tewksbury, MA) in a humidified cell culture incubator at 37°C under 5% CO2. For transfection of the lymphoblastoid cell line, 107 cells were spun down and resuspended in 360 µl ‘intracellular’ electroporation buffer (ICEB) (Harkin and Hay, 1996). MiD51-GFP plasmid (20 µg) was added, followed by incubation for 10 min at room temperature. Then cells were electroporated (BioRad Gene Pulser II Electroporation System, BioRad Life Sciences, Hercules, CA) with a single pulse (300 V, 975 µF, τ=25-30 ms). Subsequently cells were resuspended in 20 ml of fresh medium (37°C) and grown overnight before further processing (see section Cell preparation for SXT).
Live-cell microscopy
Confocal microscopy was performed with a Zeiss confocal microscope equipped with a ConfoCor 3 system containing avalanche photodiode detectors using a 40× oil immersion objective or a Zeiss AxioObserver Spinning Disk microscope using a 63× objective. Cells were sustained in Dulbecco's modified Eagle's medium (DMEM; GIBCO, Invitrogen, Life Technologies) with 5% FBS at 37°C and 5% CO2.
FRET analysis
FRET detection and analysis was performed using acceptor photobleaching experiments (Shrestha et al., 2015). GFP and RFP and/or mCherry constructs of the respective fission proteins were co-transfected into cells. Fluorescence images of the donor and acceptor were recorded before and after photobleaching of the acceptor. FRET efficiency, E, was calculated from the degree of donor de-quenching according to E=1−(IDA/ID)×100 with IDA being the intensity of fluorescence before photobleaching, and ID being the intensity of fluorescence after photobleaching.
Cell preparation for soft X-ray tomography
Electroporated cells were pelleted by centrifuging (400 g, 5 min), resuspended in Leibovitz's L-15 growth medium (GIBCO) that had been supplemented with 10% FBS. Cells exhibiting MiD51–GFP foci were separated from non-transfected cells, cellular debris and overexpressing cells using fluorescence-activated cell sorting (FACS; BD FACSAria, BD Biosciences, San Jose, CA) by gating for cells with low levels of fluorescence (Palmer et al., 2011). Cells were sorted directly into L-15 growth medium, which limited their residence time in FACS sheath fluid (PBS). Cells that had been sorted were pelleted by centrifuging (400 g, 5 min) and most of the supernatant was removed in order to increase the cell density. Cells were then pipetted into custom-made glass capillaries (Parkinson et al., 2013; Smith et al., 2014a) before vitrification by plunging the tip of the specimen capillary into a ∼90-K reservoir of liquid propane at ∼2 m s−1 using a device that had been made in-house, as described previously (Smith et al., 2014a).
Cryogenic confocal fluorescence microscopy
Vitrified lymphoblastoids were imaged using a cryogenic brightfield and confocal fluorescence microscope. The body of the microscope was custom-built to image specimens mounted in the tip of a glass capillary through a ∼90-K reservoir of propane. The microscope uses a commercially-available spinning disk confocal head (CSU-X1, Yokogawa, Tokyo, Japan) and acousto-optical tuneable filter-controlled laser system (Andor Laser Combiner, Model LC-501A). A more detailed description of this instrument can be found in Smith et al. (2014a). GFP was excited with a laser at 491 nm and imaged onto an EMCCD camera (iXon DV887ECS-BV, Andor Technologies, Belfast, UK) using a 525/50 emission filter (Chroma Technology Corp., Bellows Falls, VT). Confocal ‘z-stacks’ of the specimen were taken as the precision-encoded piezo flexure specimen stage (Physik Instrumente, Irvine, CA) was translated through the focal plane of the microscope in 0.75-µm steps.
Soft X-ray tomography
The cryogenic soft x-ray microscope XM-2, located at the National Center for X-ray Tomography (http://ncxt.lbl.gov) at the Advanced Light Source (Berkeley, CA) was used to collect the SXT data. During data collection, specimens were kept in a stream of liquid-nitrogen-cooled helium gas to maintain their cryopreservation and to mitigate radiation damage. Cells of interest were chosen from the fluorescence images recorded in the previous step; these were cells showing the formation of MiD51–GFP foci. A full angular tilt series was taken of each specimen of interest (180 projection images with 1° of rotation between each image). Each image used 150- to 200-ms exposure times, depending on the thickness of the specimen. Three-dimensional reconstructions were calculated from the tomographic tilt series after manual alignment of the projection images by tracking fiducial markers using the IMOD software (Kremer et al., 1996). Iterative tomographic reconstructions were calculated using methods published previously (Stayman and Fessler, 2004a,b; Mastronarde, 2005; Parkinson et al., 2012); LAC values were determined as in described previously (Weiss et al., 2000).
Image processing and analysis
All images were processed using Fiji, Zeiss ZEN lite 2011 (blue edition), Amira (FEI) or Imaris imaging software (Bitplane AG). Soft x-ray reconstructions were segmented into different subcellular compartments (lipid droplets, mitochondria and ER) using the Imaris software (Bitplane AG) ‘Surface’ module to choose different gray level ranges, each of which represents a different subcellular compartment. Segmentation of the nucleus was performed manually. LAC values for mitochondria and ER, respectively, are defined as the mean LAC inside the respective surfaces. The two 3D datasets – a fluorescence confocal z-stack and an SXT reconstruction – from the same vitrified cell were overlayed in silico, giving the distribution of MiD51–GFP within the context of the complete 3D cellular ultrastructure of the cells. Alignment of the cryogenic fluorescence and SXT datasets was performed manually using Amira's Multi Planar Viewer module (Version 5.3, Amira, Visage Imaging, San Diego, CA). ER–mitochondria contact sites in MiD single- and double-knockdown cells were detected using the Imaris ‘Colocalization’ module to build an independent colocalization channel (supplementary material Fig. S4). ER–mitochondria contact sites and constriction sites were counted on images of five individual cells per condition. Constriction sites were defined as positions of lower local mitochondrial diameter (Fig. 5A,B, magnification panels, white arrows).
Fission events were counted on individual 5-min subsets from the complete long-term time-lapse series. From the recorded 2D image, whole cells were chosen as the region of interest. The number of mitochondria per cell was obtained using the Imaris ‘Surface’ module by thresholding for MitoTracker Red or cytochrome c signal and counting the number of detected surfaces in the selected region of interest.
Supplementary Material
Acknowledgements
We thank Professor Barbara Panning (University of California, San Francisco Biochemistry and Biophysics, San Francisco, CA) for providing the mouse v-Abl-transformed lymphoma cell line; Gia Voeltz for providing the ER marker plasmids; and Laura Osellame, Abeer Singh and Catherine Palmer for advice and reagents.
Footnotes
Competing interests
The authors declare no competing or financial interests.
Author contributions
K.D.E. prepared samples for and performed all confocal experiments. K.D.E. and E.A.S. prepared samples for and performed all CFM–SXT experiments. All authors interpreted the results and wrote the manuscript.
Funding
This work was supported with funds from the ARC Centre of Excellence for Coherent X-ray Science (CXS) and the National Health and Medical Research Council [grant number 1049968 to M.T.R.]. The National Center for X-ray Tomography is supported by the National Institute of General Medical Sciences of the National Institutes of Health [grant number P41GM103445 to C.A.L.]; and the US Department of Energy, Office of Biological and Environmental Research [grant number DE-AC02-05CH11231 to C.A.L.]. C.A.L., M.A.L. and E.A.S. are supported by the Gordon and Betty Moore Foundation [grant number 3497 to C.A.L.]. Deposited in PMC for release after 12 months.
Supplementary material
Supplementary material available online at http://jcs.biologists.org/lookup/suppl/doi:10.1242/jcs.169136/-/DC1
References
- Arasaki K., Shimizu H., Mogari H., Nishida N., Hirota N., Furuno A., Kudo Y., Baba M., Baba N., Cheng J. et al. (2015). A role for the ancient SNARE syntaxin 17 in regulating mitochondrial division. Dev. Cell 32, 304-317. 10.1016/j.devcel.2014.12.011 [DOI] [PubMed] [Google Scholar]
- Arduino D. M., Esteves A. R. and Cardoso S. M. (2011). Mitochondrial fusion/fission, transport and autophagy in Parkinson's disease: when mitochondria get nasty. Parkinsons Dis. 2011, 767230 10.4061/2011/767230 [DOI] [PMC free article] [PubMed] [Google Scholar]
- Campello S. and Scorrano L. (2010). Mitochondrial shape changes: orchestrating cell pathophysiology. EMBO Rep. 11, 678-684. 10.1038/embor.2010.115 [DOI] [PMC free article] [PubMed] [Google Scholar]
- Cinquin B. P., Do M., McDermott G., Walters A. D., Myllys M., Smith E. A., Cohen-Fix O., Le Gros M. A. and Larabell C. A. (2014). Putting molecules in their place. J. Cell. Biochem. 115, 209-216. 10.1002/jcb.24658 [DOI] [PMC free article] [PubMed] [Google Scholar]
- D'Andrea E., Saggioro D., Fleissner E. and Chieco-Bianchi L. (1987). Abelson murine leukemia virus-induced thymic lymphomas: transformation of a primitive lymphoid precursor. J. Natl. Cancer Inst. 79, 189-195. [PubMed] [Google Scholar]
- de Brito O. M. and Scorrano L. (2008). Mitofusin 2 tethers endoplasmic reticulum to mitochondria. Nature 456, 605-610. 10.1038/nature07534 [DOI] [PubMed] [Google Scholar]
- de Brito O. M. and Scorrano L. (2010). An intimate liaison: spatial organization of the endoplasmic reticulum-mitochondria relationship. EMBO J. 29, 2715-2723. 10.1038/emboj.2010.177 [DOI] [PMC free article] [PubMed] [Google Scholar]
- De Vos K. J., Allan V. J., Grierson A. J. and Sheetz M. P. (2005). Mitochondrial function and actin regulate dynamin-related protein 1-dependent mitochondrial fission. Curr. Biol. 15, 678-683. 10.1016/j.cub.2005.02.064 [DOI] [PubMed] [Google Scholar]
- Elgass K., Pakay J., Ryan M. T. and Palmer C. S. (2013). Recent advances into the understanding of mitochondrial fission. Biochim. Biophys. Acta 1833, 150-161. 10.1016/j.bbamcr.2012.05.002 [DOI] [PubMed] [Google Scholar]
- Friedman J. R. and Nunnari J. (2014). Mitochondrial form and function. Nature 505, 335-343. 10.1038/nature12985 [DOI] [PMC free article] [PubMed] [Google Scholar]
- Friedman J. R., Lackner L. L., West M., DiBenedetto J. R., Nunnari J. and Voeltz G. K. (2011). ER tubules mark sites of mitochondrial division. Science 334, 358-362. 10.1126/science.1207385 [DOI] [PMC free article] [PubMed] [Google Scholar]
- Gandre-Babbe S. and van der Bliek A. M. (2008). The novel tail-anchored membrane protein Mff controls mitochondrial and peroxisomal fission in mammalian cells. Mol. Biol. Cell 19, 2402-2412. 10.1091/mbc.E07-12-1287 [DOI] [PMC free article] [PubMed] [Google Scholar]
- Glauser L., Sonnay S., Stafa K. and Moore D. J. (2011). Parkin promotes the ubiquitination and degradation of the mitochondrial fusion factor mitofusin 1. J. Neurochem. 118, 636-645. 10.1111/j.1471-4159.2011.07318.x [DOI] [PubMed] [Google Scholar]
- Hanssen E., Knoechel C., Dearnley M., Dixon M. W. A., Le Gros M., Larabell C. and Tilley L. (2012). Soft X-ray microscopy analysis of cell volume and hemoglobin content in erythrocytes infected with asexual and sexual stages of Plasmodium falciparum. J. Struct. Biol. 177, 224-232. 10.1016/j.jsb.2011.09.003 [DOI] [PMC free article] [PubMed] [Google Scholar]
- Harkin D. G. and Hay E. D. (1996). Effects of electroporation on the tubulin cytoskeleton and directed migration of corneal fibroblasts cultured within collagen matrices. Cell Motil. Cytoskeleton 35, 345-357. 10.1002/(SICI)1097-0169(1996)35:4<345::AID-CM6>3.0.CO;2-5 [DOI] [PubMed] [Google Scholar]
- Hatch A. L., Gurel P. S. and Higgs H. N. (2014). Novel roles for actin in mitochondrial fission. J. Cell Sci. 127, 4549-4560. 10.1242/jcs.153791 [DOI] [PMC free article] [PubMed] [Google Scholar]
- Hensel M., Klingauf J. and Piehler J. (2013). Imaging the invisible: resolving cellular microcompartments by superresolution microscopy techniques. Biol. Chem. 394, 1097-1113. 10.1515/hsz-2012-0324 [DOI] [PubMed] [Google Scholar]
- Ingerman E., Perkins E. M., Marino M., Mears J. A., McCaffery J. M., Hinshaw J. E. and Nunnari J. (2005). Dnm1 forms spirals that are structurally tailored to fit mitochondria. J. Cell Biol. 170, 1021-1027. 10.1083/jcb.200506078 [DOI] [PMC free article] [PubMed] [Google Scholar]
- Koirala S., Guo Q., Kalia R., Bui H. T., Eckert D. M., Frost A. and Shaw J. M. (2013). Interchangeable adaptors regulate mitochondrial dynamin assembly for membrane scission. Proc. Natl. Acad. Sci. USA 110, E1342-E1351. 10.1073/pnas.1300855110 [DOI] [PMC free article] [PubMed] [Google Scholar]
- Korobova F., Ramabhadran V. and Higgs H. N. (2013). An actin-dependent step in mitochondrial fission mediated by the ER-associated formin INF2. Science 339, 464-467. 10.1126/science.1228360 [DOI] [PMC free article] [PubMed] [Google Scholar]
- Korobova F., Gauvin T. J. and Higgs H. N. (2014). A role for myosin II in mammalian mitochondrial fission. Curr. Biol. 24, 409-414. 10.1016/j.cub.2013.12.032 [DOI] [PMC free article] [PubMed] [Google Scholar]
- Kremer J. R., Mastronarde D. N. and McIntosh J. R. (1996). Computer visualization of three-dimensional image data using IMOD. J. Struct. Biol. 116, 71-76. 10.1006/jsbi.1996.0013 [DOI] [PubMed] [Google Scholar]
- Labbe K., Murley A. and Nunnari J. (2014). Determinants and functions of mitochondrial behavior. Annu. Rev. Cell Dev. Biol. 30, 357-391. 10.1146/annurev-cellbio-101011-155756 [DOI] [PubMed] [Google Scholar]
- Lackner L. L. and Nunnari J. M. (2009). The molecular mechanism and cellular functions of mitochondrial division. Biochim. Biophys. Acta 1792, 1138-1144. 10.1016/j.bbadis.2008.11.011 [DOI] [PMC free article] [PubMed] [Google Scholar]
- Lackner L. L., Ping H., Graef M., Murley A. and Nunnari J. (2013). Endoplasmic reticulum-associated mitochondria-cortex tether functions in the distribution and inheritance of mitochondria. Proc. Natl. Acad. Sci. USA 110, E458-E467. 10.1073/pnas.1215232110 [DOI] [PMC free article] [PubMed] [Google Scholar]
- Larabell C. A. and Nugent K. A. (2010). Imaging cellular architecture with X-rays. Curr. Opin. Struct. Biol. 20, 623-631. 10.1016/j.sbi.2010.08.008 [DOI] [PMC free article] [PubMed] [Google Scholar]
- Legesse-Miller A., Massol R. H. and Kirchhausen T. (2003). Constriction and Dnm1p recruitment are distinct processes in mitochondrial fission. Mol. Biol. Cell 14, 1953-1963. 10.1091/mbc.E02-10-0657 [DOI] [PMC free article] [PubMed] [Google Scholar]
- Loson O. C., Song Z., Chen H. and Chan D. C. (2013). Fis1, Mff, MiD49, and MiD51 mediate Drp1 recruitment in mitochondrial fission. Mol. Biol. Cell 24, 659-667. 10.1091/mbc.E12-10-0721 [DOI] [PMC free article] [PubMed] [Google Scholar]
- Loson O. C., Liu R., Rome M. E., Meng S., Kaiser J. T., Shan S.-O. and Chan D. C. (2014). The mitochondrial fission receptor MiD51 requires ADP as a cofactor. Structure 22, 367-377. 10.1016/j.str.2014.01.001 [DOI] [PMC free article] [PubMed] [Google Scholar]
- Mastronarde D. N. (2005). Automated electron microscope tomography using robust prediction of specimen movements. J. Struct. Biol. 152, 36-51. 10.1016/j.jsb.2005.07.007 [DOI] [PubMed] [Google Scholar]
- McDermott G., Le Gros M. A. and Larabell C. A. (2012). Visualizing cell architecture and molecular location using soft x-ray tomography and correlated cryo-light microscopy. Annu. Rev. Phys. Chem. 63, 225-239. 10.1146/annurev-physchem-032511-143818 [DOI] [PMC free article] [PubMed] [Google Scholar]
- Mears J. A., Lackner L. L., Fang S., Ingerman E., Nunnari J. and Hinshaw J. E. (2011). Conformational changes in Dnm1 support a contractile mechanism for mitochondrial fission. Nat. Struct. Mol. Biol. 18, 20-26. 10.1038/nsmb.1949 [DOI] [PMC free article] [PubMed] [Google Scholar]
- Mishra P. and Chan D. C. (2014). Mitochondrial dynamics and inheritance during cell division, development and disease. Nat. Rev. Mol. Cell Biol. 15, 634-646. 10.1038/nrm3877 [DOI] [PMC free article] [PubMed] [Google Scholar]
- Murley A., Lackner L. L., Osman C., West M., Voeltz G. K., Walter P. and Nunnari J. (2013). ER-associated mitochondrial division links the distribution of mitochondria and mitochondrial DNA in yeast. Elife 2, e00422 10.7554/eLife.00422 [DOI] [PMC free article] [PubMed] [Google Scholar]
- Nakamura K., Nemani V. M., Azarbal F., Skibinski G., Levy J. M., Egami K., Munishkina L., Zhang J., Gardner B., Wakabayashi J. et al. (2011). Direct membrane association drives mitochondrial fission by the Parkinson disease-associated protein α-synuclein. J. Biol. Chem. 286, 20710-20726. 10.1074/jbc.M110.213538 [DOI] [PMC free article] [PubMed] [Google Scholar]
- Osborn M., Franke W. W. and Weber K. (1977). Visualization of a system of filaments 7-10 nm thick in cultured cells of an epithelioid line (Pt K2) by immunofluorescence microscopy. Proc. Natl. Acad. Sci. USA 74, 2490-2494. 10.1073/pnas.74.6.2490 [DOI] [PMC free article] [PubMed] [Google Scholar]
- Otera H. and Mihara K. (2011a). Molecular mechanisms and physiologic functions of mitochondrial dynamics. J. Biochem. 149, 241-251. 10.1093/jb/mvr002 [DOI] [PubMed] [Google Scholar]
- Otera H. and Mihara K. (2011b). Discovery of the membrane receptor for mitochondrial fission GTPase Drp1. Small GTPases 2, 167-172. 10.4161/sgtp.2.3.16486 [DOI] [PMC free article] [PubMed] [Google Scholar]
- Otera H., Wang C., Cleland M. M., Setoguchi K., Yokota S., Youle R. J. and Mihara K. (2010). Mff is an essential factor for mitochondrial recruitment of Drp1 during mitochondrial fission in mammalian cells. J. Cell Biol. 191, 1141-1158. 10.1083/jcb.201007152 [DOI] [PMC free article] [PubMed] [Google Scholar]
- Palmer C. S., Osellame L. D., Laine D., Koutsopoulos O. S., Frazier A. E. and Ryan M. T. (2011). MiD49 and MiD51, new components of the mitochondrial fission machinery. EMBO Rep. 12, 565-573. 10.1038/embor.2011.54 [DOI] [PMC free article] [PubMed] [Google Scholar]
- Palmer C. S., Elgass K. D., Parton R. G., Osellame L. D., Stojanovski D. and Ryan M. T. (2013). Adaptor proteins MiD49 and MiD51 can act independently of Mff and Fis1 in Drp1 recruitment and are specific for mitochondrial fission. J. Biol. Chem. 288, 27584-27593. 10.1074/jbc.M113.479873 [DOI] [PMC free article] [PubMed] [Google Scholar]
- Parkinson D. Y., Knoechel C., Yang C., Larabell C. A. and Le Gros M. A. (2012). Automatic alignment and reconstruction of images for soft X-ray tomography. J. Struct. Biol. 177, 259-266. 10.1016/j.jsb.2011.11.027 [DOI] [PMC free article] [PubMed] [Google Scholar]
- Parkinson D. Y., Epperly L. R., McDermott G., Le Gros M. A., Boudreau R. M. and Larabell C. A. (2013). Nanoimaging cells using soft X-ray tomography. Methods Mol. Biol. 950, 457-481. 10.1007/978-1-62703-137-0_25 [DOI] [PubMed] [Google Scholar]
- Parone P. A., Da Cruz S., Tondera D., Mattenberger Y., James D. I., Maechler P., Barja F. and Martinou J.-C. (2008). Preventing mitochondrial fission impairs mitochondrial function and leads to loss of mitochondrial DNA. PLoS ONE 3, e3257 10.1371/journal.pone.0003257 [DOI] [PMC free article] [PubMed] [Google Scholar]
- Puhka M., Vihinen H., Joensuu M. and Jokitalo E. (2007). Endoplasmic reticulum remains continuous and undergoes sheet-to-tubule transformation during cell division in mammalian cells. J. Cell Biol. 179, 895-909. 10.1083/jcb.200705112 [DOI] [PMC free article] [PubMed] [Google Scholar]
- Richter V., Palmer C. S., Osellame L. D., Singh A. P., Elgass K., Stroud D. A., Sesaki H., Kvansakul M. and Ryan M. T. (2014). Structural and functional analysis of MiD51, a dynamin receptor required for mitochondrial fission. J. Cell Biol. 204, 477-486. 10.1083/jcb.201311014 [DOI] [PMC free article] [PubMed] [Google Scholar]
- Rowland A. A. and Voeltz G. K. (2012). Endoplasmic reticulum-mitochondria contacts: function of the junction. Nat. Rev. Mol. Cell Biol. 13, 607-625. 10.1038/nrm3440 [DOI] [PMC free article] [PubMed] [Google Scholar]
- Ryan M. T. and Hoogenraad N. J. (2007). Mitochondrial-nuclear communications. Annu. Rev. Biochem. 76, 701-722. 10.1146/annurev.biochem.76.052305.091720 [DOI] [PubMed] [Google Scholar]
- Sengupta P., Van Engelenburg S. and Lippincott-Schwartz J. (2012). Visualizing cell structure and function with point-localization superresolution imaging. Dev. Cell 23, 1092-1102. 10.1016/j.devcel.2012.09.022 [DOI] [PMC free article] [PubMed] [Google Scholar]
- Sengupta P., van Engelenburg S. B. and Lippincott-Schwartz J. (2014). Superresolution imaging of biological systems using photoactivated localization microscopy. Chem. Rev. 114, 3189-3202. 10.1021/cr400614m [DOI] [PMC free article] [PubMed] [Google Scholar]
- Shen Q., Yamano K., Head B. P., Kawajiri S., Cheung J. T. M., Wang C., Cho J.-H., Hattori N., Youle R. J. and van der Bliek A. M. (2014). Mutations in Fis1 disrupt orderly disposal of defective mitochondria. Mol. Biol. Cell 25, 145-159. 10.1091/mbc.E13-09-0525 [DOI] [PMC free article] [PubMed] [Google Scholar]
- Shrestha D., Jenei A., Nagy P., Vereb G. and Szollosi J. (2015). Understanding FRET as a research tool for cellular studies. Int. J. Mol. Sci. 16, 6718-6756. 10.3390/ijms16046718 [DOI] [PMC free article] [PubMed] [Google Scholar]
- Smith E. A., Cinquin B. P., Do M., McDermott G., Le Gros M. A. and Larabell C. A. (2014a). Correlative cryogenic tomography of cells using light and soft x-rays. Ultramicroscopy 143, 33-40. 10.1016/j.ultramic.2013.10.013 [DOI] [PMC free article] [PubMed] [Google Scholar]
- Smith E. A., McDermott G., Do M., Leung K., Panning B., Le Gros M. A. and Larabell C. A. (2014b). Quantitatively imaging chromosomes by correlated cryo-fluorescence and soft x-ray tomographies. Biophys. J. 107, 1988-1996. 10.1016/j.bpj.2014.09.011 [DOI] [PMC free article] [PubMed] [Google Scholar]
- Song W., Chen J., Petrilli A., Liot G., Klinglmayr E., Zhou Y., Poquiz P., Tjong J., Pouladi M. A., Hayden M. R. et al. (2011). Mutant huntingtin binds the mitochondrial fission GTPase dynamin-related protein-1 and increases its enzymatic activity. Nat. Med. 17, 377-482. 10.1038/nm.2313 [DOI] [PMC free article] [PubMed] [Google Scholar]
- Stayman J. W. and Fessler J. A. (2004a). Efficient calculation of resolution and covariance for penalized-likelihood reconstruction in fully 3-D SPECT. IEEE Trans. Med. Imaging 23, 1543-1556. 10.1109/TMI.2004.837790 [DOI] [PubMed] [Google Scholar]
- Stayman J. W. and Fessler J. A. (2004b). Compensation for nonuniform resolution using penalized-likelihood reconstruction in space-variant imaging systems. IEEE Trans. Med. Imaging 23, 269-284. 10.1109/TMI.2003.823063 [DOI] [PubMed] [Google Scholar]
- Stojanovski D., Koutsopoulos O. S., Okamoto K. and Ryan M. T. (2004). Levels of human Fis1 at the mitochondrial outer membrane regulate mitochondrial morphology. J. Cell Sci. 117, 1201-1210. 10.1242/jcs.01058 [DOI] [PubMed] [Google Scholar]
- Szabadkai G., Simoni A. M., Chami M., Wieckowski M. R., Youle R. J. and Rizzuto R. (2004). Drp-1-dependent division of the mitochondrial network blocks intraorganellar Ca2+ waves and protects against Ca2+-mediated apoptosis. Mol. Cell 16, 59-68. 10.1016/j.molcel.2004.09.026 [DOI] [PubMed] [Google Scholar]
- Varadi A., Johnson-Cadwell L. I., Cirulli V., Yoon Y., Allan V. J. and Rutter G. A. (2004). Cytoplasmic dynein regulates the subcellular distribution of mitochondria by controlling the recruitment of the fission factor dynamin-related protein-1. J. Cell Sci. 117, 4389-4400. 10.1242/jcs.01299 [DOI] [PubMed] [Google Scholar]
- Weiss D., Schneider G., Niemann B., Guttmann P., Rudolph D. and Schmahl G. (2000). Computed tomography of cryogenic biological specimens based on X-ray microscopic images. Ultramicroscopy 84, 185-197. 10.1016/S0304-3991(00)00034-6 [DOI] [PubMed] [Google Scholar]
- Westermann B. (2010). Mitochondrial fusion and fission in cell life and death. Nat. Rev. Mol. Cell Biol. 11, 872-884. 10.1038/nrm3013 [DOI] [PubMed] [Google Scholar]
Associated Data
This section collects any data citations, data availability statements, or supplementary materials included in this article.