ABSTRACT
Hematopoietic lineage commitment is regulated by cytokines and master transcription factors, but it remains unclear how a progenitor cell chooses a lineage in the face of conflicting cues. Through transcript counting in megakaryocyte–erythroid progenitors undergoing erythropoiesis, we show that the expression levels of the pro-erythropoiesis transcription factor EKLF (also known as KLF1) and receptor EpoR are inversely correlated with their pro-megakaryopoiesis counterparts, FLI-1 and TpoR (also known as MPL). Notably, as progenitors commit to the erythrocyte lineage, EpoR is upregulated and TpoR is strongly downregulated, thus boosting the potency of the pro-erythropoiesis cue erythropoietin and effectively eliminating the activity of the pro-megakaryopoiesis cue thrombopoietin. Based on these findings, we propose a new model for exclusive decision making that explicitly incorporates signals from extrinsic cues, and we experimentally confirm a model prediction of temporal changes in transcript noise levels in committing progenitors. Our study suggests that lineage-specific receptor levels can modulate potencies of cues to achieve robust commitment decisions.
KEY WORDS: Conflicting cue, Hematopoiesis, Lineage commitment
Summary: Progenitor cells can make robust commitment decisions in the face of conflicting cues by modulating the expression levels of lineage-specific receptors.
INTRODUCTION
The mature cell lineages of blood arise from hematopoietic stem and progenitor cells, but a mechanistic understanding of the process by which these cells make discrete fate decisions in the face of noisy and conflicting signals remains elusive. Lineage commitment and differentiation of megakaryocyte–erythroid progenitor (MEP) cells into erythrocytes and megakaryocytes is tightly regulated by the pro-erythropoiesis cytokine erythropoietin (Epo) and transcription factor EKLF (also known as KLF1) (Borg et al., 2010; Nuez et al., 1995; Parkins et al., 1995; Siatecka and Bieker, 2011; Siatecka et al., 2007; Tallack et al., 2012), and the pro-megakaryopoiesis cytokine thrombopoietin (Tpo) and transcription factor FLI-1 (Bastian et al., 1999; Okada et al., 2011; Shivdasani, 2001). In addition to their pro-differentiation roles, EKLF and FLI-1 also inhibit opposing lineages (Siatecka and Bieker, 2011).
Recent studies have shown that cytokines can instruct lineage choice (Mossadegh-Keller et al., 2013; Rieger et al., 2009); hence, an extrinsic cue at the receptor level modulates decision making at the transcription factor level. This raises a crucial and unresolved question: once a progenitor cell has decided to commit to a particular lineage, how does it ensure that cytokines for an opposing lineage do not reverse or corrupt this decision? Here, we show that the erythrocyte lineage enforces exclusivity through upregulation of EKLF and its lineage-specific cytokine receptor (EpoR) while inhibiting both FLI-1 and the receptor TpoR (also known as MPL) for the opposing megakaryocyte lineage.
RESULTS
To understand how bipotent MEP cells process intrinsic and extrinsic cues and commit to the erythroid lineage, we performed experiments using the bipotent human cell line UT-7/GM (Komatsu et al., 1997). This offers an important advantage over primary cells because purification of progenitors from primary cells is imperfect and can erroneously result in the attribution of heterogeneity in receptor and transcription factor expression to noise intrinsic to the commitment system. By contrast, the reduced variability in synchronized populations from a model cell line enhances experimental reproducibility and facilitates quantitative analysis.
Epo-induced erythrocyte commitment is not reversible by treatment with Tpo
To study the impact of Tpo, a conflicting cue, on memory in erythrocyte lineage commitment, UT-7/GM cells maintained in medium containing granulocyte-macrophage colony-stimulating factor (GMCSF, also known as CSF2) were starved for 18 h, and passaged on day 0 into three different media: medium containing high levels of erythropoietin (Epo-only), high levels of Tpo (Tpo-only), or high levels of both Epo and Tpo (Epo+Tpo). On days 3 and 6, an aliquot of the Epo-only culture was passaged separately into the Epo+Tpo medium; hence, for these two cultures, a competing cytokine was added at different time points while the original inducing cue was kept constant. All cultures were assessed for erythrocyte differentiation by staining with o-dianisidine on day 14.
Epo-only cultures exhibited high proportions of staining, in contrast to the Tpo-only cultures. If both Epo and Tpo were present from day 0, the culture yielded an intermediate proportion of differentiation; this proportion rose if Tpo was not present in the starting culture but was introduced subsequently (Fig. 1). Hence, the later Tpo is introduced, the smaller its impact on erythrocyte differentiation, indicating that either cells in the starting population that are predisposed to the megakaryocyte lineage die because of the absence of a growth signal or virtually all cells in the starting population are driven to the erythrocyte lineage and somehow become unresponsive to Tpo. Regardless, commitment to the erythrocyte lineage is robust, and is not reversible by the introduction of a conflicting Tpo cue.
Fig. 1.
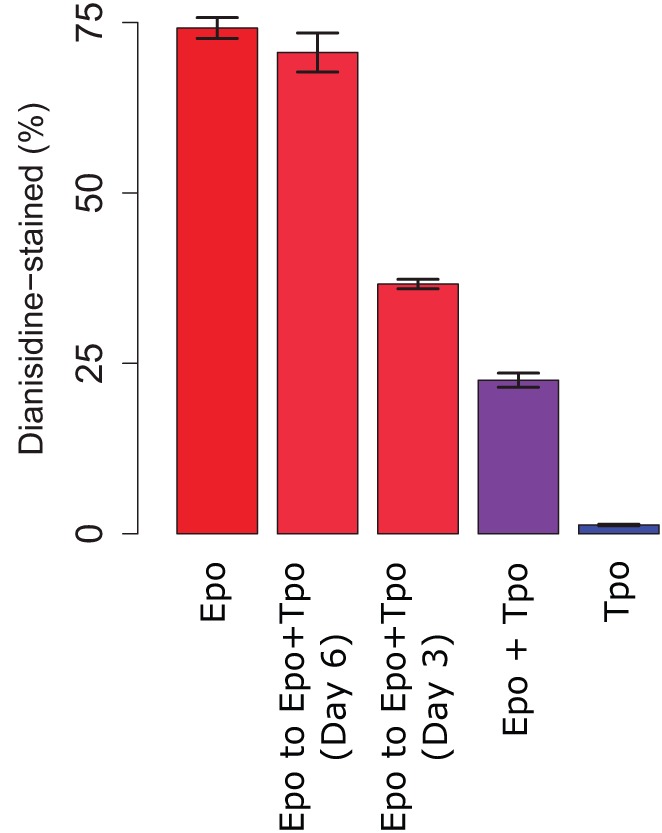
Effect of Epo and Tpo treatment on erythrocyte differentiation. UT-7/GM cells were passaged into medium containing only Epo, only Tpo, or both. On days 3 and 6, part of the Epo culture was passaged separately into medium containing both cytokines. All cultures were assessed for erythrocyte differentiation by o-dianisidine staining on day 14. Results are mean±s.e.m. from duplicate experiments.
The adverse effect of Tpo on erythrocyte commitment cannot be explained solely by boosting survival or growth of committing megakaryocytes
Recent findings suggest that cytokines can instruct lineage commitment (May and Enver, 2013). In contrast, the stochastic theory (Enver et al., 1998) proposes that cytokines do not direct lineage choice, and hence the proportions of erythrocytes and megakaryocytes observed in our experiments would only be due to the effects of Epo and Tpo on cell survival and proliferation. Here, we present a high-level mathematical analysis that suggests that our experimental results are inconsistent with purely stochastic commitment.
In the stochastic theory, each cell in the initial GMCSF-starved cell population adopts one of the following fates: (1) erythrocyte lineage, dependent on Epo; (2) megakaryocyte lineage, dependent on Tpo; or (3) undifferentiated cells that are (a) able to survive in Epo-only medium or (b) are dependent on Tpo for survival.
Let x represent the proportion of cells committing to the erythrocyte lineage [i.e. cells corresponding to population (1) above and exhibiting o-dianisidine staining on day 14], and u represent the proportion of cells that do not exhibit staining and can survive in only Epo medium (population 3a above). Hence, 1−x−u represents the proportion of cells that do not exhibit staining and are dependent on Tpo (combined populations 2 and 3b above).
In the presence of a supportive cytokine, cells proliferate (rate constant kp) and, in its absence, cells die (rate constant kd). Hence, given parameter values, the expected proportion of each fate under Epo-only treatment for t days can be computed (Table 1). If cells cultured in Epo-only medium for t days are then transitioned to Epo+Tpo medium, then all living cells will proliferate according to the stochastic theory. Note that if all populations proliferate at the same rate (i.e. have identical kp values), their proportions will remain the same on day 14 as they were on day t.
Table 1.
Expected proportions of cell sub-populations under the stochastic theory of lineage commitment

Our population-level experiments described above reveal that a UT-7/GM cell population maintained in Epo-only medium throughout yielded 75% o-dianisidine-stained cells on day 14 (Fig. 1). According to Table 1, this corresponds to the following result on day 14:
 |
Solving for x0, the proportion of cells pre-committed to the erythrocyte lineage on day 0, yields:
 |
At t=14 days, the  terms are negligibly small, thus yielding:
Given that both populations of Epo-dependent cells proliferate or die at the same rate, this relationship holds across all experiments.
When maintained in Epo+Tpo medium throughout, all populations proliferated (including 1−x−u), yielding the following equation for x, with x equal to 0.25 on day 14 (Fig. 1).
 |
Substituting the previous result [u0=(1/3)x0] and solving for x0 yields:
 |
Note that when kp,Epo=kp,Tpo, x0=0.25, which would be a constant throughout the timecourse because all cells would be proliferating at the same rate.
From the literature, kp,Epo is 0.69–0.92 d−1 (corresponding to doubling times of 18–24 h) for Epo-supported cells, kp,Tpo is 0.69 d−1 (doubling time of 24 h) (Komatsu et al., 1993, 1996, 1997) for Tpo-supported cells, and kd is 0.3 d−1 (half-life of ∼2 days) (Palani and Sarkar, 2012).
Given these parameter values and the formulae above, the expected proportion of o-dianisidine-stained cells under the delayed Tpo-addition experiments can be computed. Results from simulations under a range of biologically reasonable parameter values demonstrate that, according to the stochastic theory, a culture maintained in Epo-only medium for 3 days and subsequently transitioned to Epo+Tpo medium would be expected to exhibit o-dianisidine-staining of >65% (Fig. 2). This proportion is dramatically higher than observed (∼36%; Fig. 1), suggesting that even on day 3, Tpo can adversely impact erythrocyte commitment in a manner beyond simply boosting survival or growth of committing megakaryocytes, thus bolstering the instructive theory of commitment in our study.
Fig. 2.
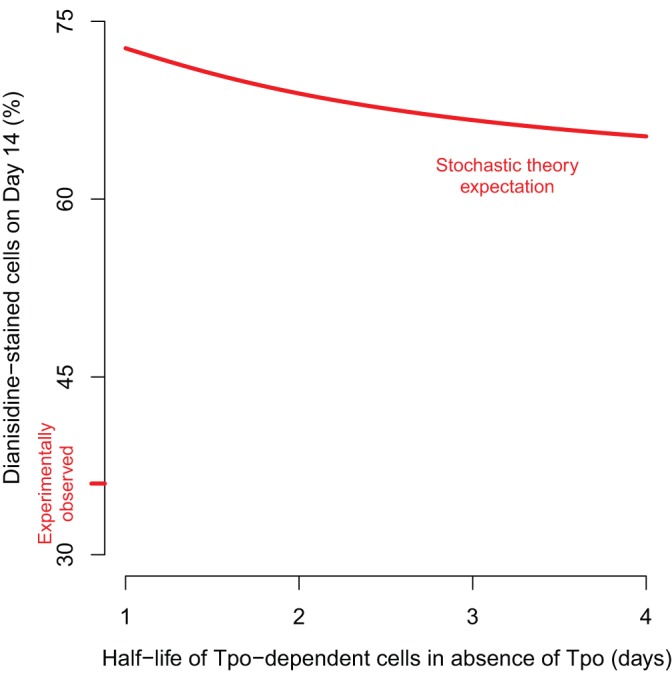
The observed proportion of erythrocytes is inconsistent with purely stochastic theory of lineage commitment. According to the stochastic theory of lineage commitment, Tpo affects proportions of committing erythrocytes only through modulation of growth and survival of committing megakaryocytes. Simulation of this model reveals that when Tpo is added to Epo-only medium on day 3, the observed proportion of o-dianisidine-stained cells on day 4 is substantially higher than expected under the stochastic theory.
EKLF and FLI-1 transcript levels are inversely correlated in committing MEP cells
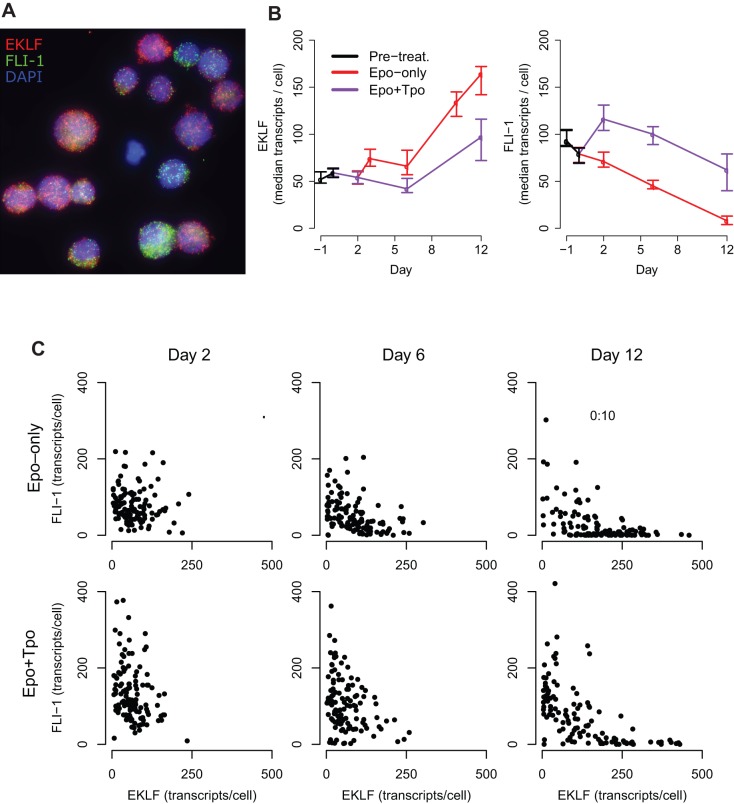
To understand how lineage choice is determined at the level of an individual cell, we treated UT-7/GM cells with Epo and Tpo, and counted individual transcripts of EKLF and FLI-1 at regular time intervals by single-molecule fluorescence in situ hybridization (mRNA FISH) (Fig. 3A).
Fig. 3.
Effect of Epo and Tpo treatment on EKLF and FLI-1 levels in individual cells. UT-7/GM cells were passaged into medium containing only Epo, only Tpo, or both. On days 3 and 6, part of the Epo culture was passaged separately into medium containing both cytokines. (A) Merged microscopy image of UT-7/GM cells treated with Epo and Tpo on day 12, created by flattening 3D stacks. EKLF (red) and FLI-1 (green) transcripts are shown in cell nuclei (blue). The image was enhanced to show contrast. (B) Median EKLF and FLI-1 transcripts per cell under Epo or Epo+Tpo treatment. Day 0 refers to the day when UT-7/GM cells were passaged into medium containing only Epo, or both Epo and Tpo. Error bars denote the boot-strapped 95% confidence interval for the median. (C) Correlations between EKLF and FLI-1 levels during treatment with Epo or Epo+Tpo.
Before cytokine treatment, the levels of the transcripts for the two transcription factors were uncorrelated [growth-factor-starved culture, P=0.4, ρ 95% confidence interval (−0.28, +0.16); supplementary material Fig. S1], but after treatment with Epo, individual cells exhibited an increase in EKLF and a decrease in FLI-1, leading to a significant inverse correlation between the two transcripts on day 6 [P<0.001, ρ 95% confidence interval (−0.65, −0.33)]. On day 12, cells exhibited a further upregulation of EKLF and a dramatic reduction in FLI-1 levels (Fig. 3B,C).
Data from the Epo+Tpo culture show the population bifurcating into the two commitment trajectories, leading to a strong inverse correlation between EKLF and FLI-1 visible on day 12 [P<0.001, ρ 95% confidence interval (−0.84, −0.65), Fig. 3C]. Consistent with the instructive theory, our results demonstrate that an inverse correlation between EKLF and FLI-1 levels develops quickly but only after treatment with cytokines, and hence do not suggest the presence of pre-existing commitment bias mediated by EKLF and FLI-1, as predicted by the stochastic theory.
The transcription factor GATA-1 plays important roles in both erythrocyte and megakaryocyte lineage commitment (Pevny et al., 1991; Wang et al., 2002). FISH analysis reveals that GATA-1 transcript counts are positively correlated with EKLF and FLI-1 counts in Epo-only and Tpo-only medium, respectively, and highlights the supportive role that GATA-1 plays in both erythrocyte and megakaryocyte commitment (supplementary material Fig. S2).
EKLF establishes an irreversible threshold for erythrocyte lineage commitment
To understand the role of master transcription factors in maintaining memory to Epo treatment, we passaged growth-factor starved UT-7/GM cells into medium containing only Epo for 3 days, after which the culture was maintained in medium containing both Epo and Tpo.
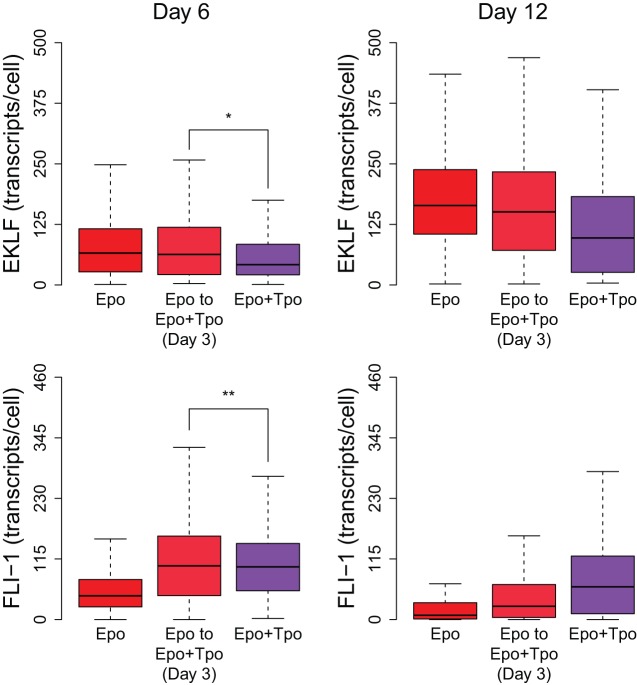
Comparison of transcript counts in this culture with one that was maintained in Epo+Tpo throughout revealed that cells passaged from Epo-only medium into Epo+Tpo medium exhibited higher levels of EKLF on day 6 compared to cells maintained in Epo+Tpo throughout [median 33% higher, 95% confidence interval (11%, 59%)], as expected, given that Epo supports the erythrocyte lineage. In contrast, the distributions of FLI-1 levels in the two cultures on day 6 were very similar [median 3% higher, 95% confidence interval (−10%, 20%)], and exhibited significantly higher transcript counts than the Epo-only culture, indicating that the introduction of Tpo allows cells to maintain higher FLI-1 levels (Fig. 4).
Fig. 4.
Impact on EKLF and FLI-1 levels after introduction of Tpo to an Epo-induced culture. UT-7/GM cells were starved of growth factor and subsequently passaged into medium with only Epo or Epo+Tpo. On day 3, part of the culture in Epo-only medium was passaged into Epo+Tpo medium. On day 6, cells that were switched from Epo-only to Epo+Tpo medium exhibited significantly higher EKLF transcript expression [*median 33% higher, 95% confidence interval (11%, 59%)], but similar FLI-1 transcript expression [**median 3% higher, 95% confidence interval (−10%, 20%)] when compared to cells maintained in Epo+Tpo medium throughout. The box represents the 25th–75th percentiles, and the median is indicated. For each box, the interquartile range (IQR) is defined as the difference between the 75th and 25th percentile values; the top whisker is at 1.5× IQR above the 75th percentile, and the bottom whisker is at 1.5× IQR below the 25th percentile or zero, whichever is greater.
Given that Epo-only pre-treatment has a definite phenotype effect, and this bias is not reflected in FLI-1 levels on day 6, our results suggest that EKLF effectively establishes a threshold above which an autoregulatory feedback is activated, resulting in further upregulation of EKLF and repression of FLI-1, and causing the cell to irreversibly commit to the erythrocyte lineage, regardless of the presence of Tpo. Accordingly, FLI-1 levels in erythrocyte-committing (EKLF-high) cells are dramatically lowered on day 12.
Erythrocyte lineage achieves exclusivity by augmenting cognate signal and suppressing the opposing signal
Signaling through its cognate cytokine receptor can allow an extrinsic cue to bias commitment towards a particular lineage; however, the same functionality can enable an opposing cue to hinder exclusive expression of a lineage program even after the commitment decision has been made. We hypothesized that upregulation of the cognate receptor (Palani and Sarkar, 2008) or downregulation of the opposing receptor could enable the cell to become selectively more responsive to the desired extrinsic cue.
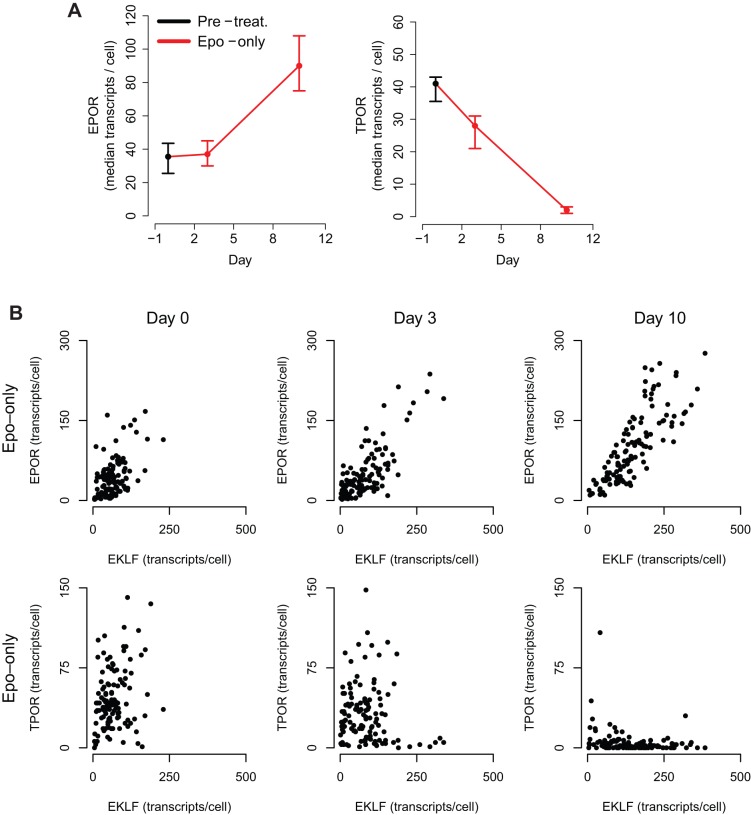
Transcript counting in cells in Epo-only culture revealed that the median number of EpoR transcripts rose dramatically from 37, immediately before cytokine treatment, to 90 on day 10. Analysis of transcript counts in individual cells revealed a strong positive correlation between EKLF and EpoR in the Epo-only culture on day 3 [P<0.001, ρ 95% confidence interval (+0.45, +0.72)], that was even stronger on day 10 [P<0.001, ρ 95% confidence interval (+0.75, +0.88)] (Fig. 5A,B).
Fig. 5.
Expression of lineage-specific receptors during erythrocyte commitment. (A) Median transcripts per cell in UT-7/GM cells treated with Epo. Error bars denote the boot-strapped 95% confidence interval for the median. (B) Phase plots show correlation between EKLF and EpoR, and EKLF and TpoR transcripts during erythrocyte differentiation.
In contrast, median TpoR levels decreased dramatically in the Epo-treated culture, from 41 transcripts immediately before cytokine treatment to two on day 10 (Fig. 5A). Furthermore, EKLF and TpoR transcript counts were inversely correlated on days 3 [P=0.03, ρ 95% confidence interval −0.31, +0.11)] and 10 [P<0.001, ρ 95% confidence interval (−0.51, −0.13)]; this correlation did not exist before treatment with Epo [P=0.99, ρ 95% confidence interval (−0.09, +0.35)] (Fig. 5B).
Hence, simultaneous counting of master transcription factor and receptor transcripts suggests that the erythrocyte lineage enforces exclusivity by both hypothesized mechanisms: boosting the Epo signal and suppressing the opposing Tpo signal.
Mathematical model explains robust lineage exclusivity while accounting for intrinsic and extrinsic cues
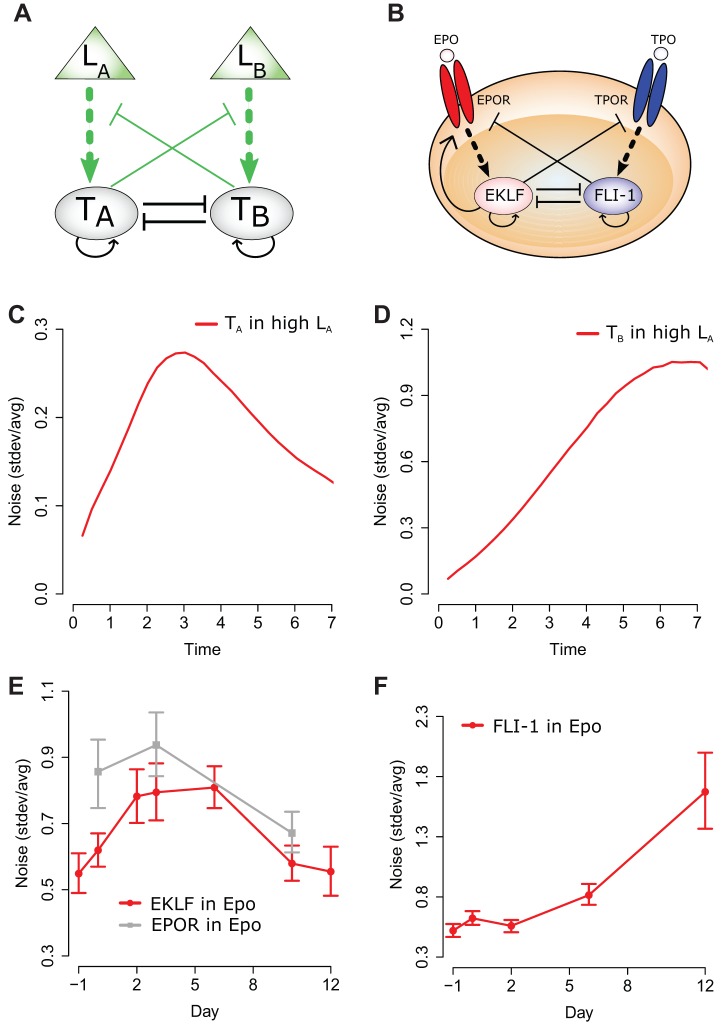
Based on these findings in erythropoiesis, we propose the ‘extrinsic cross antagonism autoregulation’ (ECAA) mathematical model (Fig. 6A), which achieves robust decision-making by upregulation of cognate effectors and repression of both the opposing master transcription factor and the opposing receptor.
Fig. 6.
The ECAA model predicts noise profiles for transcription factor and receptor expression. (A) The CAA topology (in black) consists of two auto-regulating and mutually-inhibiting transcription factors (TA and TB). Extending this network to allow extrinsic cues (LA and LB) to indirectly promote cognate transcription factor synthesis and to allow transcription factors to inhibit extrinsic cue signals (in green) yields the full ECAA topology. (B) Proposed model for erythrocyte commitment includes mutual antagonism between EKLF and FLI-1, and TpoR downregulation in the erythrocyte lineage. In addition, and in accordance with our experimental findings, EpoR is explicitly upregulated by EKLF. (C,D) Simulated noise profiles for TA and TB during treatment with LA. (E,F) Noise in EKLF and EpoR, and FLI-1 levels in UT-7/GM cells during treatment with Epo. Transcript counts for EKLF were obtained and used to compute the noise [s.d./arithmetic mean] for transcription factor and receptor mRNA levels.
Similar to the ‘cross antagonism autoregulation’ (CAA) model (Graf and Enver, 2009; Huang, 2009), the ECAA model comprises two lineage-specific transcription factors, TA and TB, driving commitment to lineages A and B, respectively; each transcription factor upregulates its own synthesis, and inhibits the transcription factor for the opposing lineage. Unlike the CAA model, the ECAA model integrates cytokine cues into the commitment decision; extrinsic stimuli LA and LB promote the upregulation and/or activity of TA and TB, respectively, and the transcription factor for each lineage suppresses the signal-mediated upregulation and/or activity of the transcription factor for the opposing lineage. Although the MEP commitment circuit involves more than four components (Crispino and Weiss, 2014), the ECAA minimal model represents a conceptual framework (Huang et al., 2007) that uses TA and TB levels as proxies for the full erythrocyte and megakaryocyte expression programs, greatly simplifying our model while still capturing complex dynamical features of the network.
The ECAA model yields three steady-states: two exclusive states where one transcription factor is present at high levels and the other is expressed only minimally, and a third state where both transcription factors are expressed at intermediate levels. In the context of hematopoiesis, the intermediate state represents a bipotent progenitor cell, and the exclusive states represent committed cells.
Simulations of the ECAA model reveal that as an individual cell commits to a particular lineage (e.g. lineage A), the expression of the relevant master transcription factor, TA, is upregulated, while that of the opposing lineage, TB, is downregulated. In the context of a population, an inverse correlation develops between TA and TB at the outset of the commitment process (supplementary material Fig. S3), consistent with our observation that EKLF and FLI-1 levels are inversely correlated only after treatment with pro-differentiation cytokines, but significantly before the appearance of clear differentiation markers such as hemoglobin.
Simulations also demonstrate that cells starting in the bipotent state eventually settle in one of the exclusive states and that the proportions of cells committing to either lineage can be significantly skewed by varying LA and LB (supplementary material Fig. S3). However, a cell with a TA above a set threshold and a TB that is sufficiently low settles in the high-TA, low-TB state even if LB is subsequently increased. Consistent with our observation of TpoR inhibition by the erythrocyte lineage, TA suppresses signaling between LB and TB, and in effect filters out the LB signal.
Taken together, model analysis suggests that the combination of mutual transcription factor antagonism and opposing receptor suppression yields a robust decision-making module that is responsive to extrinsic cues in the uncommitted state, while being resistant to conflicting cues in the committed state.
Noise in EKLF and FLI-1 expression is consistent with ECAA model predictions
Simulations of the ECAA model reveal characteristic noise profiles for the two opposing transcription factors. Among cells committing to lineage A, noise in TA expression rises quickly as cells exit the progenitor state, and falls slowly as cells settle in the committed high-TA, low-TB state; in the same population, noise in TB expression also rises significantly, and eventually rests at a level higher than that of TA, because of the reduction in mean TB (Fig. 6C,D).
Consistent with ECAA model predictions, after cells were switched to Epo-only medium, noise in EKLF levels rose and stayed high until day 6, before decreasing to near-initial levels (Fig. 6E). In the same population, noise in FLI-1 expression rose as predicted throughout the standard timecourse for erythropoiesis (Fig. 6F).
If a gene with variable expression upregulates another gene, one would generally expect the noise in the regulated transcript to be at least as great in magnitude as, and correlated in time with, noise in the source transcript (assuming the regulated transcript is not expressed at a dramatically higher level than the source transcript) (Dunlop et al., 2008; Lestas et al., 2010). Consistent with this idea, noise in EpoR expression was greater than, and appeared to be correlated with, noise in EKLF (Fig. 6E).
DISCUSSION
Despite the identification of numerous molecular components and pathways, the process by which a hematopoietic progenitor cell decides on a particular lineage, and stays committed to that lineage, remains poorly understood. In this context, a particular point of contention is whether the lineage choice of a cell is a function of the relative balance of lineage-specific transcription factor levels (stochastic) or the cytokine signals in its environment (instructive). In this study, we experimentally demonstrate that both stochastic and instructive effects are at play in committing MEP cells and we propose the ECAA model as a minimal framework for capturing the observed dynamics.
Through cytokine conflict experiments and mathematical analysis, we show that the antagonistic effect of Tpo on an Epo-induced population cannot be adequately explained by considering only the pro-survival and pro-proliferative effects of Tpo on committing megakaryocytes. Furthermore, an inverse correlation between the master transcription factors EKLF and FLI-1 develops only after treatment with cytokines. Thus, our results are consistent with recent studies conducted with the cytokines MCSF and GCSF (Mossadegh-Keller et al., 2013; Rieger et al., 2009), which suggest that hematopoietic lineage commitment is not entirely stochastic.
If cytokines can significantly impact lineage choice, how do cells stay committed to their respective lineages while residing in an environment containing multiple conflicting signals? Our study suggests that cells can achieve robust bias towards the erythrocyte lineage by both upregulating EpoR and downregulating TpoR, thus increasing effective Epo potency and filtering out Tpo signals. These findings, coupled with observed correlations between master transcription factors and lineage-specific receptors, support both the general ECAA model and EpoR-feedback models for erythropoiesis (Palani and Sarkar, 2008, 2009). Although these models do not exhaustively account for all experimentally observed possibilities, such as dedifferentiation and non-discrete states, they nevertheless offer a useful framework for understanding key behaviors of hematopoietic bipotent progenitors.
In summary, cytokine receptors can play important regulatory roles beyond the mere forwarding of extrinsic cues and can act as core components of robust decision-making machinery in cells with multiple fate possibilities. Given that this initial study was carried out with a single cell line, it will be illuminating to conduct similar experiments in additional bipotential cell lines to determine whether our findings can be generalized across hematopoiesis and beyond.
MATERIALS AND METHODS
Cell culture and hemoglobin staining
All culturing and hemoglobin staining experiments were performed in UT-7/GM cells (Komatsu et al., 1997) as previously described (Palani and Sarkar, 2012). Epo and Tpo were used at 1 U/ml and 5 ng/ml, respectively, whenever appropriate. Epo was purchased from Applichem, and Tpo and GMCSF were purchased from Peprotech. The first day of treatment with either Epo or Tpo is referred to as day 0. Cell viability was determined by using Trypan Blue (Mediatech).
Transcript counting with mRNA FISH
Fresh cultures were washed twice with PBS, fixed in 3.7% formaldehyde in PBS for 10 min, washed twice more with PBS, resuspended in 70% ethanol, and stored at 4°C. FISH reactions were performed in solution overnight at 37°C (Batish et al., 2011; Raj et al., 2008) using probes from Biosearch Technologies (supplementary material Table S1).
Imaging was performed on a Nikon Ti-E microscope with a 100× objective, in stacks spaced 0.3 µm apart. Image analysis was performed using a custom MATLAB pipeline.
Statistical methods
For mRNA FISH data, the significance of correlation between the counts of two transcripts was assessed by comparing Spearman's rank correlation coefficient, ρ, for the dataset to coefficients obtained from 1000 random permutations, from which a P-value was computed. Bootstrapping was used to estimate confidence intervals for ρ.
Mathematical model for bipotent lineage commitment
The CAA network (Graf and Enver, 2009; Huang, 2009) was augmented to the ECAA model to include mechanisms by which extrinsic cytokine cues can modulate decision making, and it was simulated using the Gillespie algorithm (Gillespie, 1977). The model consists of transcription factors, TA and TB (A and B in the equations), driving separate lineages. Each transcription factor upregulates its own synthesis, and inhibits the synthesis of the other transcription factor. Under certain parameter regimes, this system can yield bistability. b0, b1 represent basal synthesis rates, d0, d1 represent degradation rates, v0, v1 represent maximal feedback-mediated synthesis rates, K0, K1 represent the transcription factor values at which feedback-mediated synthesis is half-maximal (in the absence of inhibition), and I0, I1 represent repression constants for feedback-mediated synthesis. S0, S1 terms represent synthesis of A, B induced by extrinsic cues LA, LB (with maximum values vS0 and vS1, respectively); signaling between the cognate receptor and transcription factor is inhibited by the opposing transcription factor. Simulated annealing was used to fit the parameters to the mRNA FISH data: b0=30, b1=5, d=1, h=2, I0=0.3, I1=0.61, K0=10, K1=11.21, v0=226.66, v1=229.45, γ0=453.29, γ1=349.83,  and
and  .
.
 |
 |
 |
 |
Supplementary Material
Acknowledgements
We thank Santhosh Palani for helpful discussions and Kenneth Kaushansky and Norio Komatsu for UT-7/GM cells.
Footnotes
Competing interests
The authors declare no competing or financial interests.
Author contributions
N.A.S. and C.A.S. conceived the research; N.A.S. performed the experiments and simulations; M.J.L. and A.R. provided expertise and resources for single-molecule mRNA FISH experiments; N.A.S. and C.A.S. analyzed the data; N.A.S. and C.A.S. wrote the manuscript.
Funding
This work was supported by the American Heart Association with a Predoctoral Fellowship to N.A.S. and a Scientist Development Grant [grant number 0835132N to C.A.S.]; and by the National Institutes of Health (NIH) [grant number 1R01GM113985 to C.A.S.]. A.R. acknowledges support from an NIH Director's New Innovator Award [grant number 1DP2OD008514] and a Burroughs Wellcome Fund Career Award at the Scientific Interface. Deposited in PMC for release after 12 months.
Supplementary material
Supplementary material available online at http://jcs.biologists.org/lookup/suppl/doi:10.1242/jcs.158436/-/DC1
References
- Bastian L. S., Kwiatkowski B. A., Breininger J., Danner S. and Roth G. (1999). Regulation of the megakaryocytic glycoprotein IX promoter by the oncogenic Ets transcription factor Fli-1. Blood 93, 2637-2644. [PubMed] [Google Scholar]
- Batish M., Raj A. and Tyagi S. (2011). Single molecule imaging of RNA in situ. Methods Mol. Biol. 714, 3-13. 10.1007/978-1-61779-005-8_1 [DOI] [PubMed] [Google Scholar]
- Borg J., Papadopoulos P., Georgitsi M., Gutiérrez L., Grech G., Fanis P., Phylactides M., Verkerk A. J. M. H., van der Spek P. J., Scerri C. A. et al. (2010). Haploinsufficiency for the erythroid transcription factor KLF1 causes hereditary persistence of fetal hemoglobin. Nat. Genet. 42, 801-805. 10.1038/ng.630 [DOI] [PMC free article] [PubMed] [Google Scholar]
- Crispino J. D. and Weiss M. J. (2014). Erythro-megakaryocytic transcription factors associated with hereditary anemia. Blood 123, 3080-3088. 10.1182/blood-2014-01-453167 [DOI] [PMC free article] [PubMed] [Google Scholar]
- Dunlop M. J., Cox R. S., Levine J. H., Murray R. M. and Elowitz M. B. (2008). Regulatory activity revealed by dynamic correlations in gene expression noise. Nat. Genet. 40, 1493-1498. 10.1038/ng.281 [DOI] [PMC free article] [PubMed] [Google Scholar]
- Enver T., Heyworth C. M. and Dexter T. M. (1998). Do stem cells play dice? Blood 92, 348-351; discussion 352. [PubMed] [Google Scholar]
- Gillespie D. T. (1977). Exact stochastic simulation of coupled chemical reactions. J. Phys. Chem. 81, 2340-2361. 10.1021/j100540a008 [DOI] [Google Scholar]
- Graf T. and Enver T. (2009). Forcing cells to change lineages. Nature 462, 587-594. 10.1038/nature08533 [DOI] [PubMed] [Google Scholar]
- Huang S. (2009). Reprogramming cell fates: reconciling rarity with robustness. Bioessays 31, 546-560. 10.1002/bies.200800189 [DOI] [PubMed] [Google Scholar]
- Huang S., Guo Y.-P., May G. and Enver T. (2007). Bifurcation dynamics in lineage-commitment in bipotent progenitor cells. Dev. Biol. 305, 695-713. 10.1016/j.ydbio.2007.02.036 [DOI] [PubMed] [Google Scholar]
- Komatsu N., Yamamoto M., Fujita H., Miwa A., Hatake K., Endo T., Okano H., Katsube T., Fukumaki Y. and Sassa S. (1993). Establishment and characterization of an erythropoietin-dependent subline, UT-7/Epo, derived from human leukemia cell line, UT-7. Blood 82, 456-464. [PubMed] [Google Scholar]
- Komatsu N., Kunitama M., Yamada M., Hagiwara T., Kato T., Miyazaki H., Eguchi M., Yamamoto M. and Miura Y. (1996). Establishment and characterization of the thrombopoietin-dependent megakaryocytic cell line, UT-7/TPO. Blood 87, 4552-4560. [PubMed] [Google Scholar]
- Komatsu N., Kirito K., Shimizu R., Kunitama M., Yamada M., Uchida M., Takatoku M., Eguchi M. and Miura Y. (1997). In vitro development of erythroid and megakaryocytic cells from a UT-7 subline, UT-7/GM. Blood 89, 4021-4033. [PubMed] [Google Scholar]
- Lestas I., Vinnicombe G. and Paulsson J. (2010). Fundamental limits on the suppression of molecular fluctuations. Nature 467, 174-178. 10.1038/nature09333 [DOI] [PMC free article] [PubMed] [Google Scholar]
- May G. and Enver T. (2013). Lineage specification: reading the instructions may help! Curr. Biol. 23, R662-R665. 10.1016/j.cub.2013.06.054 [DOI] [PubMed] [Google Scholar]
- Mossadegh-Keller N., Sarrazin S., Kandalla P. K., Espinosa L., Stanley E. R., Nutt S. L., Moore J. and Sieweke M. H. (2013). M-CSF instructs myeloid lineage fate in single haematopoietic stem cells. Nature 497, 239-243. 10.1038/nature12026 [DOI] [PMC free article] [PubMed] [Google Scholar]
- Nuez B., Michalovich D., Bygrave A., Ploemacher R. and Grosveld F. (1995). Defective haematopoiesis in fetal liver resulting from inactivation of the EKLF gene. Nature 375, 316-318. 10.1038/375316a0 [DOI] [PubMed] [Google Scholar]
- Okada Y., Nobori H., Shimizu M., Watanabe M., Yonekura M., Nakai T., Kamikawa Y., Wakimura A., Funahashi N., Naruse H. et al. (2011). Multiple ETS family proteins regulate PF4 gene expression by binding to the same ETS binding site. PLoS ONE 6, e24837 10.1371/journal.pone.0024837 [DOI] [PMC free article] [PubMed] [Google Scholar]
- Palani S. and Sarkar C. A. (2008). Positive receptor feedback during lineage commitment can generate ultrasensitivity to ligand and confer robustness to a bistable switch. Biophys. J. 95, 1575-1589. 10.1529/biophysj.107.120600 [DOI] [PMC free article] [PubMed] [Google Scholar]
- Palani S. and Sarkar C. A. (2009). Integrating extrinsic and intrinsic cues into a minimal model of lineage commitment for hematopoietic progenitors. PLoS Comput. Biol. 5, e1000518 10.1371/journal.pcbi.1000518 [DOI] [PMC free article] [PubMed] [Google Scholar]
- Palani S. and Sarkar C. A. (2012). Transient noise amplification and gene expression synchronization in a bistable mammalian cell-fate switch. Cell Rep. 1, 215-224. 10.1016/j.celrep.2012.01.007 [DOI] [PubMed] [Google Scholar]
- Parkins A. C., Sharpe A. H. and Orkin S. H. (1995). Lethal beta-thalassaemia in mice lacking the erythroid CACCC-transcription factor EKLF. Nature 375, 318-322. 10.1038/375318a0 [DOI] [PubMed] [Google Scholar]
- Pevny L., Simon M. C., Robertson E., Klein W. H., Tsai S.-F., D'Agati V., Orkin S. H. and Costantini F. (1991). Erythroid differentiation in chimaeric mice blocked by a targeted mutation in the gene for transcription factor GATA-1. Nature 349, 257-260. 10.1038/349257a0 [DOI] [PubMed] [Google Scholar]
- Raj A., van den Bogaard P., Rifkin S. A., van Oudenaarden A. and Tyagi S. (2008). Imaging individual mRNA molecules using multiple singly labeled probes. Nat. Methods 5, 877-879. 10.1038/nmeth.1253 [DOI] [PMC free article] [PubMed] [Google Scholar]
- Rieger M. A., Hoppe P. S., Smejkal B. M., Eitelhuber A. C. and Schroeder T. (2009). Hematopoietic cytokines can instruct lineage choice. Science 325, 217-218. 10.1126/science.1171461 [DOI] [PubMed] [Google Scholar]
- Shivdasani R. A. (2001). Molecular and transcriptional regulation of megakaryocyte differentiation. Stem Cells 19, 397-407. 10.1634/stemcells.19-5-397 [DOI] [PubMed] [Google Scholar]
- Siatecka M. and Bieker J. J. (2011). The multifunctional role of EKLF/KLF1 during erythropoiesis. Blood 118, 2044-2054. 10.1182/blood-2011-03-331371 [DOI] [PMC free article] [PubMed] [Google Scholar]
- Siatecka M., Xue L. and Bieker J. J. (2007). Sumoylation of EKLF promotes transcriptional repression and is involved in inhibition of megakaryopoiesis. Mol. Cell. Biol. 27, 8547-8560. 10.1128/MCB.00589-07 [DOI] [PMC free article] [PubMed] [Google Scholar]
- Tallack M. R., Magor G. W., Dartigues B., Sun L., Huang S., Fittock J. M., Fry S. V., Glazov E. A., Bailey T. L. and Perkins A. C. (2012). Novel roles for KLF1 in erythropoiesis revealed by mRNA-seq. Genome Res. 22, 2385-2398. 10.1101/gr.135707.111 [DOI] [PMC free article] [PubMed] [Google Scholar]
- Wang X., Crispino J. D., Letting D. L., Nakazawa M., Poncz M. and Blobel G. A. (2002). Control of megakaryocyte-specific gene expression by GATA-1 and FOG-1: role of Ets transcription factors. EMBO J. 21, 5225-5234. 10.1093/emboj/cdf527 [DOI] [PMC free article] [PubMed] [Google Scholar]
Associated Data
This section collects any data citations, data availability statements, or supplementary materials included in this article.


