

Abstract
Different quantitative and qualitative indices calculated on oral panoramic radiographs have been proposed as useful tools to screen for reduced skeletal bone mineral density (BMD). Our aim was to systematically review the literature on linear and qualitative panoramic measures and to assess the accuracy of these indices by performing a meta-analysis of their sensitivity and specificity. The Preferred Reporting Items for Systematic reviews and Meta-Analyses (PRISMA) statement was followed. Fifty studies were included in the qualitative appraisal and 19 were considered for meta-analysis. The methodological quality of the retrieved studies, assessed with the QUADAS-2 tool, was on average low. Three indices were reported by most of the studies: mandibular cortical width, panoramic mandibular index, and the Klemetti index. Mandibular cortical width presented with a better accuracy in excluding osteopenia/osteoporosis (specificity), since patients with a cortical width more than 4 mm had a normal BMD in 90% of the cases. Almost all studies used a cutoff of 0.3 for the panoramic mandibular index, resulting in an estimated sensitivity and specificity in detecting reduced BMD, respectively, of 0.723 (SE 0.160; 95% confidence interval [CI], 0.352–0.926) and 0.733 (SE 0.066; 95% CI, 0.587–0.841). The presence of any kind of mandibular cortical erosion gave an estimated sensitivity and specificity in detecting reduced BMD, respectively, of 0.789 (SE 0.031; 95% CI, 0.721–0.843) and 0.562 (SE 0.047; 95% CI, 0.47–0.651) and a sensitivity and specificity in detecting osteoporosis, respectively, of 0.806 (SE 0.105; 95% CI, 0.528–0.9200) and 0.643 (SE 0.109; 95% CI, 0.417–0.820). The mandibular cortical width, panoramic mandibular index, and Klemetti index are overall useful tools that potentially could be used by dentists to screen for low BMD. Their limitations are mainly related to the experience/agreement between different operators and the different image quality and magnification of the panoramic radiographs.
Keywords: metabolic bone disease, pathologic bone demineralization, dental radiography, panoramic radiography, bone density, bone resorption
Introduction
Osteoporosis is a common bone metabolic disease characterized by progressive reduction in bone mass and changes in the microarchitectural structure of bone that lead to an increased risk of fractures (Consensus Development Conference 1993). The standard for its diagnosis is the measurement of bone mineral density (BMD) by dual-energy X-ray absorptiometry (DXA). BMD is defined through a T or Z score; the T score describes the number of standard deviations (SD) by which BMD differs from the mean value expected in young healthy individuals, while the Z score describes the number of SD by which BMD differs from the mean value expected for age and sex. A patient is diagnosed with osteoporosis when a T value of 2.5 SD or more below the young female adult mean is recorded, while a T score between −1 and −2.5 SD defines a status of osteopenia (Kanis et al. 2008).
The prevalence of osteoporosis in Europe was estimated to be 27.6 million people (22 million women and 5.6 million men) in 2010, but because of the increase in life expectancy, this number is likely to rise in the future (Hernlund et al. 2013). Although DXA scanning is currently the standard technique for the diagnosis of osteoporosis, peripheral imaging techniques such as peripheral quantitative tomography, peripheral DXA, quantitative ultrasound methods, and peripheral magnetic resonance imaging have also been used for patient monitoring (Gluer et al. 1997). In addition, an increasing number of studies have proposed the use of different quantitative/qualitative indices performed on dental panoramic radiographs to predict skeletal bone density, with conflicting results (López-López et al. 2011). Considering that panoramic radiographs are frequent diagnostic procedures during routine dental checkups or before several dental treatment procedures (Tugnait et al. 2003), it could be of great clinical value if dentists could use them to identify patients at a high risk of osteoporosis.
This systematic review aims to evaluate the accuracy (relative to DXA) of the different panoramic morphometric indices for the diagnosis of osteopenia/osteoporosis, based on a meta-analysis of their sensitivity and specificity.
Materials and Methods
Focused Question
The question addressed was the following: Are linear and qualitative panoramic indices an accurate tool to diagnose osteopenia/osteoporosis?
Eligibility Criteria
Observational studies assessing the accuracy of panoramic morphometric indices in detecting osteopenia/osteoporosis were considered. Only studies with at least 5 osteopenic/osteoporotic patients and 5 nonosteoporotic patients and in which skeletal BMD was measured with DXA scan were included.
The included studies had to report at least one of the following measures (primary outcomes): sensitivity, specificity, positive predictive value (PPV), negative predictive value (NPV), and area under the receiver operating characteristic (ROC) curve.
Search Strategy, Assessment of Studies, and Data Abstraction
Three databases were searched: MEDLINE via OVID, EMBASE, and The Cochrane Database, updated to May 2013. In addition, bibliographies of review articles and of all the studies included for data extraction were screened and research groups with an interest in oral manifestations of osteoporosis were contacted. No language restriction was applied. Appendix Table 1 provides the details of the search strategy.
A 3-stage screening (titles, abstract, and full text) was carried out in duplicate and independently by 2 reviewers (EC and JCP) and the level of agreement at each stage was calculated using κ statistics.
Risk-of-Bias Assessment
Quality assessment was conducted independently and in duplicate by 2 reviewers (EC and JCP). The Quality Assessment of Diagnostic Accuracy Studies (QUADAS-2) criteria were followed, as suggested by Cochrane guidelines for diagnostic test accuracy reviews (Reitsma et al. 2009; Whiting et al. 2011). The QUADAS-2 tool consists of 4 key domains that discuss patient selection, index test, reference standard, and flow of patients. Each domain is assessed in terms of risk of bias (low, high, or unclear) and the first 3 domains are also assessed in terms of applicability (low, high, or unclear). The QUADAS-2 tool was adjusted to the objectives of this review and customized instructions to aid judgment of the signaling questions were produced (see Appendix Table 2).
Data Synthesis and Statistical Analysis
The Preferred Reporting Items for Systematic reviews and Meta-Analyses (PRISMA) statement (Moher et al. 2009) was followed.
Two-by-two (2 × 2) tables were retrieved (where possible) from all studies. Meta-analysis was performed only for studies in which osteopenia/osteoporosis was diagnosed with DXA scan at either the femur neck or at both lumbar spine and femur neck by using RevMan 5.2 (The Nordic Cochrane Centre, Copenhagen, Denmark) and STATA 13 (StataCorp LP, College Station, TX) statistics software. Studies with a low methodological quality (3 or 4 QUADAS domains with high risk of bias), with clear data errors, or with inconsistencies between the 2 × 2 table and the reported sensitivity, specificity, PPV, and NPV were excluded from the meta-analysis. All remaining studies were pooled according to how they divided participants (osteopenic included with osteoporotic subjects or not) and the cutoffs considered. For linear indices, studies were also divided according to the method of measurement of the index (manual/partially computer guided vs. completely computer guided). When fewer than 3 studies per group were retrieved, meta-analysis was not performed. When more than one observer measured the primary outcomes, the mean value of true positives, false positives, true negatives, and false negatives among the observers was used. When a study reported different 2 × 2 tables within the same cutoff range in the same population, meta-analysis was repeated, using one 2 × 2 table at a time. The different meta-analyses were then compared to check if the overall estimated sensitivity and specificity for that particular index had changed.
RevMan allowed drawing summary ROC plots for the different indices (data not reported) and forest plots with the estimated values of sensitivity and specificity (and confidence intervals) in each study. However, since RevMan derives summary ROC curves by using the Moses-Littenberg method, which does not provide estimates of the heterogeneity between studies, summary estimates of sensitivity and specificity are not reported by this software (Macaskill et al. 2010). Owing to these limitations, STATA software was also used when more than 4 studies were available, since it allows for a more rigorous approach based on hierarchical models, the bivariate model. The bivariate model can produce summary ROC curves, summary operating points (i.e., summary values for sensitivity and specificity), a 95% confidence region around the summary point, and a 95% prediction region, but it does not provide forest plots. The 95% prediction region is a way to show statistical heterogeneity, since it shows an area where we have 95% confidence that the true sensitivity and true specificity lie (Macaskill et al. 2010).
Results
Studies Included
Thirty-eight studies were identified through the database search and 6 more studies were retrieved through hand-search and bibliography check that met the inclusion/exclusion criteria. To have updated results, we ran the search strategy again in March 2014, and this allowed the inclusion of 7 new studies (Fig. 1). Two of the retrieved studies (Gulsahi et al. 2009; Gulsahi et al. 2010) were grouped together, since they refer to the same population; therefore, we finally considered 50 studies for the qualitative assessment. Five studies (Devlin et al. 2007; Horner et al. 2007; Karayianni et al. 2007; Roberts et al. 2010; Roberts et al. 2013) referred to the same multicenter study (OSTEODENT), but each focused on different indices or different techniques of index calculation and therefore were considered as separate studies. The same approach was followed for the studies by Lee et al. (2005), Arifin et al. (2006), and Nakamoto et al. (2003). The κ statistics showed a high level of agreement between the reviewers (κ > 0.90) at all stages. Reasons for study exclusions and characteristics of included studies are presented in Appendix Tables 3 and 4, respectively.
Figure 1.

Four-phase flow diagram of the article selection procedure, according to the Preferred Reporting Items for Systematic reviews and Meta-Analyses (PRISMA) statement (Moher et al. 2009).
Mandibular Cortical Width
Thirty-four studies reported measurements of the width of the mandibular cortex, which was referred to as the mandibular cortical width (MCW) or mental index (MI) or mandibular cortical thickness (MCT). In most of the studies, MCW was measured in the mental foramen region, along a line passing through the middle of the mental foramen and perpendicular to the tangent to the lower border of the mandible (Fig. 2), either manually or digitally, with image analysis systems. The cutoff values were chosen after drawing the ROC curve in order to find the highest sensitivity/specificity and they ranged from 2.69 mm to 5 mm. The levels of sensitivity and specificity associated with this index were heterogeneous and had a reciprocal relationship that varied in relation to the threshold chosen. A few studies reported a sensitivity >95% (Devlin et al. 2007; Ezoddini Ardakani et al. 2013; Kavitha et al. 2013; Muramatsu et al. 2013), while in other studies, this parameter did not reach 20% (Horner et al. 2002; Marandi et al. 2010; Mansour et al. 2013). The same variability applied to the specificity levels (Appendix Table 4).
Figure 2.
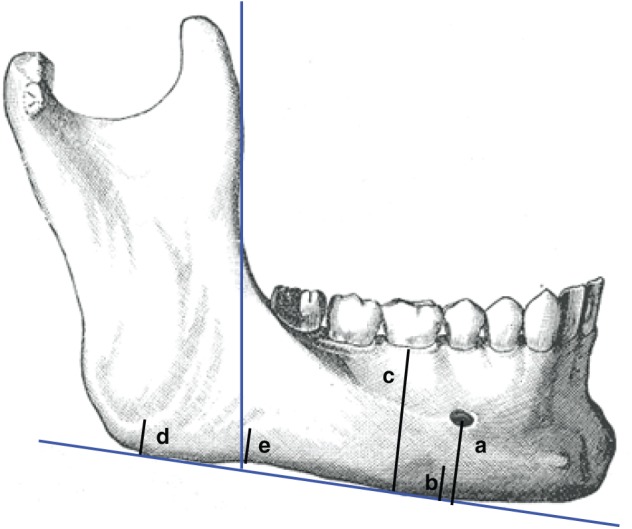
Linear panoramic indices: mandibular cortical width (or mental index or mandibular cortical thickness) = b (Horner and Devlin 1998); panoramic mandibular index (PMI) = b/a (Benson et al. 1991); gonial index (GI) = d (Bras et al. 1982); antegonial index (AI) = e (Ledgerton et al. 1999); mandibular ratio (M/M) = c/a (Ortman et al. 1989).
Panoramic Mandibular Index
Nine studies considered the panoramic mandibular index (PMI). This index represents the ratio between the mandibular cortical width at the mental foramen region and the distance from the lower border to the inferior edge of the mental foramen (Fig. 2) (Benson et al. 1991). Most of the studies reported a cutoff value of 0.3, with levels of sensitivity and specificity in detecting individuals with reduced bone density (T score <–1) ranging from 40.8% to 100% and from 47% to 88%, respectively (Appendix Table 4). Only 1 study considered 4 different cutoffs (Marandi et al. 2010).
Klemetti Index
Twenty-seven studies considered the Klemetti index (KI) as a tool for prediction of reduced BMD. This index, also known as the mandibular cortical index, qualitatively classifies the mandibular cortex distally to the mental foramen in the following categories: C1, when the endosteal margin is even and sharp; C2, when the endosteal margin presents lacunar resorption or cortical residues on one or both sides; and C3, when the cortical layer is clearly porous, with heavy endosteal cortical residues (Klemetti et al. 1994). In the included studies, the presence of cortical erosions (either C2 or C3 type) produced a sensitivity in detecting reduced BMD (T score <–1) ranging from 48.7% to 100% and a specificity ranging from 31% to 88.89% (Appendix Table 4). The sensitivity in the diagnosis of osteoporosis (T score ≤–2.5) varied from 35.9% to 90.9% and the specificity from 7.8% to 93.9% (Appendix Table 4). The wide range of outcomes reported is a sign of the high heterogeneity between the studies. Only a few studies evaluated the accuracy of clearly eroded cortex (C3) in detecting osteoporosis (Horner et al. 2007; Leite et al. 2010; Ferreira Leite et al. 2011; Al-Dam et al. 2013) (Appendix Table 4).
Other Indices
Other indices have been used less frequently to screen for reduced BMD (Fig. 2). Among those, the visual assessment of the cortex (a simplified KI), the gonial and antegonial indices (mandibular thickness respectively at the posterior and anterior border of the ramus), and the ratio between the total height of the mandibular body and the height from the lower border of the mandible to the lower border of the mental foramen (M/M) were used in at least 2 studies (Drozdzowska et al. 2002; Kim et al. 2004; Lee et al. 2005; Ishii et al. 2007; Mahl et al. 2008; Damilakis and Vlasiadis 2011; Renvert et al. 2011; Alonso et al. 2012; Passos et al. 2012). The M/M ratio was used in 4 studies (Drozdzowska et al. 2002; Ishii et al. 2007; Damilakis and Vlasiadis 2011; Passos et al. 2012), but only 2 reported data on sensitivity and specificity (Drozdzowska et al. 2002; Passos et al. 2012).
Assessment of Methodological Quality
There was no study complying with all QUADAS-2 items related to the risk of bias. Nine studies presented low risk of bias in 3 of the 4 domains, and 14 studies had a low risk of bias in 2 of the 4 domains. Four studies were considered at high risk of bias in 3 to 4 domains and therefore were excluded from the meta-analysis (Klemetti et al. 1994; Halling et al. 2005; Horner et al. 2007; Al-Dam et al. 2013). The detailed quality assessment for the 50 included studies is reported in Appendix Table 5. The index test and patient selection domains raised most of the methodological concerns, being inadequate in 82% and 50% of the studies, respectively. Reference standard was considered adequate in 90% of the studies (Fig. 3). Most authors did not report a detailed description of inclusion/exclusion criteria, did not clearly report if the examiners were blinded to patients’ skeletal BMD, and did not report intra- and interobserver agreement for index measurements. In 6 studies, the concerns about applicability were low in all the 3 relevant domains (Sutthiprapaporn et al. 2006; Mahl et al. 2008; Taguchi et al. 2008; Erdogan et al. 2009; Gaur et al. 2013; Miranda 2011), while in 21 studies, the concerns were low in 2 of the 3 relevant domains. Most of the concerns regarding applicability were related to patient selection (48%) and index test (46%) domains (Fig. 4).
Figure 3.
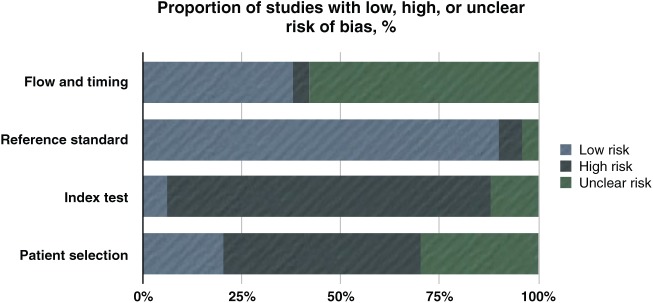
The bar chart shows that the risk of bias comes mainly from the domains of index test and patient selection, with flow and timing having the highest values for unclear risk.
Figure 4.

The bar chart shows that most of the concerns regarding applicability come from index test and patient selection domains.
Meta-Analysis
Meta-analysis was performed only for the KI and for linear indices that were measured with a manual/partially computer-driven method, due to the small number of studies that used completely computer-driven measurements or different qualitative indices.
Figure 5 presents the numbers for the 2 × 2 tables for each study (in alphabetical order). Study-specific estimates of sensitivity and specificity and their 95% confidence intervals are reported and also shown graphically. The scatter of point estimates indicates a great uncertainty and variability for both sensitivity and specificity. Each study could have contributed to different analyses, depending on the different cutoff values used. The Marandi et al. (2010) study is reported twice in the forest plot of MCW, since the authors reported 2 different 2 × 2 tables within the same cutoff range (≤3 mm and ≥ 4 mm), one for the cutoff of ≤3.69 mm and the other for the cutoff of ≥4 mm. The same applies to PMI, as 2 cutoffs were considered, ≤0.32 and ≤0.33. When estimating the overall sensitivity and specificity and ROC plots summary with STATA software, we ran the analysis twice and used only 1 of the 2 × 2 tables in each analysis to avoid considering the same study twice (Fig. 6a, a2, c, and c2). Only a few studies reported on the accuracy of MCW in detecting osteoporosis, and they considered different cutoffs (Appendix Table 4); therefore, no meta-analysis was performed.
Figure 5.

Forest plot of different indices at different cutoffs (RevMan output). The Marandi et al. (2010) study is reported twice for mandibular cortical width (MCW) (cutoff ≤3 mm and ≥4 mm) and for the panoramic mandibular index (PMI), since they reported 2 different 2 × 2 tables within the same cutoff range. However, when estimating the overall sensitivity and specificity and receiver operating characteristic (ROC) curve plots, each 2 × 2 table was used in a different analysis (see Fig. 6). BMD, bone mineral density; CI, confidence interval; FN, false negative; FP, false positive; TN, true negative; TP, true positive.
Figure 6.

Hierarchical summary receiver operating characteristic (HSROC) curves of the studies plotted in Figure 5 (STATA output). (a) Receiver operating characteristic (ROC) curve plot for 3 ≤ mandibular cortical width (MCW) ≥ 4 mm in detecting reduced bone mineral density (BMD): estimated sensitivity, 0.42 (SE 0.168; 95% confidence interval [CI], 0.158–0.737); estimated specificity, 0.93 (SE 0.042; 95% CI, 0.79–0.979). These estimates were obtained when considering the cutoff of ≤3.69 mm for Marandi et al (2010). (a2) Same as a, but for Marandi et al. (2010) we considered the cutoff of ≤4 mm. Estimated sensitivity, 0.43 (SE 0.164; 95% CI, 0.168–0.737); estimated specificity, 0.905 (SE 0.041; 95% CI, 0.789–0.960). (b) ROC plot for 4 < MCW > 5 mm in detecting reduced BMD; estimated sensitivity, 0.602 (SE 0.101; 95% CI, 0.398–0.775); estimated specificity, 0.708 (SE 0.064; 95% CI, 0.568–0.817). (c) ROC plot for panoramic mandibular index (PMI) ≤0.3 in detecting reduced BMD: estimated sensitivity, 0.723 (SE 0.160; 95% CI, 0.352–0.926); estimated specificity, 0.733 (SE 0.066; 95% CI, 0.587–0.841). (c2) Same as c, but for Marandi et al. (2010), we considered the cutoff of ≤0.33 instead of ≤0.32. Estimated sensitivity, 0.729 (SE 0.167; 95% CI, 0.338–0.934); estimated specificity, 0.707 (SE 0.067; 95% CI, 0.561–0.820). (d) ROC plot for eroded cortex (C2+C3) in detecting reduced BMD: estimated sensitivity, 0.789 (SE 0.031; 95% CI, 0.721–0.843); estimated specificity, 0.562 (SE 0.047; 95% CI, 0.47–0.651). (e) ROC plot for eroded cortex (C2+C3) in detecting osteoporosis: estimated sensitivity, 0.806 (SE 0.105; 95% CI, 0.528–0.9200); estimated specificity, 0.643 (SE 0.109; 95% CI, 0.417–0.820).
Most of the studies evaluating MCW considered its accuracy in detecting reduced BMD (T score <–1) instead of osteoporosis. The estimated sensitivity and specificity for 3 ≤ MCW ≥ 4 mm in detecting reduced BMD were respectively 0.42 (SE 0.168; 95% CI, 0.158–0.737) and 0.93 (SE 0.042; 95% CI, 0.79–0.979) when a cutoff of ≤3.69 mm was adopted in Marandi et al. (2010). These values changed respectively to 0.43 (SE 0.164; 95% CI, 0.168–0.737) and 0.905 (SE 0.041; 95% CI, 0.789–0.960) when a cutoff of ≥4 mm was used (Fig. 6a, a2). The estimated sensitivity and specificity for 4 < MCW > 5 mm in detecting reduced BMD were respectively 0.602 (SE 0.101; 95% CI, 0.398–0.775) and 0.708 (SE 0.064; 95% CI, 0.568–0.817) (Fig. 6b). The forest plot obtained for MCW <3 mm is reported in Figure 5, while it was not possible to perform a meta-analysis for a cutoff >5 mm.
The estimated sensitivity and specificity for PMI ≤0.3 in detecting reduced BMD were, respectively, 0.723 (SE 0.160; 95% CI, 0.352–0.926) and 0.733 (SE 0.066; 95% CI, 0.587–0.841) when considering a cutoff value of ≤0.32 in Marandi et al. (2010). When a cutoff value of ≤0.33 was adopted for Marandi et al. (2010), the estimated sensitivity and specificity changed to 0.729 (SE 0.167; 95% CI, 0.338–0.934) and 0.707 (SE 0.067; 95% CI, 0.561–0.820), respectively (Fig. 6c, c2).
The presence of any kind of mandibular cortical erosion (C2+C3) had an estimated sensitivity and specificity in detecting reduced BMD of 0.789 (SE 0.031; 95% CI, 0.721–0.843) and 0.562 (SE 0.047; 95% CI, 0.47–0.651) (Fig. 6d), respectively. The sensitivity and specificity in detecting osteoporosis were 0.806 (SE 0.105; 95% CI, 0.528–0.9200) and 0.643 (SE 0.109; 95% CI, 0.417–0.820), respectively (Fig. 6e).
Discussion
Different linear and qualitative panoramic morphometric indices have been proposed as diagnostic tools for reduced BMD, with a wide heterogeneity in the reported results. The advantage of these indices is that dental practitioners could use them as easy and low-cost tools to detect early signs of osteopenia/osteoporosis. However, the accuracy and applicability of these indices should be very carefully considered, since the demographics of the included studies are heterogeneous in relation to sex, age, and menopause status, and a wide range of cutoffs has been reported (especially for MCW). Moreover, the average methodological quality of the studies is low, since we found no study complying with all 4 QUADAS domains, and there was a low risk of bias in 3 of 4 domains in only 9 studies (Figs. 3–4 and Appendix Table 5). Despite all these limitations, it seems that all 3 most reported indices (MCW, PMI, and KI) could be useful tools to screen for reduced BMD.
Regardless of the cutoff value adopted, MCW had a better accuracy in excluding the presence of reduced bone density (specificity), rather than detecting people with reduced BMD (sensitivity). Since the manual measurement of MCW can introduce bias related to the operator, some studies adopted semi- or totally computer-driven techniques (Arifin et al. 2006; Allen et al. 2007; Roberts et al. 2010; Kavitha et al. 2012a, 2012b; Kavitha et al. 2013; Muramatsu et al. 2013; Roberts et al. 2013). However, in the large OSTEODENT multicenter study (Devlin et al. 2007; Karayianni et al. 2007), the accuracy of MCW <3 mm in detecting osteoporosis at either spine or femur did not significantly change in relation to the technique adopted (manual vs. semi-automatic computer method).
Five studies were included in the meta-analysis for accuracy of PMI in detecting reduced BMD. All these studies considered almost an identical cutoff (≤0.3), giving an estimated sensitivity and specificity slightly higher than 70%. With the exception of 2 studies (Gulsahi et al. 2009; Gulsahi et al. 2010), all the remaining ones measured PMI only in women, with 2 studies including only postmenopausal women, thus introducing a possible source of bias due to patient selection. Gulsahi et al. (2009, 2010) and Khojastehpour et al. (2009) supported the high reproducibility of this index, reporting an excellent intraobserver agreement and a good to excellent interobserver agreement. The estimated sensitivities for PMI in these 5 studies were moderately heterogeneous, but the estimated specificities presented an almost perfect overlap of confidence intervals (Fig. 5), thus making the summary estimates of the meta-analysis pretty reliable.
Linear measurements taken on panoramic radiographs share limitations mainly related to unequal magnification and geometric distortion. Apart from differences in exposure parameters and settings between different equipment, the same machine can produce a different magnification in relation to the patient position, and the magnification can also change between different parts of the same radiograph (Schulze et al. 2000; Pfeiffer et al. 2012).
Eleven studies considered the accuracy of the KI in detecting reduced BMD, with rather homogeneous results (Appendix Table 4). From the meta-analysis, we inferred that approximately 80% of people with either moderate or severe erosion of the mandibular cortex are at least osteopenic. It is still controversial, however, if we should consider only severely eroded cortexes (C3) or also moderately eroded cortexes (C2) to screen for osteoporosis, since only a few studies calculated the diagnostic performance of C3 and we were not able to perform a meta-analysis.
Concerns have been raised regarding the experience/training of the observers and the intra- and interobserver agreement when measuring panoramic indices (especially qualitative indices such as KI) (Jowitt et al. 1999; Devlin et al. 2001; Yasar et al. 2009). Nakamoto et al. (2003) reported no significant differences in the values of sensitivity and specificity between nontrained general dental practitioners (GDPs) with sufficient intraobserver agreement (κ ≥ 0.41) and with insufficient intraobserver agreement (κ < 0.41). No correlation between the length of GDP experience and their diagnostic performance was also reported. A few years later, the same group evaluated the diagnostic performance of 60 specialists in different oral fields who were previously given instructions to calculate the KI (Taguchi et al. 2008). They found significantly higher positive and negative predictive values to screen for osteoporosis for observers with a high intraobserver agreement (κ > 0.6), in comparison with observers with an insufficient intraobserver agreement (κ ≤ 0.6). At the same time, a better diagnostic performance was detected for observers specialized in oral radiology. As a confirmation of the importance of intraobserver agreement, Taguchi et al. (2008) observed that the highest levels of sensitivity and specificity (92% and 55.4%, respectively) were reported by the 5 observers with κ > 0.8.
As none of the indices evaluated in this review has a perfect sensitivity and specificity in detecting osteopenia or osteoporosis, it has been proposed to combine them with clinical indices to increase their accuracy. In the multicenter OSTEODENT study, a clinical test (osteoporosis index of risk [OSIRIS]) (Sedrine et al. 2002) that takes into consideration age, weight, use of hormone replacement therapy, and history of fracture was combined with either KI or MCW. As a result, the overall area under the ROC curve improved, and in particular, the combination of OSIRIS with a panoramic index increased the specificity, which means that fewer healthy patients would be referred for DXA (Horner et al. 2007; Karayianni et al. 2007). Other studies have successfully combined different panoramic indices together (Klemetti et al. 1994; Nakamoto et al. 2003; Miranda 2011; Miranda et al. 2012) or with bone mass index (BMI) (Horner et al. 2002).
Too little data are available regarding other linear and qualitative indices, and no study has considered indices in the upper jaw. The large amount of trabecular bone and the relatively low cortical bone thickness of the maxilla make it a potentially more sensitive site for early detection of osteoporosis. However, the lack of stable referral points (like the mental foramen in the mandible) and the superimposition of other anatomical structures make it difficult to take reliable measurements in the upper jaw.
A fair amount of work has also been published on trabecular-pattern measurement methods to predict for reduced BMD, but it is beyond the aims of this review to discuss it.
Conclusions
From the current evidence, it is not recommended to prescribe a panoramic radiograph with the aim to intercept patients with osteopenia/osteoporosis. However, when a pantomograph is available, MCW, PMI, and KI can be helpful in intercepting patients at risk of reduced BMD.
According to our findings and within the limitations previously described, PMI with a cutoff value of 0.3 seems the most accurate linear index to screen for reduced BMD.
Less strong conclusions can be drawn for MCW. However, the meta-analysis revealed that MCW is more useful to exclude high risk for low BMD, since in 90% of the cases patients with a cortical width wider than 4 mm have a normal BMD.
The presence of any kind of cortical erosion (KI) can be considered a useful indicator of reduced BMD, since in approximately 80% of the cases it is associated with at least osteopenia. However, the risk of bias related to the subjectivity of a qualitative measurement such as KI needs to be taken into account.
Future studies on standardized panoramic radiographs and controlling for magnification/distortion are needed to draw more reliable and precise conclusions on the accuracy of panoramic indices in detecting reduced skeletal bone density. In particular, it would be advisable to focus on the ability of these indices in detecting osteoporosis, since osteopenia, although important to detect, should not be considered a disease category (Kanis et al. 2013). It would be also interesting to further investigate the possibility of combining different indices with clinical parameters.
Author Contributions
E. Calciolari, contributed to design, data acquisition, analysis, and interpretation, drafted the manuscript; N. Donos, contributed to conception, critically revised the manuscript; J.C. Park, contributed to data acquisition, analysis, and interpretation, drafted the manuscript; A. Petrie, contributed to meta-analysis and data interpretation, critically revised the manuscript; N. Mardas, contributed to conception and design, critically revised the manuscript. All authors gave final approval and agree to be accountable for all aspects of the work.
Supplementary Material
Footnotes
A supplemental appendix to this article is published electronically only at http://jdr.sagepub.com/supplemental.
This review was awarded the Goldman award for clinical research 2014 by the Italian Society of Periodontology (SIdP).
The authors received no financial support and declare no potential conflicts of interest with respect to the authorship and/or publication of this article.
References
- Al-Dam A, Blake F, Atac A, Amling M, Blessmann M, Assaf A, Hanken H, Smeets R, Heiland M. 2013. Mandibular cortical shape index in non-standardised panoramic radiographs for identifying patients with osteoporosis as defined by the German Osteology Organization. J Craniomaxillofac Surg. 41(7):e165–e169. [DOI] [PubMed] [Google Scholar]
- Allen PD, Graham J, Farnell DJ, Harrison EJ, Jacobs R, Nicopolou-Karayianni K, Lindh C, van der Stelt PF, Horner K, Devlin H. 2007. Detecting reduced bone mineral density from dental radiographs using statistical shape models. IEEE Trans Inf Technol Biomed. 11(6):601–610. [DOI] [PubMed] [Google Scholar]
- Alonso MB, Ambrosano GM, Watanabe PC, Haiter-Neto F. 2012. Assessment of panoramic mandibular index and morphological analysis of mandibular cortical bone in a Brazilian population. Osteoporos Int. 23:S484–S485. [Google Scholar]
- Arifin AZ, Asano A, Taguchi A, Nakamoto T, Ohtsuka M, Tsuda M, Kudo Y, Tanimoto K. 2006. Computer-aided system for measuring the mandibular cortical width on dental panoramic radiographs in identifying postmenopausal women with low bone mineral density. Osteoporos Int. 7(5):753–759. [DOI] [PubMed] [Google Scholar]
- Benson BW, Prihoda TJ, Glass BJ. 1991. Variations in adult cortical bone mass as measured by a panoramic mandibular index. Oral Surg Oral Med Oral Pathol. 71(3):349–356. [DOI] [PubMed] [Google Scholar]
- Bras J, van Ooij CP, Abraham-Inpijn L, Kusen GJ, Wilmink JM. 1982. Radiographic interpretation of the mandibular angular cortex: a diagnostic tool in metabolic bone loss. Part I. Normal state. Oral Surg Oral Med Oral Pathol. 53(5):541–545. [DOI] [PubMed] [Google Scholar]
- Consensus development conference: diagnosis, prophylaxis, and treatment of osteoporosis. 1993. Am J Med. 94(6):646–650. [DOI] [PubMed] [Google Scholar]
- Damilakis J, Vlasiadis K. 2011. Have panoramic indices the power to identify women with low BMD at the axial skeleton? Phys Med. 27(1):39–43. [DOI] [PubMed] [Google Scholar]
- Devlin H, Allen PD, Graham J, Jacobs R, Karayianni K, Lindh C, van der Stelt PF, Harrison E, Adams JE, Pavitt S, et al. 2007. Automated osteoporosis risk assessment by dentists: a new pathway to diagnosis. Bone. 40(4):835–842. [DOI] [PubMed] [Google Scholar]
- Devlin CV, Horner K, Devlin H. 2001. Variability in measurement of radiomorphometric indices by general dental practitioners. Dentomaxillofac Radiol. 30(2):120–125. [DOI] [PubMed] [Google Scholar]
- Drozdzowska B, Pluskiewicz W, Tarnawska B. 2002. Panoramic-based mandibular indices in relation to mandibular bone mineral density and skeletal status assessed by dual energy X-ray absorptiometry and quantitative ultrasound. Dentomaxillofac Radiol. 31(6):361–367. [DOI] [PubMed] [Google Scholar]
- Erdogan O, Incki KK, Benlidayi ME, Seydaoglu G, Kelekci S. 2009. Dental and radiographic findings as predictors of osteoporosis in postmenopausal women. Geriatr Gerontol Int. 9(2):155–164. [DOI] [PubMed] [Google Scholar]
- Ezoddini Ardakani F, Owlia M, Hesami S, Hosseini P. 2013. Digital panoramic radiography as a useful tool for detection of bone loss: a comparative study. Acta Med Iran. 51(2):94–100. [PubMed] [Google Scholar]
- Ferreira Leite A, de Souza Figueiredo PT, Ramos Barra F, Santos de Melo N, de Paula AP. 2011. Relationships between mandibular cortical indexes, bone mineral density, and osteoporotic fractures in Brazilian men over 60 years old. Oral Surg Oral Med Oral Pathol Oral Radiol Endod. 112(5):648–656. [DOI] [PubMed] [Google Scholar]
- Gaur B, Chaudhary A, Wanjari PV, Sunil M, Basavaraj P. 2013. Evaluation of panoramic radiographs as a screening tool of osteoporosis in post menopausal women: a cross sectional study. J Clin Diagn Res. 7(9):2051–2055. [DOI] [PMC free article] [PubMed] [Google Scholar]
- Gluer CC, Jergas M, Hans D. 1997. Peripheral measurement techniques for the assessment of osteoporosis. Semin Nucl Med. 27(3):229–247. [DOI] [PubMed] [Google Scholar]
- Gulsahi A, Ozden S, Cebeci AI, Kucuk NO, Paksoy CS, Genc Y. 2009. The relationship between panoramic radiomorphometric indices and the femoral bone mineral density of edentulous patients. Oral Radiol. 25:47–52. [Google Scholar]
- Gulsahi A, Paksoy CS, Ozden S, Kucuk NO, Cebeci AR, Genc Y. 2010. Assessment of bone mineral density in the jaws and its relationship to radiomorphometric indices. Dentomaxillofac Radiol. 39(5):284–289. [DOI] [PMC free article] [PubMed] [Google Scholar]
- Halling A, Persson GR, Berglund J, Johansson O, Renvert S. 2005. Comparison between the Klemetti index and heel DXA BMD measurements in the diagnosis of reduced skeletal bone mineral density in the elderly. Osteoporos Int. 16(8):999–1003. [DOI] [PubMed] [Google Scholar]
- Hernlund E, Svedbom A, Ivergård M, Compston J, Cooper C, Stenmark J, McCloskey EV, Jönsson B, Kanis JA. 2013. Osteoporosis in the European Union: medical management, epidemiology and economic burden. A report prepared in collaboration with the International Osteoporosis Foundation (IOF) and the European Federation of Pharmaceutical Industry Associations (EFPIA). Arch Osteoporos. 8(1–2):136. [DOI] [PMC free article] [PubMed] [Google Scholar]
- Horner K, Devlin H. 1998. The relationship between mandibular bone mineral density and panoramic radiographic measurements. J Dent. 26(4):337–343. [DOI] [PubMed] [Google Scholar]
- Horner K, Devlin H, Harvey L. 2002. Detecting patients with low skeletal bone mass. J Dent. 30(4):171–175. [DOI] [PubMed] [Google Scholar]
- Horner K, Karayianni K, Mitsea A, Berkas L, Mastoris M, Jacobs R, Lindh C, van der Stelt P, Marjanovic E, Adams J, Pavitt S, et al. 2007. The mandibular cortex on radiographs as a tool for osteoporosis risk assessment: the OSTEODENT Project. J Clin Densitom. 10(2):138–146. [DOI] [PubMed] [Google Scholar]
- Ishii K, Taguchi A, Nakamoto T, Ohtsuka M, Sutthiprapaporn P, Tsuda M, Kodama I, Kudo Y, Sumida H, Suei Y, et al. 2007. Diagnostic efficacy of alveolar bone loss of the mandible for identifying postmenopausal women with femoral osteoporosis. Dentomaxillofac Radiol. 36(1):28–33. [DOI] [PubMed] [Google Scholar]
- Jowitt N, MacFarlane T, Devlin H, Klemetti E, Horner K. 1999. The reproducibility of the mandibular cortical index. Dentomaxillofac Radiol. 28(3):141–144. [DOI] [PubMed] [Google Scholar]
- Kanis JA, Burlet N, Cooper C, Delmas PD, Reginster JY, Borgstrom F, Rizzoli R; European Society for Clinical and Economic Aspects of Osteoporosis and Osteoarthritis (ESCEO). 2008. European guidance for the diagnosis and management of osteoporosis in postmenopausal women. Osteoporos Int. 19(4):399–428. [DOI] [PMC free article] [PubMed] [Google Scholar]
- Kanis JA, McCloskey EV, Johansson H, Cooper C, Rizzoli R, Reginster JY; Scientific Advisory Board of the European Society for Clinical and Economic Aspects of Osteoporosis and Osteoarthritis (ESCEO) and the Committee of Scientific Advisors of the International Osteoporosis Foundation (IOF). 2013. European guidance for the diagnosis and management of osteoporosis in postmenopausal women. Osteoporos Int. 24(1):23–57. [DOI] [PMC free article] [PubMed] [Google Scholar]
- Karayianni K, Horner K, Mitsea A, Berkas L, Mastoris M, Jacobs R, Lindh C, van der Stelt PF, Harrison E, Adams JE, et al. 2007. Accuracy in osteoporosis diagnosis of a combination of mandibular cortical width measurement on dental panoramic radiographs and a clinical risk index (OSIRIS): the OSTEODENT project. Bone. 40(1):223–239. [DOI] [PubMed] [Google Scholar]
- Kavitha MS, Asano A, Taguchi A, Heo MS. 2013. The combination of a histogram-based clustering algorithm and support vector machine for the diagnosis of osteoporosis. Imaging Sci Dent. 43(3):153–161. [DOI] [PMC free article] [PubMed] [Google Scholar]
- Kavitha MS, Asano A, Taguchi A, Kurita T, Sanada M. 2012a. Diagnosis of osteoporosis from dental panoramic radiographs using the support vector machine method in a computer-aided system. BMC Med Imaging. 12:1. [DOI] [PMC free article] [PubMed] [Google Scholar]
- Kavitha MS, Samopa F, Asano A, Taguchi A, Sanada M. 2012b. Computer-aided measurement of mandibular cortical width on dental panoramic radiographs for identifying osteoporosis. J Investig Clin Dent. 3(1):36–44. [DOI] [PubMed] [Google Scholar]
- Khojastehpour L, Shahidi SH, Barghan S, Aflaki E. 2009. Efficacy of panoramic mandibular index in diagnosing osteoporosis in women. J Dent Theran Univ Med Sci. 6(1):11–15. [Google Scholar]
- Kim J, Nah K, Jung Y. 2004. Comparison of panorama radiomorphometric indices of the mandible in normal and osteoporotic women. Korean J Oral Maxillofac Radiol. 34(2):69–74. [Google Scholar]
- Klemetti E, Kolmakov S, Kroger H. 1994. Pantomography in assessment of the osteoporosis risk group. Scand J Dent Res. 102(1):68–72. [DOI] [PubMed] [Google Scholar]
- Ledgerton D, Horner K, Devlin H, Worthington H. 1999. Radiomorphometric indices of the mandible in a British female population. Dentomaxillofac Radiol. 28(3):173–181. [DOI] [PubMed] [Google Scholar]
- Lee K, Taguchi A, Ishii K, Suei Y, Fujita M, Nakamoto T, Ohtsuka M, Sanada M, Tsuda M, Ohama K, et al. 2005. Visual assessment of the mandibular cortex on panoramic radiographs to identify postmenopausal women with low bone mineral densities. Oral Surg Oral Med Oral Pathol Oral Radiol Endod. 100(2):226–231. [DOI] [PubMed] [Google Scholar]
- Leite AF, Figueiredo PT, Guia CM, Melo NS, de Paula AP. 2010. Correlations between seven panoramic radiomorphometric indices and bone mineral density in postmenopausal women. Oral Surg Oral Med Oral Pathol Oral Radiol Endod. 109(3):449–456. [DOI] [PubMed] [Google Scholar]
- López-López J, Estrugo-Devesa A, Jane-Salas E, Ayuso-Montero R, Gómez-Vaquero C. 2011. Early diagnosis of osteoporosis by means of orthopantomograms and oral X-rays: a systematic review. Med Oral Patol Oral Cir Bucal. 16(7):e905–e913. [DOI] [PubMed] [Google Scholar]
- Macaskill P, Gatsonis C, Deeks JJ, Harbord RM, Takwoingi Y. 2010. Analysing and presenting results. In: Deeks JJ, Bossuyt PM, Gatsonis C, editors. Cochrane handbook for systematic reviews of diagnostic test accuracy version 1.0. The Cochrane Collaboration [accessed 2013 Dec 13]. http://srdta.cochrane.org/.
- Mahl C, Licks R, Fontanella VR. 2008. Comparação de índices morfométricos obtidos na radiografia odontológica panorâmica na identificação de indivíduos com osteoporose/osteopenia. Radiol Bras. 41(3):183–187. [Google Scholar]
- Mansour S, Alghamdi AS, Javed F, Marzouk H, Khan EA. 2013. Panoramic radiomorphometric indices as reliable parameters in predicting osteoporosis. Am J Med Sci. 346(6):473–478. [DOI] [PubMed] [Google Scholar]
- Marandi S, Bagherpour A, Imanimoghaddam M, Hatef M, Haghighi A. 2010. Panoramic-based mandibular indices and bone mineral density of femoral neck and lumbar vertebrae in women. J Dent (Tehran). 7(2):98–106. [PMC free article] [PubMed] [Google Scholar]
- Miranda LF. 2011. Estabelecimento de um índice quantitativo e qualitativo para auxiliar no diagnóstico da osteoporose em radiografia panorâmica. São Paulo (Brazil): Faculdade de Odontologia da Universidade de São Paulo; [accessed 2014 Sep 16]. http://bvsalud.org/portal/resource/en/bbo-38454. [Google Scholar]
- Miranda LF, Arita ES, Watanabe PA, Caputo BV, Pereira EC, Marques AP. 2012. Establishment of a quantitative and qualitative index for the diagnosis of osteoporosis in panoramic radiography. London (UK): Springer; p. S163–S164. [Google Scholar]
- Moher D, Liberati A, Tetzlaff J, Altman DG; PRISMA Group. 2009. Preferred reporting items for systematic reviews and meta-analyses: the PRISMA statement. Int J Surg. 8(5):336–341. [DOI] [PubMed] [Google Scholar]
- Muramatsu C, Matsumoto T, Hayashi T, Hara T, Katsumata A, Zhou X, Iida Y, Matsuoka M, Wakisaka T, Fujita H. 2013. Automated measurement of mandibular cortical width on dental panoramic radiographs. Int J Comput Assist Radiol Surg. 8(6):877–885. [DOI] [PubMed] [Google Scholar]
- Nakamoto T, Taguchi A, Ohtsuka M, Suei Y, Fujita M, Tanimoto K, Tsuda M, Sanada M, Ohama K, Takahashi J, et al. 2003. Dental panoramic radiograph as a tool to detect postmenopausal women with low bone mineral density: untrained general dental practitioners’ diagnostic performance. Osteoporos Int. 14(8):659–664. [DOI] [PubMed] [Google Scholar]
- Ortman LF, Hausmann E, Dunford RG. 1989. Skeletal osteopenia and residual ridge resorption. J Prosthet Dent. 61(3):321–325. [DOI] [PubMed] [Google Scholar]
- Passos JS, Gomes Filho IS, Sarmento VA, Sampaio DS, Gonçalves FP, Coelho JM, Cruz SS, Trindade SC, Cerqueira EM. 2012. Women with low bone mineral density and dental panoramic radiography. Menopause. 19(6):704–709. [DOI] [PubMed] [Google Scholar]
- Pfeiffer P, Bewersdorf S, Schmage P. 2012. The effect of changes in head position on enlargement of structures during panoramic radiography. Int J Oral Maxillofac Implants. 27(1):55–63. [PubMed] [Google Scholar]
- Reitsma JB, Rutjes AWS, Whiting P, Vlassov VV, Leeflang MMG, Deeks JJ. 2009. Assessing methodological quality. In: Deeks JJ, Bossuyt PM, Gatsonis C, editors. Cochrane handbook for systematic reviews of diagnostic test accuracy version 1.0.0. The Cochrane Collaboration [accessed 2009 Oct 27]. http://srdta.cochrane.org/.
- Renvert S, Berglund J, Persson RE, Persson GR. 2011. Osteoporosis and periodontitis in older subjects participating in the Swedish National Survey on Aging and Care (SNAC-Blekinge). Acta Odontol Scand. 69(4):201–207. [DOI] [PubMed] [Google Scholar]
- Roberts M, Graham J, Devlin H. 2010. Improving the detection of osteoporosis from dental radiographs using active appearance models. In: Proceedings of the 2010 IEEE International Conference on Biomedical Imaging: From nano to macro Piscataway (NJ): IEEE Press p. 440–443. [Google Scholar]
- Roberts MG, Graham J, Devlin H. 2013. Image texture in dental panoramic radiographs as a potential biomarker of osteoporosis. IEEE Trans Biomed Eng. 60(9):2384–2392. [DOI] [PubMed] [Google Scholar]
- Schulze R, Krummenauer F, Schalldach F, d’Hoedt B. 2000. Precision and accuracy of measurements in digital panoramic radiography. Dentomaxillofac Radiol. 29(1):52–56. [DOI] [PubMed] [Google Scholar]
- Sedrine WB, Chevallier T, Zegels B, Kvasz A, Micheletti MC, Gelas B, Reginster JY. 2002. Development and assessment of the Osteoporosis Index of Risk (OSIRIS) to facilitate selection of women for bone densitometry. Gynecol Endocrinol. 16(3):245–250. [PubMed] [Google Scholar]
- Sutthiprapaporn P, Taguchi A, Nakamoto T, Ohtsuka M, Mallick PC, Tsuda M, Kodama I, Kudo Y, Suei Y, Tanimoto K. 2006. Diagnostic performance of general dental practitioners after lecture in identifying post-menopausal women with low bone mineral density by panoramic radiographs. Dentomaxillofac Radiol. 35(4):249–252. [DOI] [PubMed] [Google Scholar]
- Taguchi A, Asano A, Ohtsuka M, Nakamoto T, Suei Y, Tsuda M, Kudo Y, Inagaki K, Noguchi T, Tanimoto K, and others. 2008. Observer performance in diagnosing osteoporosis by dental panoramic radiographs: results from the Osteoporosis Screening Project in Dentistry (OSPD). Bone. 43(1):209–213. [DOI] [PubMed] [Google Scholar]
- Tugnait A, Clerehugh V, Hirschmann PN. 2003. Radiographic equipment and techniques used in general dental practice: a survey of general dental practitioners in England and Wales. J Dent. 31(3):197–203. [DOI] [PubMed] [Google Scholar]
- Whiting PF, Rutjes AW, Westwood ME, Mallett S, Deeks JJ, Reitsma JB, Leeflang MM, Sterne JA, Bossuyt PM; QUADAS-2 Group. 2011. QUADAS-2: a revised tool for the quality assessment of diagnostic accuracy studies. Ann Intern Med. 155(8):529–536. [DOI] [PubMed] [Google Scholar]
- Yasar F, Sener S, Yesilova E, Akgünlü F. 2009. Mandibular cortical index evaluation in masked and unmasked panoramic radiographs. Dentomaxillofac Radiol. 38(2):86–91. [DOI] [PubMed] [Google Scholar]
Associated Data
This section collects any data citations, data availability statements, or supplementary materials included in this article.