Abstract
Metabolome, a total profile of whole metabolites, is placed on downstream of proteome. Metabolome is thought to be results of implementation of genomic information. In other words, metabolome can be called as high resolution phenotype. The easiest operation of metabolomics is the integration to the upstream ome information including transcriptome and/or proteome. Those trials have been reported at a certain scientific level. In addition, metabolomics can be operated in stand-alone mode without any other ome information. Among metabolomics tactics, the author’s group is particularly focusing on metabolic fingerprinting, in which metabolome information is employed as explanatory variant to evaluate response variant. Metabolic fingerprinting technique is expected not only for analyzing slight difference depending on genotype difference but also for expressing dynamic variation of living organisms. The author introduces several good examples which he performed. Those are useful for easy understanding of the power of metabolomics. In addition, the author mentions the latest technology for analysis of metabolic dynamism. The author’s group developed a facile analytical method for semi-quantitative metabolic dynamism. The author introduces the novel method that uses time dependent variation of isotope distribution based on stable isotope dilution.
Keywords: metabolomics, metabolic fingerprinting, multi variate analysis, quantitative phenotype
INTRODUCTION
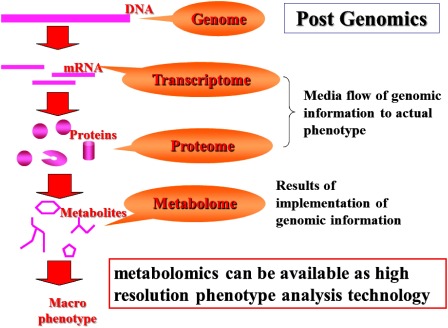
Genome is thought to be a blueprint of life. Therefore fate of organisms should be almost decided by own genomic information. However, genomic information would not be sufficient to explain all features of organisms. Genome science has developed explosively since the end of the last century. The contribution of genome to life science is extremely high but one of the biggest findings was found to be far from the perfect elucidation of the mystery of life, even if the whole genome sequence information would be available. Contribution of genetic trait becomes lower as the higher organisms. On the other hand, the impact of acquired characteristics would become more important. Even in identical twins, their health condition might differ depending on difference of living environments. Some information downstream of the genome is important for the understanding acquired trait. Genomic information is implemented through both “proteome and transcriptome.” Therefore this dynamic ome information would be essential for elucidation of trans-genes expression network. However, both dynamic ome information would not be sufficient for direct understanding of acquired characteristics. Metabolome, a total profile of whole metabolites, is placed on downstream of proteome. Metabolome is thought to be results of implementation of genomic information. In other words, metabolome can be called as high resolution phenotype. Metabolome is expected to contribute to understanding acquired phenotype (Fig. 1).
Fig. 1. Metabolomics in postgenomic era.
Methods for metabolome analysis are not especially restricted. Mass spectrometry, FT-NMR, FT-NIR and the other technology are available. Among them, mass spectrometry is often used for both quantitative and qualitative analysis because of its resolution and sensitivity. Some separation tactics including gas chromatography, liquid chromatography, supercritical fluid chromatography, capillary electrophoresis, are usually hyphenated prior to mass spectrometry. The author’s group is conducting these mass spectrometry systems to yield high quality metabolome. Data mining from those metabolome information, some metabolites clue which might be significant for elucidation of complicated phenotype can be found. In case of utilization for metabolomics, mass spectrometry is employed in particular fashion that is different from usual protocol. Analysis of raw mass spectrometry data is rather difficult due to lack of de-facto standard protocol. In the metabolomics analysis, huge number of metabolites should be analyzed. Therefore, manual validation should be required to reduce both false-positive and false-negative annotation. However, the verified results might be floating depending on the level of the skill of analysts. That means de-facto standard analytical methods would be required. The author’s group has been developed several useful methodology for mass spectrometry based metabolome analysis.
The other useful methods have been also developed.1–6) The review is useful for understanding the current metabolomics technology advances.7) Any kinds of materials can be subjected to metabolomics driven phenotype analysis. Animal, plant, microorganisms, and the other living organisms can be subjected to metabomics study. The recent application research of metabolomics are well documented in the review.8) The author introduces several good examples which he performed. Those are useful for easy understanding of the power of metabolomics.
A PRINCIPLE OF “METABOLIC FINGERPRINTING”
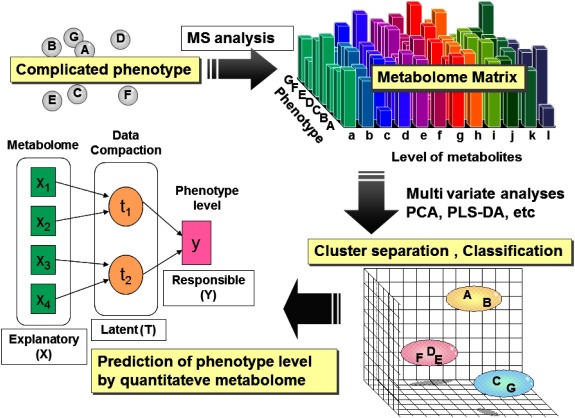
The easiest operation of metabolomics is the integration to the upstream ome information including transcriptome and/or proteome. Those trials have been reported at a certain scientific level. In addition, metabolomics can be operated in stand-alone mode without any other ome information. Among metabolomics tactics, the author’s group is particularly focusing on metabolic fingerprinting, in which metabolome information is employed as explanatory variant to evaluate response variant. In the previous context, response variants mean quantitative phenotype level. The concept of metabolic fingerprinting is summarized in Fig. 2.
Fig. 2. Concept of metabolic fingerprinting.
Metabolic fingerprinting technique is expected not only for analyzing slight difference depending on genotype difference but also for expressing dynamic variation of living organisms. The following subjects are an easy understandable application of metabolic fingerprinting in stand-alone mode. The author addressed a simple question that is “Is it possible to express an early development of animal by means of metabolomics techniques?” To prove the hypothesis, the time course series of early developmental embryos of zebra fish (Danio rerio) prepared by artificial fertilization were extracted to obtain hydrophilic small molecular weight metabolites. The extracts containing hydrophilic metabolites were subjected to GC/MS analysis after appropriate derivatization including sylilation. The metabolites table matrix was organized from mass spectrometry data to be subjected to principal component analysis (PCA). PCA score plot indicated PC1 vector clearly correlated developmental stage of zebra fish. Next partial least square projection to the latent structure regression (PLS regression) was performed to establish a prediction model of zebra fish developmental stage. In the model construction, “metabolome information” and “time after fertilization” were used as “explanatory variant” and “response variant” respectively. As a result, the high performance prediction model of developmental stage of zebra fish was successfully established with high fitting9) (Fig. 3).
Fig. 3. Prediction model of zebra fish developmental stage by means of metabolic fingerprinting.
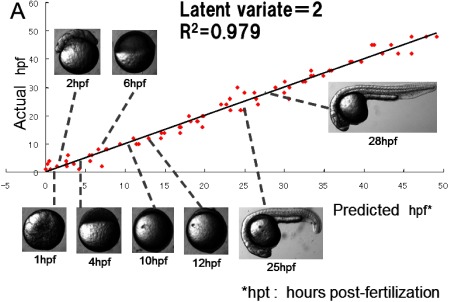
Similar experiments would be applicable to the other experimental model animals. For example, the authors successfully established the similar prediction model of developmental stage using a nematoda (Caenorhabditis elegans) and a fruit fly (Drosophila melanogaster).10) The present methodology or “metabolic fingerprinting” would be potentially useful to explain the early development dynamism of lower animal. The author addressed whether the present methodology might be applicable for higher animals. To prove the above-mentioned hypothesis, some trials of “estimation of disease class” and “evaluation of degree of seriousness” using cancer patient bio-fluids were trialed. In this occasion, biological fluid of patient including serum, plasma, urine and something like that would be used for the sample of metabolome analysis. One of the most promising applications is clinical diagnosis. The author and the research collaborators have previously reported some successfully bio-marker screening for early diagnosis of human cancers including pancreas cancer, lung cancer, stomach cancer etc.11–13)
STRATEGIC SEEKING OF LIFE-SPAN RELATED GENES OF BUDDING YEAST
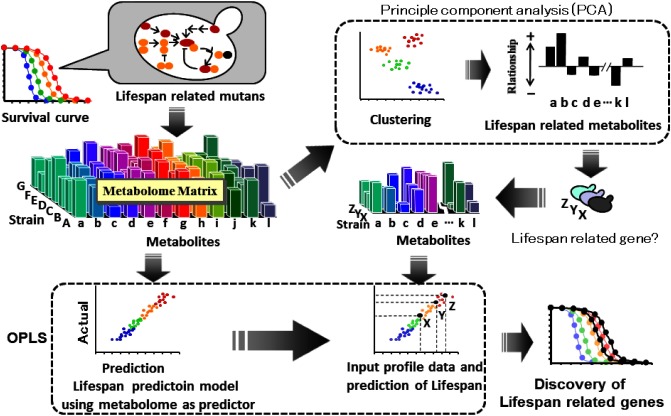
Application area of metabolic fingerprinting is very widely spread. The technology would be applicable to analysis of complicated quantitative phenotype in which multiple genes might synergistically participate. The author regarded replicative life-span of budding yeast (Saccharomyces cerevisiae) as an example of a quantitative and complicated phenotype in which multiple genes might concern. The semi-rational strategic seeking of “life-span related mutants” by means of metabolic fingerprinting was conducted using the experimental model. The strategy is summarized in Fig. 4.
Fig. 4. Strategy of semi-rational strategic seeking of life-span related genes in yeast.
First both long life-span mutants and short life-span mutants were cultivated respectively in complete media. The cells in log phase were subjected to metabolome analysis. Several trials including exclusion of considerably varying variables, pre-processing and transform of matrix before multi-variate analysis were performed. Finally orthogonal partial least square projection to the latent structure regression (OPLS regression) was performed to successfully establish a prediction model of yeast life-span using metabolome as explanatory variant.
Moreover the metabolome matrix was subjected to principal component analysis (PCA). An obtained principal component loading information suggested some amino acids correlated to life-span. For example, increment of some glutamate group amino acids including proline, glutamine and histidine might be involved in extension of life-span. A down-regulation of “degradation of glutamate” would be one of the promising strategies to tenderly increase pool size of glutamate group amino acids. Uga3 is a transcriptional factor that up-regulates glutamate degradation system. A knock out mutant of Uga3 gene showed remarkable extension of lifespan with 75% increment. These results suggest Uga3 is a life-span related gene. Aspartate group amino acids including methionine were also positively correlated to lifespan. Fzf1 is a positive regulator of sulfite excretion. Down regulation of “sulfite excretion” might contribute to increment of methionine pool size. A knock out mutant of Fzf1 also showed significant extension of life span with 64% increment. Based on the similar tactics, several life spans related mutants were easily prepared.
Among the mutants, life-span range was “75% up” or less and “78% down” or more.14)
“By the way, phenotype in the conventional genetics has been defined as a ‘qualitative’ feature, but not ‘quantitative’ one.” Therefore classical phenotype analysis is similar to a “yes/no” problem about existence of quantitative phenotype. That means it is difficult to seek quantitative phenotype. Life-span can be thought to be definitely quantitative phenotype. Such quantitative phenotype is becoming more and more important for understanding of human disease. Metabolomics driven phenotype analysis should be employed in such occasion.
Recently, the author’s group conducted metabolome analysis of a group that was estimated to be transcriptional regulatory factor-related mutant strains by using the mutant library of budding yeast. And succeeded in identifying genes involved in retro grade pathway of mitochondria.15,16) These successes indicate a potential of metabolomics for analysis of complicated quantitative phenotypes in which multiple genes might concern.
APPLICATION TO QUANTITATIVE ANALYSIS OF FOOD SECONDARY FUNCTION
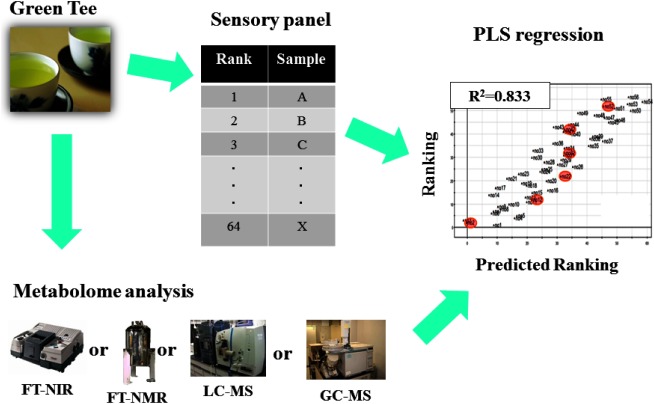
Food is multi-functional commodity consisting of multiple components. It is difficult to elucidate component-to-function relationship. Particularly it is almost impossible in case of food secondary function, or sensory quality. Even in case of functional food analysis, a conventional reductionism driven study cannot reveal mechanism of food function exhaustively. Recently Japan foods are being expected as strong exporting commodity based on high performance Japan brand. To establish Japan position of food exporting country, it is essential to ensure the outstanding food quality control system of Japan. The required specifications for quality control system should include robustness, expandability, user-friendliness and cost performance. Although quality control systems of Japan food are generally outstanding, however the know-how of those systems is not shared in public domain. Because most systems are driven by private companies independently. The most significant in-house know-how tends to be inherited by the skilled veteran engineers. Actually it is difficult to transfer the know-how from the aged veteran peoples to younger generation. Metabolic fingerprinting technology is being expected as one of the best solution for evaluation of food sensory quality. The relevance of metabolomics technology is described as below. The relationship between food components and food sensory quality is resembled to the relationship between metabolome and quantitative phenotype level. Therefore food metabolome data can be theoretically used as explanatory variants in case of prediction model of food sensory quality. The author’s group has established the prediction models of green tea quality according to the previous metabolic fingerprinting methods that we developed. The quantitative measurements of green tea components were performed by our in-house methods using various analytical methods, including GC-MS, LC-MS, FT-NMR and FT-NIR. The green tea quality was decided by sensory test by skilled veterans. Prediction model was established by means of partial least square projection to the latent structure (PLS). The scheme of the experiment is summarized in Fig. 5.17–21)
Fig. 5. Prediction of green tea quality by metabolic fingerprinting technique.
All analytical equipment that are mentioned before were applicable for prediction model constructions although some know-how for extraction of variants as explanatory variants is essential.
APPLICATION TO QUALITY ANALYSIS OF SEVERAL FOODS
The author’s group has already reported metabolic fingerprinting based food sensory quality evaluation studies using several foods including cheese, soy sauce, and Japanese sake (Fig. 6).
Fig. 6. Application of metabolomics to sensory evaluation of food and traditional herbal medicine.
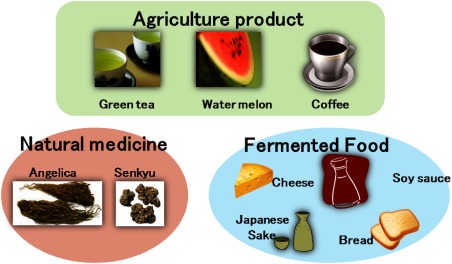
First the author wants to mention the study of cheese. In Japan processed cheese is the most common cheese in family use. Processed cheese is made from Cheddar cheese and Gouda cheese via several industrial processes. Among the process, the most important step is a maturation, which is based on lactic acid bacteria fermentation in high salt condition. Taste and flavor of natural cheese are generally floating according to the seasonal variation. Therefore, buyers in cheese producing companies always seek the best natural cheese in consideration of cost performance. Particularly, Japan cheese producers are making big effort to keep brand quality in which same flavor is. The most important process, maturation step, requires precise sensory qualification. However, sensory test is depending on the know-how of skilled veteran. The author’s group established the sensory quality evaluation model based on the conventional metabolic fingerprinting technique. GC-MS was employed as analytical equipment for modeling the significant flavor including “rich flavor” and “sour flavor.” Some clues for bio-marker of “rich flavor” were obtained from the information of PLS modeling process.22,23) The author’s group proved that GC-FID (flame ion detector) can be usable for the prediction of cheese sensory quality instead of GC-MS.24) “FID is a superior detection system with high sensitivity. In addition, FID would not be expensive. Moreover scan speed of FID is tremendously fast. The maintenance of FID is easy. That means GC-FID is one of the most promising equipment in the scene of practical application.”
Next, the author mentions a study of soy sauce. The especial flavor of soy sauce can be basically explained by a combination of sodium chloride, sodium glutamate and “Maillard reaction products.” However, molecular mechanism of slight difference that might be probably derived from materials and/or producing process have been unclear. Metabolic profiling of soy sauce were performed. In the analysis, coverage of metabolites was including amino acid, sugar, organic acid, sugar alcohol and dipeptide. The author’s group finally discovered that some dipeptides might affect the difference of Umai.25–27) These findings can be theoretically used for design of soy sauce flavor in future. Japanese Sake is produced via complicated process, in which saccharification and ethanol fermentation are performed in parallel. Such complicated process might contribute to various flavor of Japanese Sake. The author’s group conducted metabolome analysis of Japanese Sake. In the study the authors focused on both hydrophilic small metabolites and volatile metabolites. The sensory quality test of Japanese Sake was performed by quantitative descriptive analysis (QDA). Finally a good prediction model of QDA of Japanese Sake was successfully constructed.28) Further study is expected.
APPLICATION TO QUALITY ANALYSIS OF TRADITIONAL HERBAL MEDICINE
In Japan, the amount of traditional herbal medicine usage is increasing every year. The Chinese herbal extract preparation is available on health insurance treatment. The Chinese herbal preparation originally comes from ancient China medicine. Usually cocktail of several herb are administrated. However, contributions of ingredient in the cocktail have been unclear. Therefore, a quality control of traditional herbal medicine has been done by sensory test. In fact, the test has been done by skilled veterans in the dealers of traditional herbal medicines. Several decades are required to become independent skilled veteran. It is difficult for most dealers to keep the quality of sensory test panel due to lack of successors. The authors want to introduce two good applications of metabolic fingerprinting of traditional medicinal plant.
The first example, “Toki” is one of the most commonly used Chinese traditional medicinal plants in Japan. It originally comes from dry root of Angelica plant. Among Angelica plants, only the specific species, Angelica acutiloba, is authorized to be medicinal plant by the Ministry of Health Labour and Welfare, in Japan. “Toki” is often administered to female patients who suffer from chronically-diseased unidentified complaints. However medicinal properties of “Toki” are unclear. Therefore, pharmaceutical quality of “Toki” has been speculated mainly based on sensory test by skilled veteran of dealers. The author conducted the metabolic fingerprinting technology to establish a prediction model of sensory value of “Toki.” Hydrophilic extract of “Toki” was subjected to GC-MS, LC-MS and FT-NMR to obtain metabolome data information. The obtained metabolome was used as the explanatory variants in the partial least square projection to the latent structure (PLS). As a result, the good prediction models were successfully established.29–32)
The other topic is about “Senkyu,” which is also commonly used for female patients who suffer from chronically-diseased unidentified complaints. “Senkyu” has been defined as “a hot water washed rhizome” of Cnidium officinale plant. The medicinal properties of “Senkyu” has been also unidentified at all. The author conducted metabolic fingerprinting technology to “Senkyu” to establish almost similar prediction model of sensory value. In addition, cultivar, production area, post-harvest process were also discriminated by the prediction model.8,33) The above results clearly indicate a power of metabolic fingerprinting as a discrimination tool for traditional medicine. In future, a utilization of metabolic fingerprinting on the official evaluation will be expected.
NOVEL ANALYSIS SYSTEM FOR METABOLIC DYNAMISM BASED ON STABLE ISOTOPE DILUTION
It is possible to explain a slight difference of metabolism by means of metabolomics technology. Recently some applications of metabolomics for improvement of efficiency in microbial bio production have been attempted. According to the usual manner, multiple gene sets would be introduced to host microbial strain for expression of useful features. However in almost case, the expected performance would not be obtained at the initial stage. The failure is thought to be mainly derived from metabolic imbalance. Metabolomics is expected as a useful tool to seek the imbalance metabolic pathways, which can be the possible targets for improvement. To complete the task, dynamic analysis of metabolic perturbation might be required in some occasion. The previous applications, which are mainly related metabolic fingerprinting, are based on metabolic snapshot. It is derived from static measurement. In many case, metabolic fingerprinting is sufficient. However dynamic information would be required in some occasion. A metabolic flux analysis (MFA) is a conventional method to estimate metabolic flux. MFA is useful for optimization of the condition of practical fermentation. But several limitations are required for MFA. First, MFA requires precise metabolic map information. The second, at least two different isotopomers with the different isotope labeling patterns are essential as substrates. In addition, steady state of culture is necessary. Therefore MFA is hardly applicable to higher animals and plants. In addition, MFA is not effective for seeking new metabolic pathway. The author’s group developed a facile analytical method for semi-quantitative metabolic dynamism. The novel method uses time dependent variation of isotope distribution based on stable isotope dilution. A theory of the method is simple as the following explanation. A substrate would be switched from non-labeled substrate to a stable isotope labeled substrate. Just after change of substrate, time course sampling. The obtained sample would be performed to be subjected GC-MS, LC-MS, CE-MS etc. Each isotopomer tends to co-elute at the similar retention time each other. That means bad effect of ionization suppression would be reduced by stable isotope dilution. The time dependent variation of isotopomer distribution can be calculated from mass spectrometry data. We can estimate apparent semi-quantitative metabolic dynamism. The author suggested the novel method should be called “Metabolic Turnover Analysis (MTA)” (Fig. 7).
Fig. 7. A principle of metabolic turnover analysis based on stable isotope dilution.
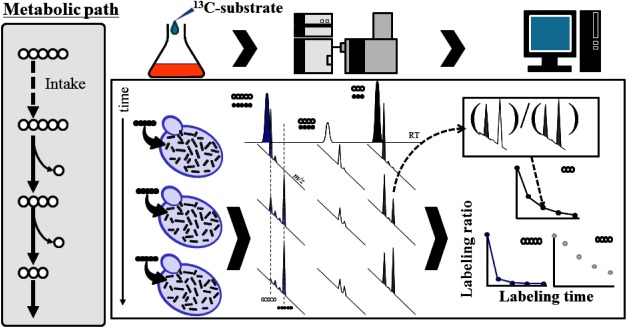
Just after 13C-labeled isotopomer was newly added, time-course sampling coupled metabolite profiling would be performed. In the down-stream from the point at which isotopomer was added, isotope distribution can be observed by GC-MS, LC-MS or CE-MS (Fig. 7). MTA does not require steady states. In MTA, labeling substrate is not restricted at all. Therefore, even if organisms utilize carbon dioxide as sole carbon source, it can be available into the MTA experiments. The author and collaborators succeeded in monitoring metabolic dynamism of photosynthesis dark reaction of tobacco leaf by means of MTA using 13C labeled carbon dioxide as labeling substrates.34) The labeling elements are not restricted in MTA. The author’s group reported a study of monitoring nitrogen containing metabolites by means of MTA using inorganic nitrogen salts as labeling reagents.35) Finally the author want to introduce a novel application of MTA. The time dependent variation of isotope distribution can be calculated from MTA experimental data. Those data were subjected to principal component analysis (PCA). The PCA score plots indicate topology of metabolites network. Using this method semi-quantitative metabolic distance can be estimated36,37) (Fig. 8).
Fig. 8. A principle of estimation of metabolic distance by means of metabolic turnover analysis.
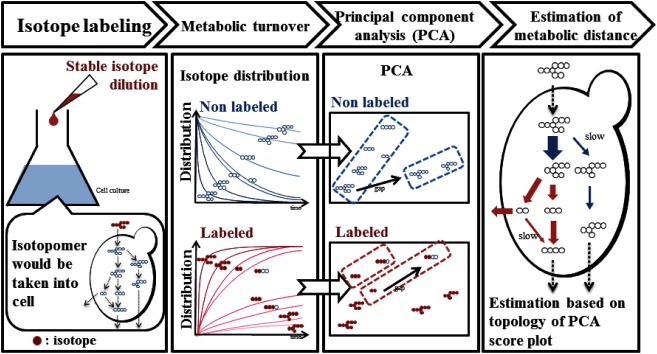
The author strongly wants to stress that a combination of the metabolic distance analysis and non-target metabolic profiling enable to discover unknown significant metabolic information.
CONCLUSION
Multivariate analysis using metabolome information as explanatory variants is powerful tool to learn various endogenous metabolic information. Metabolomics technique is applicable to quality analysis of food and traditional herbal medicine. The author introduced some application of metabolomics for quantitative phenotype analysis. Metabolomics is useful tactics in the present form. However some trial and error would be required on sampling, measurement, informatics, etc. Mass spectrometry is most commonly used in metabolomics. Because its sensitivity and qualification performance are superior. In the practical operation in metabolomics, sample injections with tremendous amount are always conducted for exhaustive profiling. However some know-how for keeping the condition of mass spectrometer would be required in metabolomics operation. Metabolomics become more and more important to bioscience and bioengineering. Performance advances on mass spectrometer must be essential in short term. Among the specifications that are required, the most important matter is novel ionization system that is perfectly free from bad effect of ionization suppression. Application scientists in the field of metabolomics definitely desire it.
E. Fukusaki, Application of Metabolomics for High Resolution Phenotype Analysis, Mass Spectrom (Tokyo) 2014; 3(4): S0045; DOI: 10.5702/massspectrometry.S0045
References
- 1) H. Tsugawa, Y. Tsujimoto, M. Arita, T. Bamba, E. Fukusaki. GC/MS based metabolomics: Development of a data mining system for metabolite identification by using soft independent modeling of class analogy (SIMCA). BMC Bioinformatics 12: 131, 2011. [DOI] [PMC free article] [PubMed] [Google Scholar]
- 2) F. Matsuda, H. Tsugawa, E. Fukusaki. Method for assessing the statistical significance of mass spectral similarities using basic local alignment search tool statistics. Anal. Chem. 85: 8291–8297, 2013. [DOI] [PubMed] [Google Scholar]
- 3) N. Kawase, H. Tsugawa, T. Bamba, E. Fukusaki. Different-batch metabolome analysis of Saccharomyces cerevisiae based on gas chromatography/mass spectrometry. J. Biosci. Bioeng. 117: 248–255, 2014. [DOI] [PubMed] [Google Scholar]
- 4) H. Tsugawa, M. Arita, M. Kanazawa, A. Ogiwara, T. Bamba, E. Fukusaki. MRMPROBS: A data assessment and metabolite identification tool for large-scale multiple reaction monitoring based widely targeted metabolomics. Anal. Chem. 85: 5191–5199, 2013. [DOI] [PubMed] [Google Scholar]
- 5) H. Tsugawa, Y. Tsujimoto, K. Sugitate, N. Sakui, S. Nishiumi, T. Bamba, E. Fukusaki. Highly sensitive and selective analysis of widely targeted metabolomics using gas chromatography/triple-quadrupole mass spectrometry. J. Biosci. Bioeng. 117: 122–128, 2014. [DOI] [PubMed] [Google Scholar]
- 6) H. Tsugawa, T. Bamba, M. Shinohara, S. Nishiumi, M. Yoshida, E. Fukusaki. Practical non-targeted gas chromatography/mass spectrometry-based metabolomics platform for metabolic phenotype analysis. J. Biosci. Bioeng. 112: 292–298, 2011. [DOI] [PubMed] [Google Scholar]
- 7) S. P. Putri, S. Yamamoto, H. Tsugawa, E. Fukusaki. Current metabolomics: Technological advances. J. Biosci. Bioeng. 116: 9–16, 2013. [DOI] [PubMed] [Google Scholar]
- 8) S. P. Putri, Y. Nakayama, F. Matsuda, T. Uchikata, S. Kobayashi, A. Matsubara, E. Fukusaki. Current metabolomics: Practical applications. J. Biosci. Bioeng. 115: 579–589, 2013. [DOI] [PubMed] [Google Scholar]
- 9) S. Hayashi, S. Akiyama, Y. Tamaru, Y. Takeda, T. Fujiwara, K. Inoue, A. Kobayashi, S. Maegawa, E. Fukusaki. A novel application of metabolomics in vertebrate development. Biochem. Biophys. Res. Commun. 386: 268–272, 2009. [DOI] [PubMed] [Google Scholar]
- 10) P. N. T. An, M. Yamaguchi, T. Bamba, E. Fukusaki. Metabolome analysis of Drosophila melanogaster during embryogenesis. PLoS ONE 9: e99519, 2014. [DOI] [PMC free article] [PubMed] [Google Scholar]
- 11) A. Ikeda, S. Nishiumi, M. Shinohara, T. Yoshie, N. Hatano, T. Okuno, T. Bamba, E. Fukusaki, T. Takenawa, T. Azuma, M. Yoshida. Serum metabolomics as a novel diagnostic approach for gastrointestinal cancer. Biomed. Chromatogr. 26: 548–558, 2012. [DOI] [PubMed] [Google Scholar]
- 12) S. Hori, S. Nishiumi, K. Kobayashi, M. Shinohara, Y. Hatakeyama, Y. Kotani, N. Hatano, Y. Maniwa, W. Nishio, T. Bamba, E. Fukusaki, T. Azuma, T. Takenawa, Y. Nishimura, M. Yoshida. A metabolomic approach to lung cancer. Lung Cancer 74: 284–292, 2011. [DOI] [PubMed] [Google Scholar]
- 13) S. Nishiumi, M. Shinohara, A. Ikeda, T. Yoshie, N. Hatano, S. Kakuyama, S. Mizuno, T. Sanuki, H. Kutsumi, E. Fukusaki, T. Azuma, T. Takenawa, M. Yoshida. Serum metabolomics as a novel diagnostic approach for pancreatic cancer. Metabolomics 6: 518–528, 2010. [Google Scholar]
- 14) R. Yoshida, T. Tamura, C. Takaoka, K. Harada, A. Kobayashi, Y. Mukai, E. Fukusaki. Metabolomics-based systematic prediction of yeast lifespan and its application for semi-rational screening of ageing-related mutants. Aging Cell 9: 616–625, 2010. [DOI] [PubMed] [Google Scholar]
- 15) Z. Hashim, Y. Mukai, T. Bamba, E. Fukusaki. Metabolic profiling of retrograde pathway transcription factors rtg1 and rtg3 knockout yeast. Metabolites 4: 580–598, 2014. [DOI] [PMC free article] [PubMed] [Google Scholar]
- 16) Z. Hashim, S. T. Teoh, T. Bamba, E. Fukusaki. Construction of a metabolome library for transcription factor-related single gene mutants of Saccharomyces cerevisiae. J. Chromatogr. B Analyt. Technol. Biomed. Life Sci. 966: 83–92, 2014. [DOI] [PubMed] [Google Scholar]
- 17) W. Pongsuwan, T. Bamba, T. Yonetani, A. Kobayashi, E. Fukusaki. Quality prediction of Japanese green tea using pyrolyzer coupled GC/MS based metabolic fingerprinting. J. Agric. Food Chem. 56: 744–750, 2008. [DOI] [PubMed] [Google Scholar]
- 18) W. Pongsuwan, E. Fukusaki, T. Bamba, T. Yonetani, T. Yamahara, A. Kobayashi. Prediction of Japanese green tea ranking by gas chromatography/mass spectrometry-based hydrophilic metabolite fingerprinting. J. Agric. Food Chem. 55: 231–236, 2007. [DOI] [PubMed] [Google Scholar]
- 19) L. Tarachiwin, K. Ute, A. Kobayashi, E. Fukusaki. 1H NMR based metabolic profiling in the evaluation of Japanese green tea quality. J. Agric. Food Chem. 55: 9330–9336, 2007. [DOI] [PubMed] [Google Scholar]
- 20) T. Ikeda, S. Kanaya, T. Yonetani, A. Kobayashi, E. Fukusaki. Prediction of Japanese green tea ranking by Fourier transform near-infrared reflectance spectroscopy. J. Agric. Food Chem. 55: 9908–9912, 2007. [DOI] [PubMed] [Google Scholar]
- 21) W. Pongsuwan, T. Bamba, K. Harada, T. Yonetani, A. Kobayashi, E. Fukusaki. High-throughput technique for comprehensive analysis of Japanese green tea quality assessment using ultra-performance liquid chromatography with time-of-flight mass spectrometry (UPLC/TOF MS). J. Agric. Food Chem. 56: 10705–10708, 2008. [DOI] [PubMed] [Google Scholar]
- 22) H. Ochi, H. Naito, K. Iwatsuki, T. Bamba, E. Fukusaki. Metabolomics-based component profiling of hard and semi-hard natural cheeses with gas chromatography/time-of-flight-mass spectrometry, and its application to sensory predictive modeling. J. Biosci. Bioeng. 113: 751–758, 2012. [DOI] [PubMed] [Google Scholar]
- 23) H. Ochi, Y. Sakai, H. Koishihara, F. Abe, T. Bamba, E. Fukusaki. Monitoring the ripening process of Cheddar cheese based on hydrophilic component profiling using gas chromatography-mass spectrometry. J. Dairy Sci. 96: 7427–7441, 2013. [DOI] [PubMed] [Google Scholar]
- 24) H. Ochi, T. Bamba, H. Naito, K. Iwatsuki, E. Fukusaki. Metabolic fingerprinting of hard and semi-hard natural cheeses using gas chromatography with flame ionization detector for practical sensory prediction modeling. J. Biosci. Bioeng. 114: 506–511, 2012. [DOI] [PubMed] [Google Scholar]
- 25) K. Shiga, S. Yamamoto, A. Nakajima, Y. Kodama, M. Imamura, T. Sato, R. Uchida, A. Obata, T. Bamba, E. Fukusaki. Metabolic profiling approach to explore compounds related to the umami intensity of soy sauce. J. Agric. Food Chem. 62: 7317–7322, 2014. [DOI] [PubMed] [Google Scholar]
- 26) S. Yamamoto, K. Shiga, Y. Kodama, M. Imamura, R. Uchida, A. Obata, T. Bamba, E. Fukusaki. Analysis of the correlation between dipeptides and taste differences among soy sauces by using metabolomics-based component profiling. J. Biosci. Bioeng. 118: 56–63, 2014. [DOI] [PubMed] [Google Scholar]
- 27) S. Yamamoto, T. Bamba, A. Sano, Y. Kodama, M. Imamura, A. Obata, E. Fukusaki. Metabolite profiling of soy sauce using gas chromatography with time-of-flight mass spectrometry and analysis of correlation with quantitative descriptive analysis. J. Biosci. Bioeng. 114: 170–175, 2012. [DOI] [PubMed] [Google Scholar]
- 28) N. Mimura, A. Isogai, K. Iwashita, T. Bamba, E. Fukusaki. Gas chromatography/mass spectrometry based component profiling and quality prediction for Japanese sake. J. Biosci. Bioeng. 118: 406–414, 2014. [DOI] [PubMed] [Google Scholar]
- 29) S. Tianniam, L. Tarachiwin, T. Bamba, A. Kobayashi, E. Fukusaki. Metabolic profiling of Angelica acutiloba roots utilizing gas chromatography—time-of-flight—mass spectrometry for quality assessment based on cultivation area and cultivar via multivariate pattern recognition. J. Biosci. Bioeng. 105: 655–659, 2008. [DOI] [PubMed] [Google Scholar]
- 30) S. Tianniam, T. Bamba, E. Fukusaki. Non-targeted metabolite fingerprinting of oriental folk medicine Angelica acutiloba roots by ultra performance liquid chromatography time-of-flight mass spectrometry. J. Sep. Sci. 32: 2233–2244, 2009. [DOI] [PubMed] [Google Scholar]
- 31) L. Tarachiwin, A. Katoh, K. Ute, E. Fukusaki. Quality evaluation of Angelica acutiloba Kitagawa roots by 1H NMR-based metabolic fingerprinting. J. Pharm. Biomed. Anal. 48: 42–48, 2008. [DOI] [PubMed] [Google Scholar]
- 32) S. Tianniam, T. Bamba, E. Fukusaki. Pyrolysis GC-MS-based metabolite fingerprinting for quality evaluation of commercial Angelica acutiloba roots. J. Biosci. Bioeng. 109: 89–93, 2010. [DOI] [PubMed] [Google Scholar]
- 33) S. Kobayashi, S. Nagasawa, Y. Yamamoto, K. Donghyo, T. Bamba, E. Fukusaki. Metabolic profiling and identification of the genetic varieties and agricultural origin of Cnidium officinale and Ligusticum chuanxiong. J. Biosci. Bioeng. 114: 86–91, 2012. [DOI] [PubMed] [Google Scholar]
- 34) T. Hasunuma, K. Harada, S. Miyazawa, A. Kondo, E. Fukusaki, C. Miyake. Metabolic turnover analysis by a combination of in vivo 13C-labelling from 13CO2 and metabolic profiling with CE-MS/MS reveals rate-limiting steps of the C3 photosynthetic pathway in Nicotiana tabacum leaves. J. Exp. Bot. 61: 1041–1051, 2010. [DOI] [PMC free article] [PubMed] [Google Scholar]
- 35) K. Harada, E. Fukusaki, T. Bamba, F. Sato, A. Kobayashi. In vivo 15N-enrichment of metabolites in suspension cultured cells and its application to metabolomics. Biotechnol. Prog. 22: 1003–1011, 2006. [DOI] [PubMed] [Google Scholar]
- 36) Y. Nakayama, S. P. Putri, T. Bamba, E. Fukusakil. Metabolic distance estimation based on principle component analysis of metabolic turnover. J. Biosci. Bioeng. 118: 350–355, 2014. [DOI] [PubMed] [Google Scholar]
- 37) Y. Dempo, E. Ohta, Y. Nakayama, T. Bamba, E. Fukusaki. Molar-based targeted metabolic profiling of cyanobacterial strains with potential for biological production. Metabolites 4: 499–516, 2014. [DOI] [PMC free article] [PubMed] [Google Scholar]


