Abstract
A spectral imaging system was developed to study the development of breast cancer xenografts in a murine mammary window chamber model. The instrument is configured to work with either a laser to excite fluorescence or a broadband light source for diffuse reflectance imaging. Two applications were demonstrated. First, spectral imaging of fluorescence signals was demonstrated with a GFP-breast cancer tumor and fluorescein injection. Second, based on the principles of broadband reflectance spectroscopy, the instrument was used to monitor dynamic changes of tissue absorbance to yield tissue oxygenation maps at different time points during tumor progression.
OCIS codes: (110.4234) Multispectral and hyperspectral imaging; (170.0110) Imaging systems; (170.1470) Blood or tissue constituent monitoring; (170.6280) Spectroscopy, fluorescence and luminescence; (170.2655) Functional monitoring and imaging
1. Introduction
Fluorescence imaging has a wide range of applications in cancer research that include the study of metastasis and tumor invasion [1], investigation of interaction of cancer cells with the microenvironment of the host [2,3], cellular receptor detection [4], and glycolytic metabolism [5,6]. In addition, optical spectroscopy of tissue endogenous chromophores in tissue, most commonly blood constituents, allow the investigation of oxygenation status and its effect on treatment response [7,8]. The development of an orthotopic mouse mammary window chamber (MWC) model [9–11] has facilitated the use of optical techniques to investigate the dynamic spatiotemporal changes of breast cancer xenografts in vivo. The orthotopic tumor model has been shown to possess higher predictive power in pre-clinical studies than subcutaneous tumor models [12]. The MWC model enables serial multi-modality imaging of a tumor as it develops from its initial stages and is a powerful platform with which to study many aspects of tumor biology and response to treatment.
In this paper, an optical spectral imaging system is developed to study breast cancer development in a murine MWC model. The system can be easily configured to perform either fluorescence imaging or broadband reflectance spectroscopy. Two applications were demonstrated in this work. First, fluorescence spectral imaging in the MWC was demonstrated with GFP-breast cancer xenografts and subsequent fluorescein injection. Second, the instrument was used to monitor dynamic changes of tissue absorbance, which were subsequently used to yield tissue oxygenation maps at different time points during tumor progression.
2. Preparation of orthotopic breast cancer xenografts and MWC
A MWC breast cancer mouse model for multi-modality imaging has been described in a previous publication [9]. The MWC is a 3D printed structure with a 7.25mm diameter transparent imaging window that is implanted over an orthotopically grown breast tumor xenograft. Experiments described in this work were carried out using a triple negative human breast cancer cell line, MDA-MB-231, that was transfected to express enhanced green fluorescent protein (GFP). Approximately 5x10⁶ cancer cells were injected into the left 4th mammary fat pad of a female post-breeder severe combined immunodeficiency (SCID) mouse, and the MWC was implanted a week later when the tumor reached a size of approximately 100 mm3. Imaging experiments commenced a day after surgical implantation of the MWC and were continued for as long as the MWC remained viable. A MWC implanted on an animal typically maintains structural integrity for approximately two weeks, which sets the limit for the period of time over which optical imaging can be carried out.
During imaging experiments, animals were anesthetized with 1.5% isofluorane and a 1 L/min medical-grade oxygen flow rate. Mice were placed in a supine position in a custom-made holder and a stabilizing bar was fitted snugly over the MWC to reduce motion artifacts due to respiration (Fig. 1). The round opening on the stabilizing bar fits around the MWC and restricts respiratory motion of the tissue under the MWC. Care was taken to prevent excessive pressure on the animal, which could result in difficulty breathing. Based on visual observation of the tissue at high optical magnification, residual tissue motion due to breathing is estimated to be less than 20μm, or only approximately one pixel at the lower magnification employed in the spectral imaging results shown below.
Fig. 1.

Image of a mouse in a customized holder used during imaging experiments. The stabilizing bar helps to suppress motion artifacts due to respiration.
3. Reflectance and fluorescence spectral imaging system
3.1 Setup of optical system
A reflectance and fluorescence spectral imaging system shown in Fig. 2 was developed for studying tumors growing under the MWC. The system was modified from an optical setup that was originally built as the optical scan unit for a confocal microendoscope [13]. In the confocal microendoscope design, a 10X microscope objective was used to couple light into an imaging fiber bundle. Although that lens can be used to obtain high-resolution images of the MWC, the limited field of view of 900μm is unsuitable for applications that require imaging of the entire MWC. To increase the field of view to 9mm, a 200mm focal length achromatic object lens was used in place of the microscope objective.
Fig. 2.

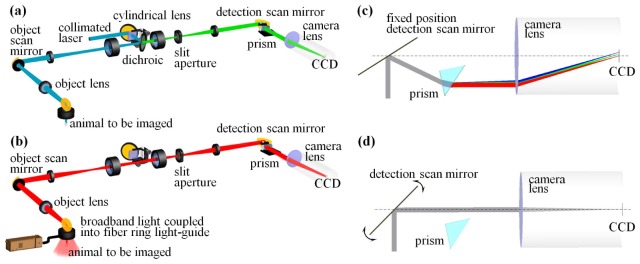
Different configurations of the imaging system. Imaging can be accomplished with either (a) a laser for fluorescence imaging or (b) a broadband light source for reflectance imaging. (c) For spectral imaging, light is deflected by a scan mirror in a fixed off-axis position onto a prism where it is dispersed and imaged onto a CCD. (d) Live imaging of fluorescence or white light reflectance can be done by rotating the detection scan mirror to avoid the prism and scanning it synchronously with the object scan mirror.
In order to facilitate rapid switching between different imaging modes without the need to move the alignment-sensitive dispersion prism, the system is configured to operate in an off-axis configuration during spectral imaging and an on-axis configuration for live broadband fluorescence or white light reflectance imaging.
The imaging system utilizes a laser for fluorescence imaging and a broadband source for reflectance imaging as shown in Fig. 1(a) and 1(b), respectively. In the latter case, illumination is accomplished using a broadband halogen lamp with the light coupled into a 1.125” diameter fiber ring light-guide. At a distance of 30mm from the tissue, this arrangement produces a reasonably uniform illumination over the full field of the MWC with virtually no direct specular reflection of the illumination into the detection path. The backscattered light from the sample is imaged by a set of lenses and a scanning mirror onto a 25μm wide slit aperture. The slit aperture is used to pass the backscattered light that originates from a 17.5μm wide line on the object. The location of the line on the object is determined by the angle of the object scan mirror. For spectral imaging, the light passing through the slit aperture is directed through a collimating lens, off a second scan mirror set at a fixed off-axis position, through a 45° BK7 glass prism, where it is dispersed and imaged by a camera lens to a CCD as shown in Fig. 1(c). The CCD camera employed has 13x13μm pixels and a readout rate of 10 fps. For a given position of the object scan mirror, the 2D image data on the CCD corresponds to a spectral-spatial image with spatial information along the vertical line of the slit and spectrally dispersed information perpendicular to the slit (horizontal direction). By reading out multiple frames of image data as the object scan mirror scans the line of light collection across the sample, a data set with the two spatial dimensions of the MWC and a reflectance spectrum at each spatial pixel location is obtained in less than 1 minute (512 frames of data at 10 fps = 51.2s). Alternatively, a laser source can be used in place of the broadband source. In this case, a fiber-coupled 488nm laser and a lens were used to create a collimated laser beam that passes through a cylindrical lens to produce a line illumination at the sample. This illumination line is conjugate to the slit aperture. The fluorescence emission goes through the same imaging path as described for reflected light imaging. For GFP transfected cancer cells, fluorescence imaging with a 488nm laser can easily distinguish tumor tissue from surrounding normal tissue.
Live real-time white-light reflectance or fluorescence imaging of the MWC can be obtained by using the appropriate light source and scanning both scan mirrors synchronously at 5Hz to match the camera’s readout rate of 10 fps. The scan mirror close to the camera operates over an angular range such that the light reaching the camera is not dispersed by the prism. It should be noted that faster frame rates can be achieved with a camera that operates at a higher readout rate. This live real-time mode of imaging is useful for quickly positioning and focusing the MWC in the field of view of the instrument or visualizing the tumor location for correlation to reflectance mode spectral images.
3.2 Compensating chromatic aberrations in spectral measurements
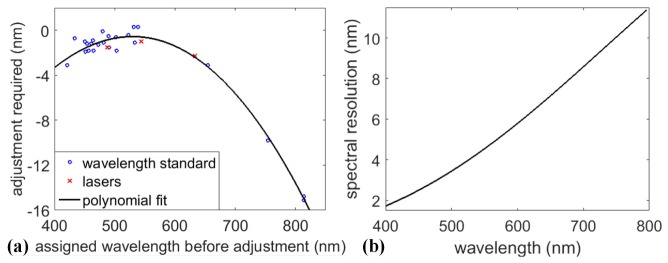
Due to the presence of chromatic aberration and the nonlinear spectral to spatial mapping of the prism, calibration of the spectral measurements is required. Initially, the paraxial imaging equation was used to estimate the focal position on the CCD as a function of the incidence wavelength. Next, reflectance spectroscopy with a broadband light source was performed using a multicomponent doped Spectralon wavelength standard that has several distinct reflectance minima at specific wavelengths. The wavelength calibration adjustments required to match the measured spectra to the NIST-traceable calibration data supplied by Labsphere were computed. A similar procedure was done separately with 488.0, 543.5 and 632.8nm lasers. The combined calibration result is shown in Fig. 3(a).
Fig. 3.

Spectral calibration and resolution. (a) Adjustment curve derived by comparing measured reflectance curve with the calibrated data supplied by Labsphere. (b) Spectral resolution of the system as a function of wavelength.
The spectral resolution of the system, which varies due to the nonlinear dispersion of the prism, is shown in Fig. 3(b). The spectral linewidth is determined by the convolution of the calibrated spectral to spatial mapping function with the FWHM of a line image of the slit aperture on the detector. The line image of the slit was obtained by illuminating a R≈99% Spectralon standard with a 632.8nm laser coupled into the fiber ring light-guide. The FWHM of the slit image was 2.8 camera pixels, which corresponds to 36.4μm and does not change significantly with wavelengths 488.0, 543.5 and 632.8nm. The resulting spectral resolution of the system varies from about 2nm at 400nm wavelength to 11nm at 800nm wavelength, which results in roughly 100 independent spectral channels of measurement across the spectral band. Thus, the system performance is consistent with definition as a hyperspectral imaging system.
4. Experimental results with in-vivo imaging of the MWC
4.1 Hyperspectral fluorescence imaging
To demonstrate the hyperspectral fluorescence imaging capability of the system an experiment was performed in which spectral fluorescence data were collected before and after injection of 100μl of 30mM fluorescein via a tail vein catheter into a MWC mouse with an MDA-MB-231-GFP tumor. A 488 nm laser efficiently excites the fluorescence of both GFP and fluorescein.
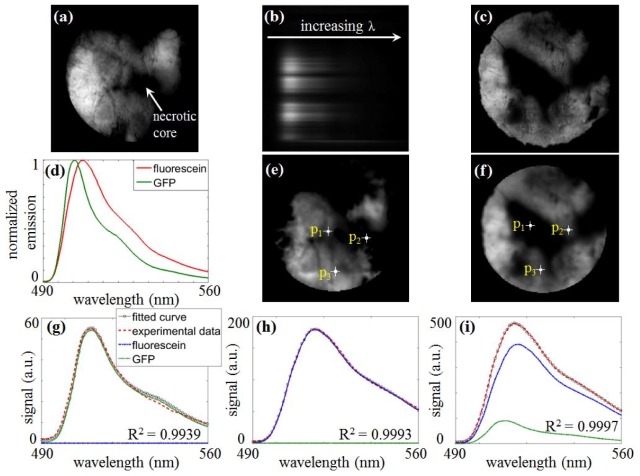
Figure 4(a) shows a spectral projection image of the GFP signal from the tumor obtained before fluorescein injection. Despite a visible vascular network around the tumor, there is a necrotic core in the center. Figure 4(b) shows an example of a single dispersion image that corresponds to a line at the center of the MWC. After fluorescein injection, the agent was rapidly transported to the tissue within seconds and the resultant spectral projection image is shown in Fig. 4(c). There is little fluorescein in the necrotic core due to the lack of vasculature in that region. Figure 4(d) is a plot of normalized emission spectral of GFP (SGFP(λ)) and fluorescein (Sfl(λ)). The former was obtained by measuring the signal from the tumor before injection of fluorescein while the latter was obtained by measuring the post-injection fluorescence signal in regions where there was originally no GFP signal. Since there is significant emission spectral overlap, delineation of signals from GFP and other fluorophores such as fluorescein has to rely on techniques such as spectral unmixing techniques [14].
Fig. 4.
Hyperspectral fluorescence imaging results. (a) A fluorescence image of GFP. (b) A single dispersion image of a line through the center of MWC. (c) A fluorescence image after fluorescein injection. (d) Normalized emission spectra of fluorescein and GFP. (e-f) Maps of CGFP and Cfl derived from spectral unmixing. (g-i) Plots show the measured data, fitted curves and decomposed spectral components at three locations marked p1-p3 in (e) and (f).
In a simple first order approximation, a linear mixing model expressed in Eq. (1) was used to determine the amount of GFP and fluorescein signal at each pixel location. Srefl(λ) denotes the mean detected reflected signal within a 11x11 pixel region around a point. Taking a mean of a small region helps smooth out noise and improve performance of the spectral unmixing procedure. Sfl(λ) and SGFP(λ) represent normalized fluorescence spectra of fluorescein and GFP respectively. CGFP and Cfl are proportionality coefficients representing the respective signal strengths of the two fluorophores. Lastly, C is a constant. Figure 4(e) and 4(f) show the resulting maps of CGFP and Cfl respectively. The R2 value, which gives an indication of goodness of fit, was computed for every fitted data point. 92% of which have R2 value greater than 0.99. The experimental data and decomposed spectral components are shown in Fig. 4(g-i). Despite the good fits and the high R2 values, there are some discrepancies between the measured GFP map before fluorescein injection (Fig. 4(a)) and that derived from post-injection data (Fig. 4(e)). This is possibly because spectral variations arising from factors such as tissue pH and concentration of fluorophores have been neglected [15].
| (1) |
4.2 Absorbance measurement and oxygen saturation estimation
Another application of the instrument is to obtain spectrally resolved absorbance measurements in order to map out the blood oxygenation saturation levels in the tissue below the MWC. Because of the geometry of the MWC model, absorbance is described here in the context of epi-illumination and detection of the diffusely reflected broadband light. Absorbance, as a function of wavelength, is defined as –log(I(λ)/Io(λ)), where I and Io are the wavelength dependent intensities of light reflected off the object and the incident light, respectively. In order to calculate the absorbance of tissue under a MWC, two separate measurements were made. The first measurement (Isp) was made with a Spectralon standard that has a uniform R≈99% reflectance in the visible wavelength range. The second measurement (IMWC) was made with the same illumination source but with object (MWC) in place. Since the two objects are imaged under the exact same imaging conditions, system variations that arise from wavelength-dependent quantum efficiency of the CCD and optical properties of lenses are removed. With these two measurements, absorbance is calculated as , where R is the Spectralon reflectance.
As a first order estimation, absorption, μa, is treated as a sum of terms associated with each chromophore in the tissue. In the visible wavelength range, the main chromophores of interest are fat and blood oxyhemoglobin (HbO2) and deoxyhemoglobin (Hb). The measured absorbance curve in the 480-620nm wavelength range was fitted to the following Eq. (2):
| (2) |
where SaO2 is the fractional oxygen saturation, εoxy, εdeoxy and εfat are the molar extinction coefficients of HbO2, Hb and fat respectively, and k1, k2 and k3 are constants. The wavelength dependent extinction coefficients of oxyhemoglobin and deoxyhemoglobin of rat blood [16] were used as an approximation for mouse blood, and the wavelength dependent extinction coefficient of mammalian fat [17] was used for the fat component. The measurements and subsequent data fitting described here yield a 2D map of the local blood oxygenation in the tissue under the MWC. It should be noted here that breast cancer xenografts in the MWC mouse model are typically small (less than 300 mm3) and grow close to the surface of the imaging windows. Because visible light penetrates only a few millimeters into the mammary tissue [18], the SaO2 maps reflect the average oxygenation status of a slab of tissue near the tissue/glass interface of the MWC.
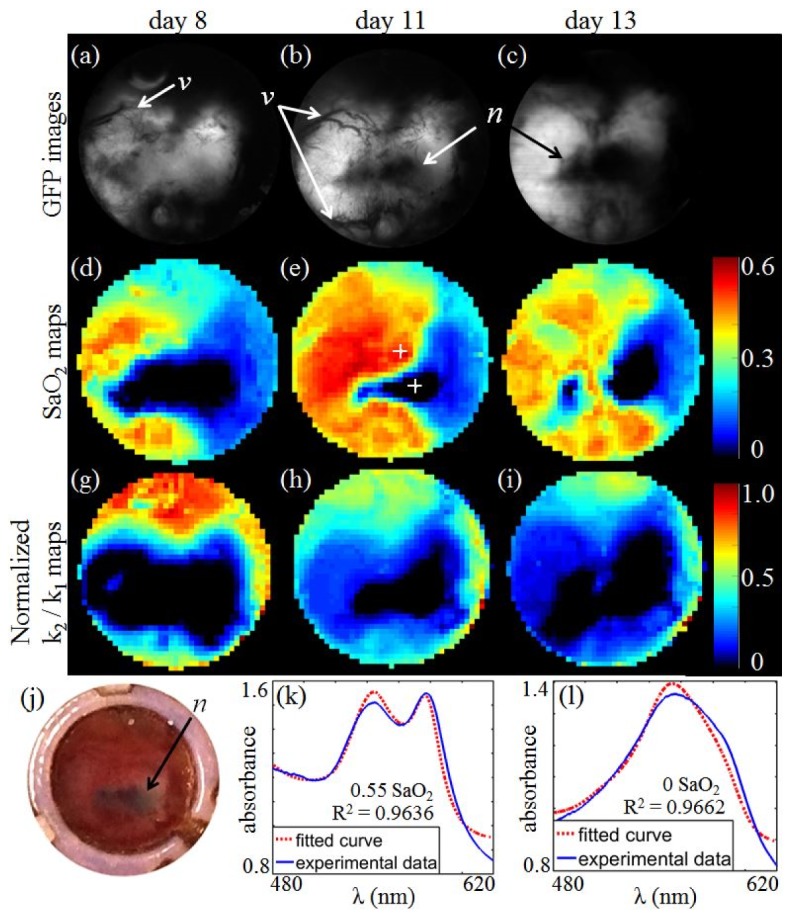
Hyperspectral reflectance measurements of a MWC animal were acquired and used to estimate the SaO2 in the tissue below the glass coverslip. Tumor growth and oxygenation levels were monitored as the tumor developed over a period of several days. Fig. 5(a)-5(c) show GFP images from days 8, 11 and 13 after cell injection. SaO2 maps from corresponding time points are shown in Fig. 5(d)-5(f). The k2/k1 parameter (see Eq. (2)) is a measure of fat content relative to blood. Normalized images of the ratio are given in Fig. 5(g)-5(i). Much of the fat is observed to exist in the tissue at the edge of the MWC and little fat content is present within the tumor.
Fig. 5.

Hyperspectral reflectance imaging to measure SaO2 in the MWC model. (a-c) are GFP images at days 8, 11 and 13 after cell inoculation. Aberrant vasculature and necrosis are marked as “v” and “n” respectively. (d-f) SaO2 maps of the MWC at corresponding days. (g-i) Normalized maps of k2/k1 coefficient (see Eq. (2)), which are related to fat content. (j) A picture of the MWC taken at day 11 which shows the marked necrotic region being darker than surrounding tissue. (k-l) Plots of measured and fitted absorbance curves at two different locations marked with crosshairs in (e).
In the GFP image of day 8 (Fig. 5(a)), aberrant angiogenesis can be seen on the top left of the tumor indicated by the arrow marked “v”. The co-registered SaO2 map in Fig. 5(d) shows that this part of the tumor is significantly more oxygenated than tissue in the surrounding region. In contrast, a vascular network was noticeably absent in the central part of the tumor. The measured SaO2 indicates the occurrence of hypoxia in that region, which is common in aggressive tumors where the growth rate is faster than what the vascular network can support.
Three days later, Fig. 5(b) shows that neovasculature had become more prevalent at the periphery of the tumor. Disappearance of GFP signal in the middle indicates that tumor necrosis (marked “n”) has occurred and GFP expressing tumor cells in this region have died even though the extent of low oxygen saturation has actually reduced in size. Fig. 5(j) is a photograph of the MWC taken on that day and the necrotic region is visibly darker than surrounding tissue. On day 13, Fig. 5(f) shows that oxygen supply has redistributed with lower oxygen saturation shifting to the right. Fig. 5(k)-5(l) show measured absorbance spectra and the spectral fits to the mathematical model in Eq. (2). The plots are from two different locations marked with crosshairs on Fig. 5(e). At relatively high 0.55 SaO2, the distinct double peaks of the absorbance curve associated with oxyhemoglobin can be seen in Fig. 5(k). This is different from the absorbance curve in Fig. 5(l) where absorbance is mainly due to deoxyhemoglobin. Good agreement between experimental data and fitted curves are observed over the spectral range despite the simplicity of the diffuse reflectance model. Generally, R2 values of the fits are greater than 0.85 over the extent of the MWC.
5. Conclusion
In this work, an optical system was developed to perform in-vivo fluorescence and broadband reflectance spectral imaging to study the dynamic changes of breast cancer xenografts in a mouse MWC model. The hyperspectral imaging capability of the instrument was demonstrated with two applications, namely fluorescence imaging of fluorescein distribution within a GFP tumor and the monitoring of tissue oxygenation during tumor progression.
Acknowledgments
This work is supported by the Fenton Maynard Endowment. The authors would like to thank Ms. Gillian Paine-Murrieta and Ms. Bethany Skovan from the University of Arizona Cancer Center’s Experimental Mouse Shared Resource for their help in animal surgery. The authors also acknowledge the help from the 3D printing team from the University of Arizona’s Center for Gamma-Ray Imaging.
References and links
- 1.Hoffman R. M., “The multiple uses of fluorescent proteins to visualize cancer in vivo,” Nat. Rev. Cancer 5(10), 796–806 (2005). 10.1038/nrc1717 [DOI] [PubMed] [Google Scholar]
- 2.Yang M., Reynoso J., Bouvet M., Hoffman R. M., “A transgenic red fluorescent protein-expressing nude mouse for color-coded imaging of the tumor microenvironment,” J. Cell. Biochem. 106(2), 279–284 (2009). 10.1002/jcb.21999 [DOI] [PMC free article] [PubMed] [Google Scholar]
- 3.Yang M., Li L., Jiang P., Moossa A. R., Penman S., Hoffman R. M., “Dual-color fluorescence imaging distinguishes tumor cells from induced host angiogenic vessels and stromal cells,” Proc. Natl. Acad. Sci. U.S.A. 100(24), 14259–14262 (2003). 10.1073/pnas.2436101100 [DOI] [PMC free article] [PubMed] [Google Scholar]
- 4.Wu X., Liu H., Liu J., Haley K. N., Treadway J. A., Larson J. P., Ge N., Peale F., Bruchez M. P., “Immunofluorescent labeling of cancer marker Her2 and other cellular targets with semiconductor quantum dots,” Nat. Biotechnol. 21(1), 41–46 (2002). 10.1038/nbt764 [DOI] [PubMed] [Google Scholar]
- 5.O’Neil R. G., Wu L., Mullani N., “Uptake of a Fluorescent Deoxyglucose Analog (2-NBDG) in Tumor Cells,” Mol. Imaging Biol. 7(6), 388–392 (2005). 10.1007/s11307-005-0011-6 [DOI] [PubMed] [Google Scholar]
- 6.Millon S. R., Ostrander J. H., Brown J. Q., Raheja A., Seewaldt V. L., Ramanujam N., “Uptake of 2-NBDG as a method to monitor therapy response in breast cancer cell lines,” Breast Cancer Res. Treat. 126(1), 55–62 (2011). 10.1007/s10549-010-0884-1 [DOI] [PubMed] [Google Scholar]
- 7.Dewhirst M. W., Cao Y., Moeller B., “Cycling hypoxia and free radicals regulate angiogenesis and radiotherapy response,” Nat. Rev. Cancer 8(6), 425–437 (2008). 10.1038/nrc2397 [DOI] [PMC free article] [PubMed] [Google Scholar]
- 8.Roblyer D., Ueda S., Cerussi A., Tanamai W., Durkin A., Mehta R., Hsiang D., Butler J. A., McLaren C., Chen W. P., Tromberg B., “Optical imaging of breast cancer oxyhemoglobin flare correlates with neoadjuvant chemotherapy response one day after starting treatment,” Proc. Natl. Acad. Sci. USA 108(35), 14626–14631 (2011). 10.1073/pnas.1013103108 [DOI] [PMC free article] [PubMed] [Google Scholar]
- 9.Schafer R., Leung H. M., Gmitro A. F., “Multi-modality imaging of a murine mammary window chamber for breast cancer research,” Biotechniques 57(1), 45–50 (2014). [DOI] [PMC free article] [PubMed] [Google Scholar]
- 10.Kedrin D., Gligorijevic B., Wyckoff J., Verkhusha V. V., Condeelis J., Segall J. E., van Rheenen J., “Intravital imaging of metastatic behavior through a mammary imaging window,” Nat. Methods 5(12), 1019–1021 (2008). 10.1038/nmeth.1269 [DOI] [PMC free article] [PubMed] [Google Scholar]
- 11.Schafer R., Gmitro A. F., “Dynamic oxygenation measurements using a phosphorescent coating within a mammary window chamber mouse model,” Biomed. Opt. Express 6(2), 639–650 (2015). 10.1364/BOE.6.000639 [DOI] [PMC free article] [PubMed] [Google Scholar]
- 12.Hoffman R. M., “Orthotopic metastatic mouse models for anticancer drug discovery and evaluation: A bridge to the clinic,” Invest. New Drugs 17(4), 343–360 (1999). 10.1023/A:1006326203858 [DOI] [PubMed] [Google Scholar]
- 13.Makhlouf H., Gmitro A. F., Tanbakuchi A. A., Udovich J. A., Rouse A. R., “Multispectral confocal microendoscope for in vivo and in situ imaging,” J. Biomed. Opt. 13(4), 044016 (2008). 10.1117/1.2950313 [DOI] [PMC free article] [PubMed] [Google Scholar]
- 14.Keshava N., Mustard J. F., “Spectral unmixing,” IEEE Signal Process. Mag. 19(1), 44–57 (2002). 10.1109/79.974727 [DOI] [Google Scholar]
- 15.Doughty M. J., “pH dependent spectral properties of sodium fluorescein ophthalmic solutions revisited,” Ophthalmic Physiol. Opt. 30(2), 167–174 (2010). 10.1111/j.1475-1313.2009.00703.x [DOI] [PubMed] [Google Scholar]
- 16.Zijlstra W. G., Buursma A., van Assendelft O. W., Visible and Near Infrared Absorption Spectra of Human and Animal Haemoglobin: Determination and Application (VSP, 2000). [Google Scholar]
- 17.R. van Veen and H. Sterenborg, “Determination of VIS-NIR absorption coefficients of mammalian fat, with time-and spatially resolved diffuse reflectance and transmission spectroscopy,” in Biomed. Topical Meeting, (2004). 10.1364/BIO.2004.SF4 [DOI] [PubMed] [Google Scholar]
- 18.Stolik S., Delgado J. A., Pérez A., Anasagasti L., “Measurement of the penetration depths of red and near infrared light in human “ex vivo” tissues,” J. Photochem. Photobiol. B 57(2-3), 90–93 (2000). 10.1016/S1011-1344(00)00082-8 [DOI] [PubMed] [Google Scholar]


