Abstract
This paper presents the design, optimization and fabrication of 16 MgO/TiO2 and SiO2/TiO2 based high selective narrow bandpass optical filters. Their performance to extract diffuse reflectance and fluorescence signals from gastrointestinal tissue phantoms was successfully evaluated. The obtained results prove their feasibility to correctly extract those spectroscopic signals, through a Spearman’s rank correlation test (Spearman’s correlation coefficient higher than 0.981) performed between the original spectra and the ones obtained using those 16 fabricated optical filters. These results are an important step for the implementation of a miniaturized, low-cost and minimal invasive microsystem that could help in the detection of gastrointestinal dysplasia.
OCIS codes: (170.3890) Medical optics instrumentation; (170.6510) Spectroscopy, tissue diagnostics; (310.1860) Deposition and fabrication; (310.3840) Materials and process characterization; (120.2230) Fabry-Perot
1. Introduction
Gastrointestinal (GI) cancers are one of the main causes of death in the world [1]. Its detection in an initial stage, called dysplastic stage, is fundamental in medical diagnosis, once gives to the patient a higher effective treatment chance [2, 3]. The GI dysplasia is difficult to detect by conventional visual inspection techniques, due to the lack of macroscopically easily visible changes on the tissues surface, that occur in the early stage of cancer [3, 4]. Therefore, when a cancer suspicion appears a biopsy is needed, which is a high cost and an invasive procedure. Moreover, its result is not immediately available, resulting on a delay of patient’s treatment [3]. Thus, it is increasingly important to develop new and minimally invasive techniques for the GI cancers early detection.
Spectroscopic techniques, specifically diffuse reflectance and fluorescence spectroscopy, can considerably improve the ability to detect GI dysplasia, since they have exquisite sensitivity to some cancer biomarkers present on the tissues [2–5]. As a result, small changes in those biomarkers concentration, due to cancer progression, can be detected by measuring the diffuse reflectance and fluorescence signals of a GI tissue. The analysis of these signals with well-developed models makes it possible to extract quantitative information that relates the changes in their intensity and shape with GI cancer progression [6–8].
This paper focused on the extraction of the spectroscopic signals using high selective optical filters especially the filters fabrication for this purpose. The development of a fully integrated microsystem on a chip to extract diffuse reflectance and fluorescence signals will have a high clinical value, since it could be integrated with the conventional endoscopes and colonoscopes, helping in the detection of GI dysplasia. Moreover, the microsystem could be used in the surgery room for inspecting total removing of cancer tissue. Such microsystem would comprise: miniaturized LEDs (Light Emission Diodes) for spectroscopy illumination, an array of tunable photodetectors and its readout electronics for further signal processing. Each photodetector has one side deposited with a thin-film optical filter, selected for each of the relevant spectral bands, therefore allowing the detection of the diffuse reflectance and fluorescence signals.
The use of an integrated optical filtering system, such as the one described in this paper, will allow the extraction of diffuse reflectance and fluorescence signals without the use of heavy and complex equipment, such as monochromators, featuring system miniaturization and on-chip integration. Previous work [9] carried out by some members of the research team showed the viability of replacing a conventional spectrograph by 16 narrow bandpass optical filters to extract the diffuse reflectance signal from GI tissues and to acquire tissue optical properties, featuring dysplasia diagnostics. However, in that study, only 6 SiO2/TiO2 based optical filters (in the visible spectral range) were fabricated and their spectral performance was evaluated using only a single tissue phantom and only for diffuse reflectance signal extraction, which may not be enough for a complete GI tissue characterization. There are some important GI tissue fluorophores whose concentration changes during cancer progression. Thus, the fluorescence signal extraction also plays an important role on the GI tissue characterization. Moreover, in the previous work [9], the authors emphasized the importance of an optimization of the optical filters fabrication process, in order to improve their performance.
In this paper, 16 MgO/TiO2 and SiO2/TiO2 based narrow bandpass optical filters were designed, optimized, fabricated and their performance to extract spectroscopic signals was evaluated, performing spectrophotometric measurements with phantoms representative of GI tissues, including diffuse reflectance and fluorescence measurements.
This work long term goal will be the implementation of the microsystem on a fully integrated chip, integrating the readout electronics, LEDs for illumination and the 16 optical filters directly deposited on each of the 16 silicon photodiodes for signals detection. To accomplish this requirement, it is mandatory to obtain the bandpass optical filters with materials and fabrication process compatible with large area microelectronics fabrication. Moreover, it is known that using optical detection in a chip results in a better coupling of the light from emitter to source, due to the decrease of the number of interfaces, reducing the optical losses. Although bandpass optical filters are commercially available, their integration with the chip microfabricated is very limited due to their large dimensions (diameter, thickness), as will be discussed in section 5. Therefore, the possibility to integrate thin-film deposited bandpass filters will have higher impact to reduce the final cost, size and performance, when comparing with mounting discrete filters externally on the chip.
2. Thin-film optical filters design
2.1 Filter structure selection
The filters design is based on a multilayer thin-film structure that acts as a narrow bandpass filter. They are structurally similar to a Fabry-Perot resonator with dielectric mirrors, featuring low energy absorption rates and high transmittance at specific wavelengths [10–12]. Equation (1) shows their operation principle [10]:
| (1) |
where is the resonant cavity thickness, is the transmitted wavelength, is the refractive index of the resonant cavity material, and the filter interference order ( = 1, 2, 3, …). The thicknesses of the mirrors films () is also related with the transmitted wavelength (), considering Eq. (2) [10]:
| (2) |
where d is the mirrors films thickness.
Therefore, in a Fabry–Perot optical filter the thickness of the resonance cavity determines the tuned wavelength, for the same mirrors films. Taking advantage of that, 16 optical filters centered at specific spectral bands, ranging from 350 to 750 nm, previously considered relevant to extract the spectroscopic signals to GI dysplasia detection [9], were computationally designed using the software TFCalc 3.5 and the Sopra database for the materials refractive indices. During this step, the transmittance peak and the FWHM (Full Width at Half Maximum) of the filters were analyzed. For the reported application, the intensity of the transmitted peak should be high, with at least twice the intensity of any noise peak that might appear in the considered spectral range. Concerning the FWHM, a value around 10 nm is enough, once the 16 required spectral bands are centered at 350, 370, 380, 400, 420, 450, 480, 510, 540, 560, 580, 600, 620, 650, 700 and 750 nm [9].
The reported features give rise to divide the optical filters in three spectral regions: UV/VIS (350 nm – 450 nm), VIS (480 nm – 600 nm) and VIS/IR (620 nm – 750 nm). Within the same spectral region, the optical filters were centered at different spectral bands by adjusting only the thickness of the resonant cavity, keeping the thicknesses of the mirrors films equal. This procedure minimizes the deposition time required for the optical filters fabrication. Therefore, the optical filter multilayer structure is composed by 11 thin-films with high and low refractive index materials, alternatively – Fig. 1. The number of layers was chosen taking into account the optical filters performance during their design on TFCalc, concerning the FWHM and the transmittance peak.
Fig. 1.
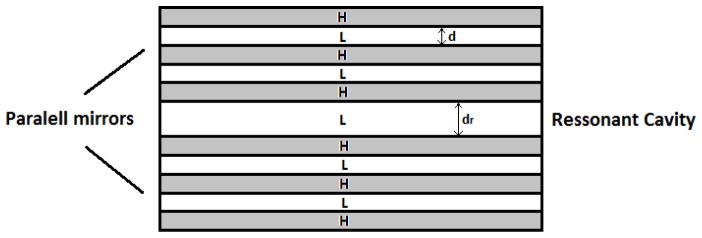
Fabry-Perot resonator structure with dielectric mirrors: H – layer with high refractive index; L – layer with low refractive index. and are the thicknesses of the resonance cavity and of the mirrors films, respectively. Their values are obtained using Eq. (1) and Eq. (2), respectively.
2.2 Selection of materials
In an initial stage, TiO2 and SiO2 films were used as high and low refractive index materials, respectively, once they are hard materials and compatible with integrated circuits. Their refractive indices are almost wavelength independent in the visible range of the spectrum and they are commonly deposited by Ion Beam Deposition (IBD), the process used for the optical filters fabrication – see section 3. However, it was checked (during the simulations on TFCal) that this combination results in a poor optical filter performance below 420 nm, especially due to the low transmittance of the filters. As a result, other materials combinations (compatible with the IBD process) were considered, in order to improve the transmittance peak without increasing the FWHM, i.e., keeping the selectivity of the filters. Thus, MgO with TiO2 were used on that spectral band, since this combination leads to an increase of the transmittance peak, maintaining the filters FWHM, especially below 420 nm.
The resonant cavity thickness and the thicknesses of the mirrors films, for each filter, are presented on Table 1 for the combinations MgO/TiO2 and SiO2/TiO2. The thicknesses of the mirrors films () were calculated using as reference a central wavelength (), in each specific group or region, and Eq. (2). The resonant cavity thickness () for each filter was obtained using Eq. (1).
Table 1. Layer thicknesses of the optical filters in the UV/VIS, VIS and VIS/IR regions, with the combinations MgO/TiO2 and SiO2/TiO2 (RC: Resonant Cavity).
| Maximum transmittance peak wavelength (nm) | |||||||||||||||||
|---|---|---|---|---|---|---|---|---|---|---|---|---|---|---|---|---|---|
| 350 | 370 | 380 | 400 | 420 | 450 | 480 | 510 | 540 | 560 | 580 | 600 | 620 | 650 | 700 | 750 | ||
| Layer Thickness (nm) | Layer Thickness (nm) | ||||||||||||||||
| TiO2 | 30 57 30 57 30 |
TiO2 | 30 68 30 68 30 |
45 95 45 95 45 |
60 117 60 117 60 |
||||||||||||
| MgO | SiO2 | ||||||||||||||||
| TiO2 | TiO2 | ||||||||||||||||
| MgO | SiO2 | ||||||||||||||||
| TiO2 | TiO2 | ||||||||||||||||
|
MgO (RC) |
– | 88 | 98 | 114 |
SiO2 (RC) |
153 | 174 | 140 | 163 | 184 | 199 | 214 | 229 | 189 | 211 | 248 | 285 |
| TiO2 | 30 57 30 57 30 |
TiO2 | 30 68 30 68 30 |
45 95 45 95 45 |
60 117 60 117 60 |
||||||||||||
| MgO | SiO2 | ||||||||||||||||
| TiO2 | TiO2 | ||||||||||||||||
| MgO | SiO2 | ||||||||||||||||
| TiO2 | TiO2 | ||||||||||||||||
2.3. Optical filters simulations
Simulation results (from TFCalc) for that initial approach (using the refractive indices from Sopra database) are presented in Fig. 2(A) to 2(C). At this phase, it was not possible to present the transmittance of the 350 nm optical filter, using the materials and thicknesses indicated in Table 1, since the transmittance obtained for this filter in the simulations was smaller than 0.5%. This can be explained by the theoretical properties of the materials being used, namely their refractive indices available at the Sopra database.
Fig. 2.
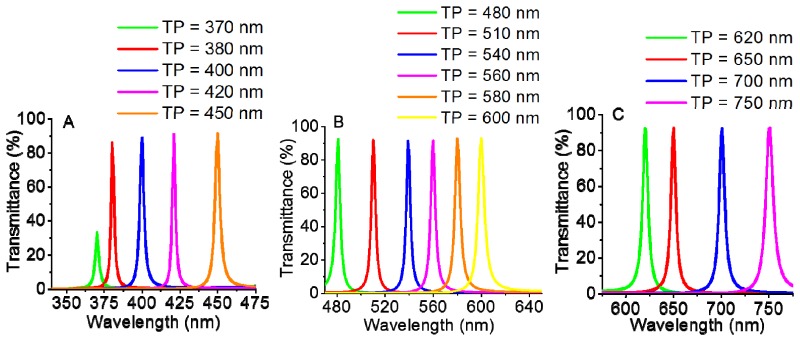
Simulated transmittance spectra for the UV/VIS optical filters (A), VIS optical filters (B) and VIS/IR optical filters (C), (TP: filter maximum transmittance peak wavelength).
The simulation results of Fig. 2 show that the chosen multilayer stack (five layers) of MgO/TiO2 or SiO2/TiO2 thin-films for the dielectric mirrors and a MgO or SiO2 layer for the resonant cavity (see Table 1), is the best option for the optical filters in terms of optical characteristics, feasibility and fabrication process. Moreover, those simulations allow us to conclude that: (1) each spectral band has a high transmittance, close to 90%, except for the optical filter centered at 370 nm, explained by the theoretical refractive indices from Sopra database; (2) the FWHM is less than 10 nm (average 6 nm); and (3) the interference of each neighbor peak is less than 10%. The performance of the optical filters could be improved by increasing the number of layers of the dielectric mirrors, but the complexity of the fabrication process would also increase.
3. Thin-films deposition process
The Fabry-Perot optical filters were deposited at INESC-MN by IBD in a Nordiko 3000 tool equipped with a deposition and assist guns, in a broad beam architecture [13, 14] compatible with 150 mm diameter wafer deposition. Figure 3 shows the equipment geometry for a standard film deposition. The Xenon ions created inside the deposition gun (by a RF coil) were accelerated through a grid assembly, into the target, at a pressure of 0.4 mTorr.
Fig. 3.
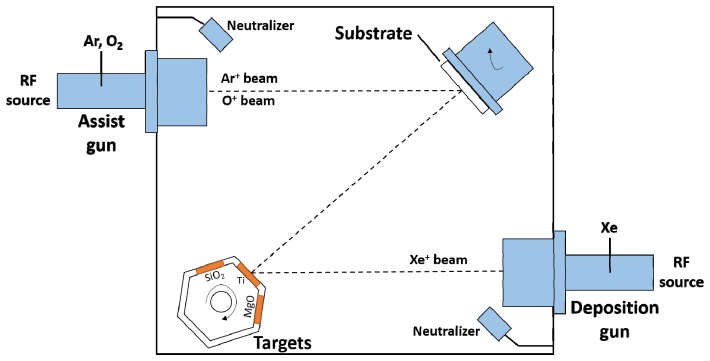
Scheme of the fully automated deposition system (Nordiko 3000) with a 6-target configuration, allowing sequential deposition of the films. The film thickness uniformity is ± 2% over 150 mm diameter area.
The SiO2 and MgO films were prepared from ceramic targets. The Xenon beam distortion caused by charging at the target surface is avoided with a neutralizer (e-beam), which is truly important for the SiO2 and MgO deposition control, since it assures minimum beam deflection upon target surface charging, and therefore, a stable deposition rate along several hours of deposition. A deficient neutralization causes different SiO2 and MgO films thicknesses across the multilayer, i.e., the bottom layers near the substrate have different thickness comparing with the top layers.
The TiO2 films were prepared from a metallic target, using a Xenon beam and an assisted ion beam (Ar+ - O+), extracted from the assist gun through a grid assembly, increasing the deposition pressure to 1.4 mTorr. The assist beam current was maintained low in order to minimize the material etching while depositing. Again, a neutralizer beam was used to avoid the assisted beam distortion.
First, SiO2, TiO2 and MgO films were deposited on silicon substrates in order to calibrate the individual deposition rate and refractive index. Then, several SiO2, TiO2 and MgO thin-films with different thicknesses, close to the simulated ones (see Table 1), were deposited on the top of silicon wafers, in order to further measure the experimental refractive indices dependence on the wavelength and films thickness. These dependencies are crucial to the optical filter performance and cannot be disregarded, as they impact the maximum transmittance peak wavelength and the FWHM. The knowledge of the real optical properties of the films allows the adjustment of the previous simulations upon fabricating each optical filter in the specific spectral band. Therefore, the test samples had a range of thicknesses as close as possible to the ones previously simulated (see Table 1).
The variation of the refractive index with wavelength in the range of 350 nm to 750 nm, in steps of 5 nm, was obtained by spectroscopic ellipsometry using a nanofilm EP3-SE ellipsometer from Accurion GmbH (at INL, Braga). The refractive index was determined by fitting the ellipsometric parameters with a Cauchy model. Figure 4(A) to 4(B) show the measured refractive index as a function of wavelength, for the different thicknesses, of the SiO2, TiO2 and MgO films, respectively. Moreover, the obtained thicknesses of each film were confirmed by profilometry, using a Veeco Dektak 150 profilometer.
Fig. 4.
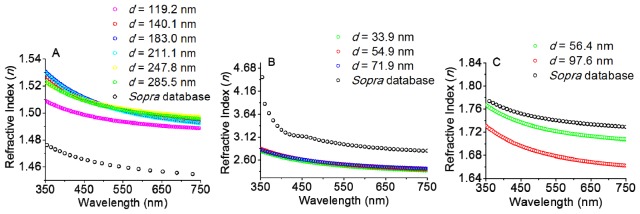
Comparison between the refractive indices of the Sopra Database and the ones obtained experimentally, for different thicknesses () of SiO2 (A), TiO2 (B) and MgO (C). The presented thicknesses are measured by profilometry.
The measurements shown in Fig. 4 allow concluding that there are significant differences between the refractive indices obtained experimentally and the ones used on the simulations, provided by Sopra database. Moreover, the refractive index is dependent on the wavelength, and also on the film thickness. The latter variation is especially significant for the MgO films and for the UV/VIS (350 nm – 450 nm) spectral region of the SiO2 and TiO2 films. Notice that the theoretical refractive indices from Sopra database do not have either the thickness either the deposition parameters dependences. The latter will extremely influence the optical characteristics of the films and, thus, must be obtained carefully. Notice that the TiO2 film thickness for the filters had to be redefined upon optical characterization of the single films, which indicated a different refractive index from the theoretical one. This is not unexpected, however, because assisted deposition allows tuning the oxygen content in the films, and creates amorphous films (while databases use their crystalline phase). As a consequence, the layers thicknesses to be used in the multilayer (Fabry-Perot structure) must be adjusted for maintaining the desired optical properties of the fabricated filters. Such adjustment will be explained on the next section – section 4.
4. Optical filters design adjustment
After the theoretical optical filters design using the refractive indices from Sopra database (section 2), the experimental refractive indices values of SiO2, TiO2 and MgO (presented in Fig. 4(A) to 4(C)), were used in the TFCalc design software, to adjust the layers thicknesses in order to obtain the optical filters centered at the required 16 spectral bands (otherwise, it will be deviated).
To better observe the effect of the refractive indices variation in the filters maximum transmittance peak and FWHM, Fig. 5 compares the simulations for a filter (initially designed for 510 nm peak, see Table 1) with the same layers thicknesses and materials, but with different refractive indices – refractive indices from Sopra database and experimental refractive indices. As it can be seen, the use of the same materials and thicknesses but with different refractive indices causes a peak deviation of 15 nm and a wide FWHM.
Fig. 5.
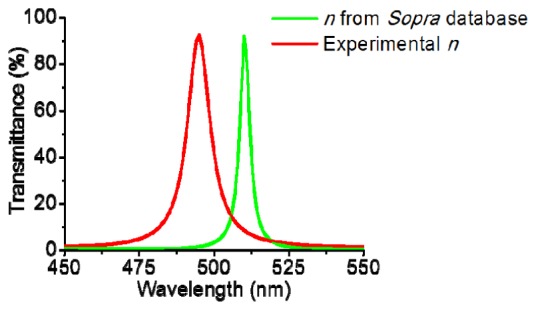
Simulated transmittance spectra for an optical filter initially designed for 510 nm maximum transmittance peak. The two curves are obtained using the refractive indices provided by the Sopra database (n from Sopra database) and the experimental refractive indices (Experimental n), maintaining the layers structure thicknesses and materials.
Thus, for each optical filter, the resonance cavity and the mirrors films thicknesses were adjusted according to the new refractive indices, measured experimentally (Fig. 4(A) to 4(C)) and the measured thicknesses. Table 2 presents this optimization and Fig. 6(A) to 6(C) show their simulation results. This time, it was also possible to present the transmittance of the 350 nm optical filter, using the experimental refractive indices of the MgO and TiO2 materials, mainly due to the lower and more constant experimental TiO2 refractive index value in the UV/VIS region, when compared with the one provided by the Sopra database.
Table 2. Layer thicknesses of the optical filters in the UV/VIS, VIS and VIS/IR regions, with the combinations MgO/TiO2 and SiO2/TiO2, after the design adjustment.
| Maximum transmittance peak wavelength (nm) | |||||||||||||||||
|---|---|---|---|---|---|---|---|---|---|---|---|---|---|---|---|---|---|
| 350 | 370 | 380 | 400 | 420 | 450 | 480 | 510 | 540 | 560 | 580 | 600 | 620 | 650 | 700 | 750 | ||
| Layer Thickness (nm) | Layer Thickness (nm) | ||||||||||||||||
| TiO2 | 37 57 37 57 37 |
TiO2 | 37 67 37 67 37 |
55 92 55 92 55 |
70 114 70 114 70 |
||||||||||||
| MgO | SiO2 | ||||||||||||||||
| TiO2 | TiO2 | ||||||||||||||||
| MgO | SiO2 | ||||||||||||||||
| TiO2 | TiO2 | ||||||||||||||||
|
MgO (RC) |
70 | 92 | 101 | 118 |
SiO2 (RC) |
149 | 177 | 122 | 149 | 175 | 192 | 209 | 227 | 175 | 202 | 243 | 287 |
| TiO2 | 37 57 37 57 37 |
TiO2 | 37 67 37 67 37 |
55 92 55 92 55 |
70 114 70 114 70 |
||||||||||||
| MgO | SiO2 | ||||||||||||||||
| TiO2 | TiO2 | ||||||||||||||||
| MgO | SiO2 | ||||||||||||||||
| TiO2 | TiO2 | ||||||||||||||||
Fig. 6.
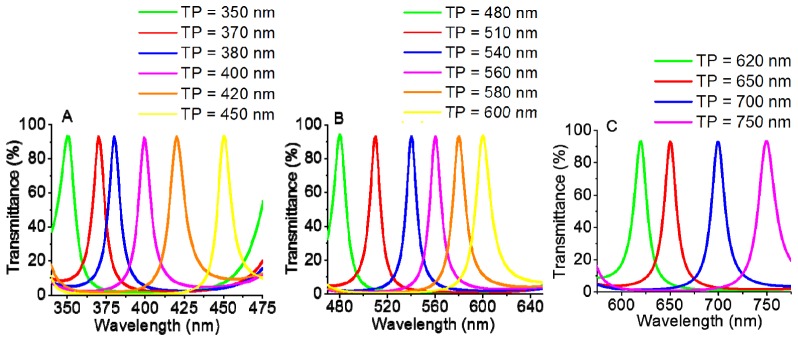
Simulated transmittance spectra for the UV/VIS optical filters (A), VIS optical filters (B) and VIS/IR optical filters (C) after the design adjustment (TP: filter maximum transmittance peak wavelength).
The use of the experimental refractive indices allows achieving each spectral band with higher transmittance, close to 90%, even for the optical filter centered at 350 nm. However, the FWHM increased slightly (average around 13 nm), as might be expected since the experimental n value for TiO2 is lower, being less metallic and more dielectric. However, this FWHM increase is not critical for the described application. As it can be seen in Fig. 6, the transmittance background noise is around 20%, except for the optical filter centered at 350 nm; and the interference of each neighbor peak is around 25%, except for the two filters centered at 370 nm and 380 nm, which is close to 40%. Therefore, despite the filters performance in terms of a narrow spectral bandpass is not as expected with the first theoretical simulations, they are still suitable for the described application. The optical filters performance could be improved increasing the number of dielectric layers. However, the fabrication process complexity will also increase. Thus, it is important to ensure a compromise between the filters performance and the complexity inherent to the filters fabrication process.
5. Optical filters fabrication and characterization
After the layer thicknesses adjustment, the 16 optical filters were deposited, as described in section 3, on a borosilicate glass substrate with 0.7 mm thickness and 25 × 25 mm2 area, adjusting the deposition time to obtain the thicknesses presented on Table 2. The optical transmittance of the borosilicate glass is higher than 90% in the required spectral band, 350 nm to 750 nm [15], making this substrate suitable for the optical filters fabrication and future characterization. Before the deposition, the substrate was ultrasonically cleaned with Alconox solution for 30 minutes. After that, it was cleaned with deionized water and blown dry with compressed air gun.
The deposition of the 16 filters was done using a combined process, where the first several multilayers were deposited without vacuum break for substrates with the same composition set (first mirror). Then, the samples were split (with vacuum break) for individual resonant cavity layer deposition. Finally, the top multilayers were again deposited upon combining several samples from the same set (second mirror).
Figure 7 shows photographs of some of the fabricated optical filters. It is important to refer that the photographs were obtained using an Olympus CKX41 microscope (40 × ) and commercial optical wide bandpass filters (on the top of the fabricated filters), in order to eliminate the second order effects of the fabricated optical filters far outside their main spectral region.
Fig. 7.
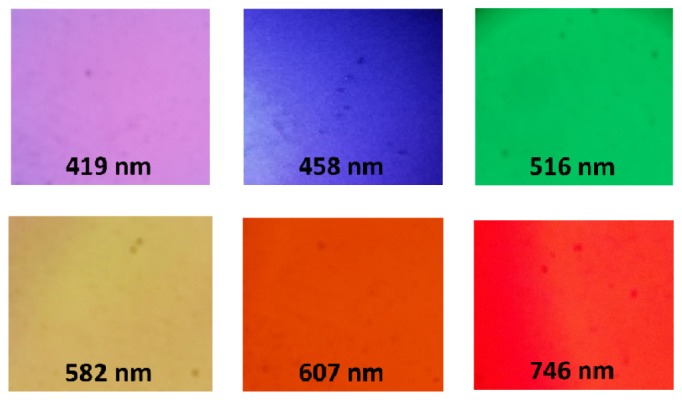
Photographs of some of the fabricated optical filters obtained with a microscope.
Figure 8(A) to 8(C) show the measured transmittance of the fabricated optical filters, using a commercial UV-Vis-NIR spectrophotometer (Shimadzu UV 3101PC). It can be seen that the optical transmittance is close to 80%, except for the filters initially designed for 350 nm and 370 nm.
Fig. 8.
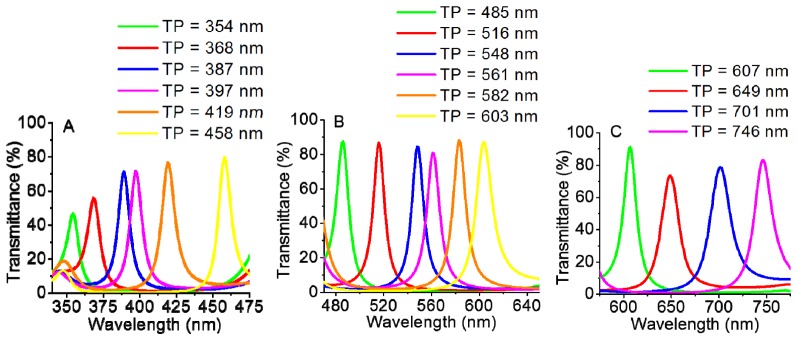
Measured transmittance spectra for the UV/VIS fabricated optical filters (A), VIS fabricated optical filters (B) and VIS/IR fabricated optical filters (C), (TP: filter maximum transmittance peak wavelength).
Table 3 shows a comparison between the simulated and the fabricated optical filters, highlighting the maximum transmittance peak to better observe the deviations. Concerning the filters FWHM, its average is around 11 nm for the UV/VIS optical filters, 13 nm for the VIS optical filters and 20 nm for the VIS/IR optical filters. The transmittance background noise is around 20%, except for the filter centered at 582 nm, which is close to 40%; and the interference of each neighbor peak is around 25%, except for the two filters centered at 387 nm and 397 nm, which is close to 40%. The maximum peak deviation was 13 nm for the filter initially programmed for 620 nm.
Table 3. Comparison of the maximum transmittance peak obtained for the simulated and fabricated optical filters.
|
Optical Filter |
1 | 2 | 3 | 4 | 5 | 6 | 7 | 8 | 9 | 10 | 11 | 12 | 13 | 14 | 15 | 16 |
|---|---|---|---|---|---|---|---|---|---|---|---|---|---|---|---|---|
|
Maximum transmittance peak simulated (nm) |
350 | 370 | 380 | 400 | 420 | 450 | 480 | 510 | 540 | 560 | 580 | 600 | 620 | 650 | 700 | 750 |
|
Maximum transmittance peak measured (nm) |
354 | 368 | 387 | 397 | 419 | 458 | 485 | 516 | 548 | 561 | 582 | 603 | 607 | 649 | 701 | 746 |
| Peak Deviation | 4 | −2 | 7 | −3 | −1 | 8 | 5 | 6 | 8 | 1 | 2 | 3 | −13 | −1 | 1 | −4 |
The FWHM could be improved increasing the number of the dielectric layers that form the mirrors. However, the complexity of the fabrication process in terms of deposition time and cost will also increase. An increase in the TiO2 refractive index (n about 3.2) will also improve the FWHM (around 5 nm). The TiO2 films deposited by IBD (and in general in all large area industrial deposition tools) are amorphous, which results in a refractive index lower than that of the crystalline phase. Therefore, increasing FWHM would be possible upon crystallization of these materials using high temperature annealing, under high pressure of oxygen. Not only this is incompatible with many wafer production lines, this adds extra complexity to the microfabrication process and increases the final cost. Thus, taking all this into account, it is important to ensure a compromise between the desired filters performance and the complexity inherent to the filters fabrication process.
Table 4 presents a comparison between the fabricated bandpass optical filters and some of the commercially available. Figures of merit for comparison are the optical properties under the 350-750 nm frequency range (FWHM, transmittance), integration capability (size, substrate independent) and cost (per area). As it can be observed, despite similar optical performance, no commercial products can be integrated due to the large size (area and thickness), while thin-film deposition is an ultra-compact method to reduce the filter footprint to dimensions as low as hundreds of microns. Moreover, large area, large scale production is also compatible, not only for the filters, but for the full chip. Finally, the optical filter costs are much smaller for the thin-films, particularly upon optimization was done, and a large number of wafers can be produced in a batch with the optimized film thicknesses, for each filter.
Table 4. Comparison between the fabricated optical filters and some of the commercially available. Data includes filters within the 340nm-750nm range.
| Supplier and filter reference | FWHM (nm) | Transmittance of all filters in range | Filter thickness # | Filter area | Integration in chip ? | Indicative cost /mm2 |
|---|---|---|---|---|---|---|
| Edmund optics Ref: xxx-CWL (*) |
10 ± 2 | ± 85% | 5 mm minimum |
12.5 mm diameter Other areas not available |
No | 1 € |
| Thorlabs Ref: FBxxx-10 (&) |
From 10 to 40 | From 35% to 90% | 6.3 mm minimum |
25.4 mm diameter Other areas not available |
No | 0.1 € |
| Newport Ref: 10BPF10-xxx (§) | From 10 to 70 | From 30% to 60% | 6.3 mm minimum |
25.4 mm diameter Other areas not available |
No | 0.3 € |
| This work – thin-film optical filter | From 10 to 17 | From 56% to 81% | 0.7 mm Any substrate is possible |
Down to 0.1 × 0.1 mm | Yes | 0.07 € |
(*) information available at: http://www.edmundoptics.eu/optics/optical-filters.
(&) information available at: https://www.thorlabs.com.
(§) information available at: http://search.newport.com
# includes glass and optical filter hard coating
Additionally, some of the fabricated filters were characterized by Scanning Electron Microscopy (SEM), using the NanoSEM - FEI Nova 200 equipment (at SEMAT, University of Minho). Figure 9 displays a SEM image showing the cross-section of the filter number 6 presented on Table 3 (458 nm maximum transmittance peak wavelength), with the layer thicknesses values measured by SEM. As it can be observed, there is a clear separation between the SiO2 and TiO2 thin-films. Moreover, there is a good film flatness along the entire analyzed area, ensuring the parallelism between the mirrors and the resonant cavity, which is crucial for the feasibility of the optical measurements.
Fig. 9.
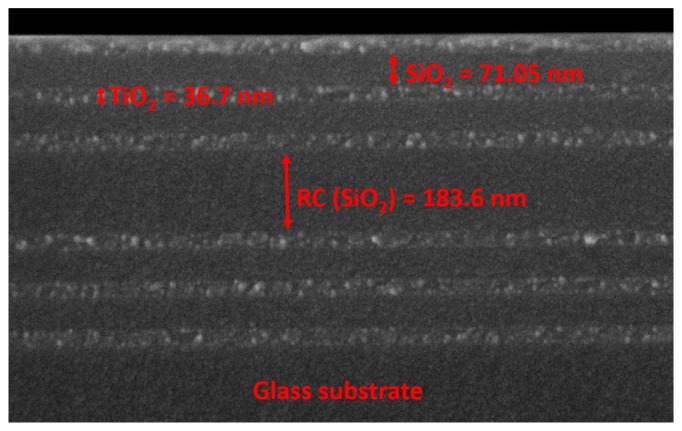
SEM image showing the cross-section of the 458 nm Fabry–Perot optical filter with 11 layers: TiO2 and SiO2 layer thicknesses for the two parallel mirrors are equal to 36.7 and 71.05 nm, respectively, while the resonance cavity (RC) thickness is equal to 183.6 nm; magnification 200,000 times. The measured total layers thickness is 688 nm.
The total thickness of the same optical filter was also measured using the Veeco Dektak 150 profilometer. Table 5 shows the obtained differences between the theoretical, the profilometer and the SEM measurements. As expected, the thickness obtained with the profilometer is close to the one obtained with SEM, but both are slightly deviated with the simulated one. This deviation explains the maximum peak transmittance wavelength deviation that was obtained in the measurements (see Table 3).
Table 5. Comparison between the optical filter theoretical thickness with the experimental one obtained by profilometry and by SEM.
| Theoretical | Profilometer | SEM | |
|---|---|---|---|
| Total filter thickness | 667 nm | 684.7 nm | 688 nm |
Figure 10 shows the surface 3-D map of the same optical filter, in a 400 µm by 400 µm area, using the Veeco Dektak 150 profilometer, in order to evaluate the multilayer surface roughness. As it can be seen, the optical filter surface is smooth (roughness average of 1.21 nm), leading to conclude, once again, that the film has good flatness, ensuring the parallelism between the mirrors and the resonant cavity. This feature is achieved due to the IBD fabrication process.
Fig. 10.
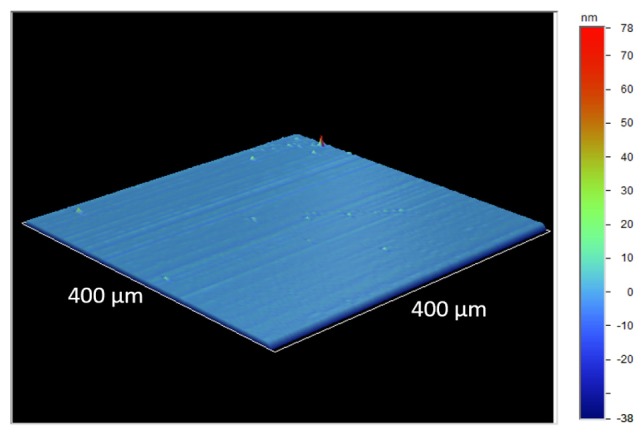
Surface 3-D map of the 458 nm Fabry–Perot optical filter.
These characterization results can explain (in part) the peak deviations of the optical filters, since the simulations performed with the same materials and the thicknesses obtained with SEM are similar to the optical characterization performed with the commercial equipment. However, it is also important to note that, as previous emphasized, the materials refractive indices are affected by their thickness, introducing an additional constraint in programming the fabrication of optical filters centered at the desired spectral bands. In fact, the design and fabrication of the optical filters is a time consuming and challenging process, since there are several variables that need a precise control and constant adjustment, according to the measurements.
Thus, there must be a compromise between the filters performance needed for the described application and the complexity inherent to the filters fabrication process. As a result, although the filters transmittance and performance in terms of a narrow transmission are slightly deviated from the simulated, the most important is to evaluate the filters performance and their viability to correctly extract the spectroscopic signals, specifically diffuse reflectance and fluorescence signals, performing spectroscopic measurements with phantoms representative of GI tissues with different biochemical compositions – section 6.
6. Diffuse reflectance and fluorescence signals measurements with the optical filters on tissue phantoms
The performance of the fabricated optical filters to extract the spectroscopic signals was carried out by a set of experimental measurements of diffuse reflectance and fluorescence signals. For that purpose, it were used several phantoms representative of the changes that occur in the GI tissues during cancer progression, and the fabricated optical filters, placed in front of a UV-Vis-NIR spectrophotometer (Shimadzu UV 3101PC) and a spectrofluorometer (SPEX® FluoroLog® 2) detectors. This procedure allows determining the accuracy of the filters to extract the signals at all the relevant spectral bands (350 nm to 750 nm), even with the obtained deviations concerning the filters performance in terms of maximum transmission peak and FWHM (previous discussed in section 5).
The phantoms consist of a liquid homogeneous mixture of hemoglobin (Hb), 1 µm polystyrene beads (representative of collagen fibers), fluorophores NADH (reduced form of nicotinamide adenine dinucleotide) and Carbostyril 124 (representative of collagen), and water (see Table 6). In these phantoms, are represented the absorbing, scattering and fluorescence properties of the GI tissues that change during cancer progression, leading to a change in the diffuse reflectance and fluorescence signals intensity and shape.
Table 6. Phantoms used for the spectroscopic measurements.
|
Hemoglobin concentration (mg/mL) |
Polystyrene beads concentration (%) |
NADH concentration (µg/mL) |
Carbostyril 124 concentration (µg/mL) |
|---|---|---|---|
| 0.50 (a) | 0.50 | 1.00 | 1.00 |
| 0.50 (b), (d) | 0.25 | 1.00 | 1.00 |
| 1.00 (c) | 0.15 | 1.50 | 0.50 |
| 1.00 (e) | 0.25 | 1.00 | 1.00 |
| 1.00 (f) | 0.15 | 1.50 | 0.50 |
First, the spectra of the GI tissue phantoms were measured without using the fabricated optical filters. After that, the same measurements using each fabricated optical filter in front of the detection system were performed, exactly for the same phantoms. Figure 11(A) shows the experimental diffuse reflectance spectra measured with the commercial UV-Vis-NIR spectrophotometer (blue lines on Fig. 11(A)) and the reconstructed spectra obtained using the fabricated optical filters (green lines on Fig. 11(A)), for three phantoms. Figure 11(B) shows the experimental fluorescence spectra measured with the commercial spectrofluorometer (blue lines on Fig. 11(B)) and the reconstructed spectra obtained using the fabricated optical filters (green lines on Fig. 11(B)), also for three phantoms. It is important to explain that the reconstructed spectra were obtained by the application of a spline Matlab function and based only in the 16 values extracted using the fabricated optical filters in the measurements (discrete intensity values on Fig. 11(A) and Fig. 11(B)). Moreover, it is also important to note that the fluorescence signal is only represented between 365 and 610 nm, since that range is representative of the fluorescence emission properties of the fluorophores NADH and Carbostyril 124 [16, 17]. Outside that region, the fluorescence emission tends to zero. As a result, it were used only 12 optical filters, filters 2 to 13 (see Table 3) to extract the fluorescence signal. However, the ultimate goal is to implement a microsystem to extract both signals – diffuse reflectance and fluorescence – maintaining the importance of the 16 optical filters in the case of diffuse reflectance and its good performance.
Fig. 11.
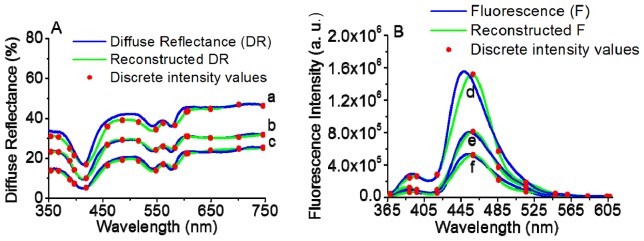
Experimental spectra measured with commercial equipment (blue lines) and reconstructed spectra (green lines) obtained using the discrete intensity values extracted with the 16 fabricated optical filters (red points). (A) - Diffuse reflectance from phantoms a, b and c (see Table 6). (B) - Fluorescence from phantoms d, e and f (see Table 6).
Figure 11(A) and 11(B) show that the intensity values obtained with the fabricated filters were similar to the experimental values obtained using only the commercial equipment, over the full wavelength range.
To evaluate precisely the performance of the fabricated optical filters to extract the spectroscopic signals, a Spearman’s rank correlation between the experimental and reconstructed spectra were performed in the SPSS software, for each phantom and for each type of spectroscopic signal – diffuse reflectance and fluorescence.
Spearman’s rank correlation is a non-parametric test (suitable for a small number of samples), which not considers any assumptions about the distribution of the data and is appropriate for ordinal variables. For the diffuse reflectance signal, the results obtained for the Spearman’s correlation coefficient () were: for phantom a, for phantom b and for phantom c. For the fluorescence signal, the results obtained forwere: for phantom d, for phantom e and for phantom f. Moreover, all the correlations were considered significant at a 0.01 level (). Notice that, despite having only one filter in the main fluorescent peak (around 450 nm), it is enough for the reconstruction of the fluorescence signal, as it can be observed by the Spearman’s correlations (higher that 0.987) between the original spectra and the ones obtained using the 12 fabricated filters. Contrarily, in the reflectance signal extraction, the spectral bands required to an appropriate spectral reconstruction are more and more close to each other, since two phantoms properties, the absorbance and scattering of the tissues, affect both the intensity and shape of the diffuse reflectance signal.
With these results it is confirmed the feasibility of using the 16 thin-film narrow bandpass fabricated optical filters to correctly extract the diffuse reflectance and fluorescence signals, and consequently, to implement the microsystem previously described.
7. Conclusion
Along this paper, the design, optimization and fabrication of 16 MgO/TiO2 and SiO2/TiO2 based narrow bandpass optical filters were presented. Moreover, they were characterized through optical transmittance, selectivity capacity (FWHM), SEM and profilometry. The design and fabrication of the optical filters was a challenging process, since there are several variables that must be precisely controlled to obtain optical filters centered at the desired spectral bands and with the desired FWHM. Here, a compromise between the filters performance for the described application and the complexity inherent to the filters fabrication process was accomplished.
In spite of some deviations from the simulations that were performed during the design and filters optimization, their performance to extract spectroscopic signals from GI tissue phantoms was successfully evaluated. The results obtained with the diffuse reflectance and fluorescence measurements, specifically the high Spearman’s correlations between the original spectra and the ones obtained using the 16 fabricated filters (higher that 0.981), allow concluding the potential of using the 16 optical filters in the application under this paper, in order words, in the implementation of the microsystem previously described. Thus, it is intended to bond the 16 optical filters to an array (4 × 4) of silicon photodiodes with readout electronics illuminated by UV and white-light miniaturized LEDs (all on a single chip). The research team has already proved the viability of using silicon photodiodes with an area of 100 × 100 µm2, fabricated in a standard 0.7 µm CMOS process, to accurately extract those spectroscopic signals, using also GI tissue phantoms [18]. So, the microsystem is about to be implemented, which will have a clinical huge value as an auxiliary device in GI tissues characterization due to its use in-loco, such as in a surgery room for inspecting total removing of cancer tissue.
Acknowledgments
This work is funded by FEDER funds through the “Eixo I do Programa Operacional Fatores de Competitividade” (POFC) QREN, project reference COMPETE: FCOMP-01-0124-FEDER-020241 and by FCT—Fundação para a Ciência e a Tecnologia, project reference PTDC/EBB-EBI/120334/2010. The authors thank to the PEst-C/FIS/UI0607/2013 for the use of spectroscopic equipment. The authors also thank to V. Pinto from CMEMS-UMinho for the support during the profilometry measurements. S.P. thanks the FCT for the SFRH/BD/87605/2012 PhD grant.
References and links
- 1.World Health Organization, “Fact sheet Nº297,” (November, 2014), http://www.who.int/mediacentre/factsheets/fs297/en/ (accessed on 12 March 2015).
- 2.Georgakoudi I., Jacobson B. C., Van Dam J., Backman V., Wallace M. B., Müller M. G., Zhang Q., Badizadegan K., Sun D., Thomas G. A., Perelman L. T., Feld M. S., “Fluorescence, reflectance, and light-scattering spectroscopy for evaluating dysplasia in patients with Barrett’s esophagus,” Gastroenterology 120(7), 1620–1629 (2001). 10.1053/gast.2001.24842 [DOI] [PubMed] [Google Scholar]
- 3.Yu C.-C., Lau C., O’Donoghue G., Mirkovic J., McGee S., Galindo L., Elackattu A., Stier E., Grillone G., Badizadegan K., Dasari R. R., Feld M. S., “Quantitative spectroscopic imaging for non-invasive early cancer detection,” Opt. Express 16(20), 16227–16239 (2008). 10.1364/OE.16.016227 [DOI] [PMC free article] [PubMed] [Google Scholar]
- 4.Georgakoudi I., “The color of cancer,” J. Luminescence 119, 75–83 (2006). [Google Scholar]
- 5.Brown J. Q., Vishwanath K., Palmer G. M., Ramanujam N., “Advances in quantitative UV-visible spectroscopy for clinical and pre-clinical application in cancer,” Curr. Opin. Biotechnol. 20(1), 119–131 (2009). 10.1016/j.copbio.2009.02.004 [DOI] [PMC free article] [PubMed] [Google Scholar]
- 6.Lo J. Y., Yu B., Fu H. L., Bender J. E., Palmer G. M., Kuech T. F., Ramanujam N., “A strategy for quantitative spectral imaging of tissue absorption and scattering using light emitting diodes and photodiodes,” Opt. Express 17(3), 1372–1384 (2009). 10.1364/OE.17.001372 [DOI] [PubMed] [Google Scholar]
- 7.Zonios G., Perelman L. T., Backman V., Manoharan R., Fitzmaurice M., Van Dam J., Feld M. S., “Diffuse reflectance spectroscopy of human adenomatous colon polyps in vivo,” Appl. Opt. 38(31), 6628–6637 (1999). 10.1364/AO.38.006628 [DOI] [PubMed] [Google Scholar]
- 8.Müller M. G., Georgakoudi I., Zhang Q., Wu J., Feld M. S., “Intrinsic fluorescence spectroscopy in turbid media: disentangling effects of scattering and absorption,” Appl. Opt. 40(25), 4633–4646 (2001). 10.1364/AO.40.004633 [DOI] [PubMed] [Google Scholar]
- 9.Ferreira D. S., Mirkovic J., Wolffenbuttel R. F., Correia J. H., Feld M. S., Minas G., “Narrow-band pass filter array for integrated opto-electronic spectroscopy detectors to assess esophageal tissue,” Biomed. Opt. Express 2(6), 1703–1716 (2011). 10.1364/BOE.2.001703 [DOI] [PMC free article] [PubMed] [Google Scholar]
- 10.Macleon H. A., Thin-Film Optical Filters, 3 ed. (Institute of Physics Publishing, 2001). [Google Scholar]
- 11.Minas G., Wolffenbuttel R. F., Correia J. H., “An array of highly selective Fabry–Perot optical channels for biological fluid analysis by optical absorption using a white light source for illumination,” J. Opt. A, Pure Appl. Opt. 8(3), 272–278 (2006). 10.1088/1464-4258/8/3/008 [DOI] [Google Scholar]
- 12.Minas G., Martins J. S., Ribeiro J. C., Wolffenbuttel R. F., Correia J. H., “An array of Fabry-Perot Optical-Channels for Biological Fluids Analysis,” Sens. Actuator A-Phys. 115(2-3), 362–367 (2004). 10.1016/j.sna.2004.03.077 [DOI] [Google Scholar]
- 13.Howard D. M., Charles P. D. I., Gary P., Ion Beam Vacuum Sputtering Apparatus and Method (European Patent EP1212777, 2001).
- 14.Cardoso S., Macedo R. J., Ferreira R., Augusto A., Wisniowski P., Freitas P. P., “Ion beam assisted deposition of MgO barriers for magnetic tunnel junctions,” J. Appl. Phys. 103(7), 07A905 (2008). 10.1063/1.2833823 [DOI] [Google Scholar]
- 15.Prazisions glas & optic, “BOROFLOAT® 33 Borosilicate Glass,” http://www.pgo-online.com/intl/katalog/borofloat.html (accessed on 13 March 2015).
- 16.Lakowicz J. R., Principles Fluorescence Spectroscopy 3 ed. (Springer, 2006). [Google Scholar]
- 17.Dai X., Rollin E., Bellerive A., Hargrove C., Sinclair D., Mifflin C., Zhang F., “Wavelength shifters for water cherenkov detectors,” Nucl. Instrum. Methods Phys. Res. A 589(2), 290–295 (2008). 10.1016/j.nima.2008.01.101 [DOI] [Google Scholar]
- 18.Pimenta S., Carmo J. P., Correia R. G., Castanheira E. M. S., Minas G., “Characterization of silicon photodiodes for diffuse reflectance signal extraction,” in Proceedings of IEEE 4th Portuguese Meeting on Bioengineering (IEEE, 2015); doi:. 10.1109/ENBENG.2015.7088844 [DOI] [Google Scholar]


