Abstract
Phosphatase and tensin homolog (PTEN), a well-known tumor suppressor gene and frequently mutated or lost in breast cancer, possesses the negative regulation function over the PI3K/Akt/mTOR pathway. PTEN insufficiency has been associated with advanced breast cancer and poor prognosis of breast cancer patients. Recently, target therapies aimed at PI3K/Akt/mTOR pathway to treat breast cancer have got popularity. However, the exact effect of PTEN on breast cancer cells is still not well understood. This study demonstrated that PTEN knockdown in MCF-7 cells strengthened the downstream gene expressions, including p-Akt, p-ERK1/2, p-mTOR, p-p70s6k, and p-GSK3β. PTEN knockdown MCF-7 cells had increased cell growth and Ki-67 expression. Further Western blot demonstrated that p27 was repressed obviously with p21 slightly inhibited and CDK1, 2, 4, 6, cyclin A, and Cdc25C were upregulated in MCF-7 PTEN knockdown cells, leading to the higher growth rate. More importantly, PTEN knockdown MCF-7 cells had higher tumorigenesis and tumor growth in vivo. From our current work, we provided more detailed PTEN-mediated mechanisms to stimulate ER+ breast cancer cell growth. Our result may pave the way for further target therapy development used alone or in combination with other drugs for ER+ breast cancer with PTEN insufficiency.
Keywords: PTEN, breast cancer, MCF-7, cell cycle, tumor growth, target therapy
Introduction
Breast cancer is the second most cause of cancer-related death for women.1 Although there has been recent enormous improvement in breast cancer treatment, 25%–50% of breast cancer patients would still develop metastasis eventually.2 Even with aggressive treatment, metastatic breast cancer patients have a 5-year survival rate <25%.3,4 Thus, more understanding of breast cancer molecular biology is urgently needed due to the need of new drugs to deal with advanced breast cancer.
Phosphatase and tensin homolog (PTEN) deleted on chromosome 10 is well identified as a tumor suppressor gene and found frequently mutated or deleted in a variety of cancers, such as endometrial cancer, prostate cancer, small-cell lung cancer, etc.5 For breast cancer, PTEN loss or mutation is found in a percentage of 13%, 24%, and 35% for luminal A, luminal B, and basal-like breast cancers, respectively.6 Clinically, PTEN loss has been linked to brain metastasis in breast cancer patients.7 PTEN promoter variations have also been shown to influence breast cancer recurrence and patient survival.8 Depowski et al also demonstrated that PTEN insufficiency was linked with breast cancer poor prognosis.9 Further, for Her2-positive breast cancer patients with recurrent or metastatic disease, PTEN loss might be a predictor for the resistance of trastuzumab-based salvage treatment.10
Since PTEN insufficiency activates the PI3K/Akt/mTOR pathway, a vital survival signal for cancer cells, specific inhibitors targeting PI13K/Akt/mTOR pathway proteins are now investigated as a new generation of anti-breast cancer regimens in clinical trials.11
Even though PTEN is a well-known tumor suppressor, and its related mechanism is widely studied, the detailed effect of PTEN on breast cancer is still not well understood. In this current study, we aimed to investigate PTEN effect on ER+ MCF-7 breast cancer cells. Through more understating of PTEN effect on ER+ breast cancer cells, we hoped to provide more treatment targets for ER+ breast cancer patients with PTEN insufficiency.
Materials and methods
Cell culture
Human breast cancer cell line, MCF-7, was obtained from Bioresource Collection and Research Center (BCRC, Taiwan). No ethics statement was required from the institutional review board for the use of this cell line. MCF-7 cells were grown in Dulbecco’s Modified Eagle’s Medium (Sigma) supplemented with 5% fetal bovine serum.
Knockdown PTEN
MCF-7 cells were transducted with shRNA control transduction particles (H1(shRNA-Ctr)-GP, GenTarget Inc., San Diego, CA, USA) or PTEN shRNA lentiviral transduction particles (GenTarget Inc.,) according to the manufacturer’s protocol. Two days after transduction, the cells (MCF-7-COLsi and MCF-7-PTENsi) were selected by incubation with 10 μg/mL puromycin dihydrochloride.
Cell proliferation and Ki-67 expression
The cell proliferation was measured using a WST-1 cell proliferation assay kit (11644807001, Roche Diagnostics GmbH, Mannheim, Germany). The Ki-67 expression was measured by flow cytometry, and the detail was described previously.12
Propidium iodide staining
MCF7-COLsi and MCF7-PTENsi-2 cells were stained with a solution containing 4 μg/mL propidium iodide (PI) and 100 μg/mL RNaseA in 1× phosphate buffered saline and incubated in the dark for 30 minutes.
Real-time reverse transcription-polymerase chain reaction
Quantitative polymerase chain reaction (qPCR) was performed using an ABI StepOne Plus Real-Time PCR system (Thermo Fisher Scientific, Waltham, MA, USA). FAM dye-labeled TaqMan MGB probes as well as PCR primers for human PTEN (Hs00171132_m1) and β-actin (Hs01060665_g1) were purchased from Thermo Fisher Scientific.
Western blot for protein expression
The procedures for protein extraction, blocking, and detection were described previously.13 The primary antibodies used in this study were monoclonal antibodies against p21 (2947; Cell Signaling, Danvers, MA, USA), p27 (3698; Cell Signaling), Cdc25C (4688; Cell Signaling), CDK1 (ab131450; Abcam, Cambridge, MA, USA), CDK2 (ab6538; Abcam,), CDK4 (2906; Cell Signaling), CDK6 (3136; Cell Signaling), cyclin A (644001; Biolegend, San Diego, CA, USA), PTEN antiserum (9552; Cell Signaling,), Akt (4691S; Cell Signaling), Phospho-Akt (ser473; 9271; Cell Signaling), Phospho-Akt (thr308; 2964; Cell Signaling), mTOR (2983, Cell Signaling), Phospho-mTOR (2971; Cell Signaling), p70s6k (9202; Cell Signaling), Phospho-p70s6k (9234; Cell Signaling), GSK3β (12456; Cell Signaling), Phospho-GSK3β (5558; Cell Signaling), or β-actin antiserum (I-19, Santa Cruz Biotechnology).
Flow cytometry for cell cycle analysis
The cells were trypsinized, fixed in ethanol, digested in Triton X-100 and ribonuclease, and stained with propidium iodide as described before.14 Cell cycle analysis was performed using FACS-Calibur cytometer and CellQuestPro software (BD Biosciences, San Jose, CA, USA).
Tumor xenografts
The study was approved by the Chang Gung University Animal Research Committee (Permit Number: CGU13-055). Female nude mice (BALB/cAnN-Foxn1, 4 weeks old) were used in this experiment. Equal volumes of tumor cells and matrigel were mixed (total 100 μL, containing 5×10⁶ cells) to inject to the back of each mouse. Growth of the xenografts was measured after 3 weeks. Tumor volume was calculated as π/6× larger diameter × (smaller diameter)2 as described previously.15
Statistic analysis
The data from each group were compared by two sample, two tail, and unpaired t-test. P-value <0.05 was considered as a significant difference. Tumor volumes and weights in each group were calculated by the Mann–Whitney U-test.
Results
Knockdown of PTEN in MCF-7 cells
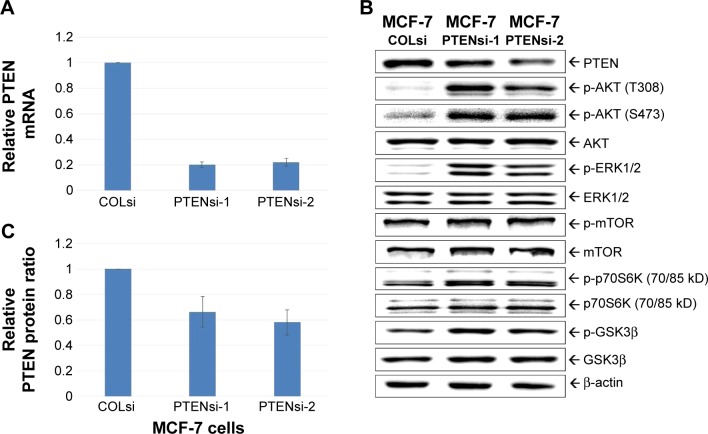
We successfully applied shRNA to knockdown PTEN in MCF-7 cells to create MCF7-COLsi (mock knockdown), MCF7-PTENsi-1 and MCF7-PTENsi-2 cells (two PTEN knockdown MCF-7 cell lines). The real-time reverse transcription-PCR result demonstrated PTEN mRNA was significantly lower in two selected clones, MCF7-PTENsi-1 and MCF7-PTENsi-2 cells (Figure 1A). The Western blot (Figure 1B) clearly showed that as PTEN knockdown, p-Akt, p-ERK1/2, p-mTOR, p-p70s6k, and p-GSK3β are upregulated in MCF7-PTENsi-1 and MCF7-PTENsi-2 cells. The quantitative result of Western blot revealed that MCF7-PTENsi-1 and MCF7-PTENsi-2 cells have only 66%±12% and 58%±10% PTEN expression as compared to MCF7-COLsi cells, respectively (Figure 1C). We then chose MCF7-PTENsi-2 cell for our further experiments.
Figure 1.
Knockdown of PTEN in MCF-7 cells.
Notes: (A) Quantitative PCR analysis of PTEN mRNA expression in MCF7-COLsi, MCF7-PTENsi-1, and MCF7-PTENsi-2 cells. Box (B) A Western blot to show PTEN and the downstream gene expressions in MCF7-COLsi, MCF7-PTENsi-1, MCF7-PTENsi-2 cells. (C) Quantitative Western blot result of PTEN expression in MCF7-COLsi and MCF7-PTENsi cells. Data were presented as the mean ± SD (n=3). The experiment was repeated three times.
Abbreviations: PTEN, phosphatase and tensin homolog; PCR, polymerase chain reaction; SD, standard deviation.
Knockdown of PTEN in MCF-7 cells increases cell proliferation
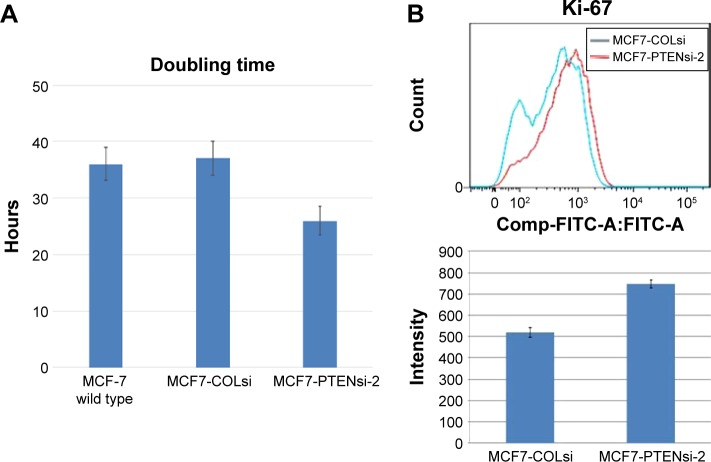
As shown in Figure 2A, MCF-7 wild type, MCF7-COLsi cells, and MCF7-PTENsi-2 had doubling time of 36±2.9 hours, 37±3 hours, and 26±2.5 hours, respectively, indicating PTEN knockdown in MCF-7 cells significantly increases cell growth. The result is supported by the measurement of Ki-67 expression in these two cells.16 Ki-67 expression of MCF7-PTENsi-2 cells was much higher than that of MCF7-COLs cells (Figure 2B).
Figure 2.
Effect of PTEN knockdown in cell growth of MCF-7 cells.
Notes: (A) Cell doubling time was calculated in MCF7-COLsi and MCF7-PTENsi-2 cells by three time points of cell viability measured with WST-1 method. (B) The effect of PTEN knockdown on Ki-67 expression in MCF-7 cells as determined by flow cytometry. Data were presented as the mean ± SD (n=3). The experiment was repeated three times.
Abbreviations: PTEN, phosphatase and tensin homolog; SD, standard deviation.
Evaluation PTEN effect on cell cycle distribution of MCF-7 cells
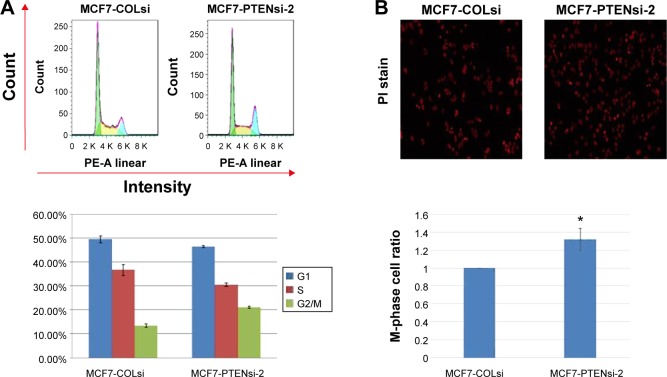
As analyzed by flow cytometry of cell cycle distribution (Figure 3A), MCF7-PTENsi-2 cells had 22%±1% G2/M phase cells, much higher than that of MCF7-COLsi cells, which had 14%±2% of G2/M phase cells. The G0/G1 phase cells were higher in MCF7-COLsi cells than in MCF7-PTENsi-2 cells (Figure 3A). To further clarify, MCF7-PTENsi-2 cells had more M or G2 phase cells than MCF7-COLsi cells, PI staining was performed to identify the M-phase cells, which have condensed chromatin. As shown in Figure 3B, MCF7-PTENsi-2 cells had 1.3-folds of M-phase cells as compared to MCF7-COLsi cells. Thus, based on our result, we concluded that PTEN knockdown in MCF-7 cells increases M-phase cells and decreases G0/G1 phase cells, indicating the higher mitotic rate, in line with the result shown in Figure 2.
Figure 3.
Effect of PTEN knockdown on cell cycle distribution of MCF-7 cells.
Notes: (A) The cell cycle distribution of MCF7-COLsi and MCF7-PTENsi-2 cells was analyzed by flow cytometry after 48-hours incubation (upper panel). The first, large peak represents population of cells (y-axis) in G0/G1 phase, the second, small peak represents population of cells in G2/M phase, and the area between both peaks indicates cells in S phase. The data were shown as the mean percentage ± SD (lower panel) (n=4). (B) PI stain to show condensed chromatin of MCF7-COLsi and MCF7-PTENsi-2 cells (upper panel). M-phase cell ratio of MCF7-COLsi and MCF7-PTENsi-2 cells. MCF7-COLsi was set as 1. Data were presented as the mean ratio ± SD (n=4) (*P<0.05). The experiment was repeated three times.
Abbreviations: PTEN, phosphatase and tensin homolog; SD, standard deviation; PI, propidium iodide.
Evaluation of mechanisms of PTEN to influence cell cycle progression in MCF-7 cells
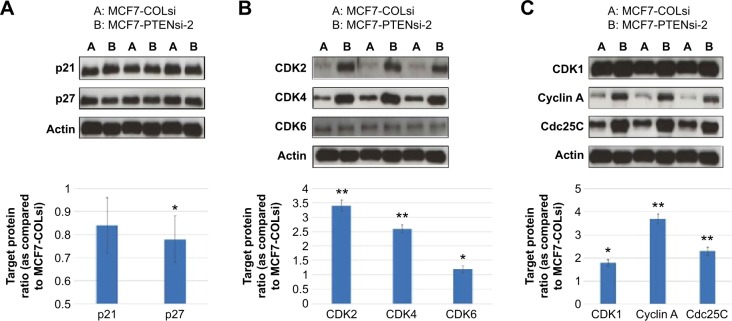
The cyclin-dependent kinase inhibitors (CKIs), p21 and p27, which repress G1/S transition,17 were measured. As shown in Figure 4A, p27 expression was much lower in MCF7-PTENsi-2 cells as compared to MCF7-COLsi cells. P21 expression was slightly decreased in MCF7-PTENsi-2 cells. We further measured cyclin-dependent kinases (CDKs), CDK2, CDK4, and CDK6 expressions in these two cell lines, which are crucial for G1/S transition. As shown in Figure 4B, CDK2, CDK4, and CDK6 expressions of MCF7-PTENsi-2 cells were increased to 3.4±0.2-, 2.6±0.14-, and 1.2±0.12-folds as compared to MCF7-COLsi cells. We next measured cyclin A, Cdc25C, and CDK1, which play important role during G2/M transition. Figure 4C demonstrates PTEN knockdown upregulated CDK1, cyclin A, and Cdc25c expressions to 1.8±0.13-, 3.7±0.23-, and 2.3±0.18-folds in MCF-7 cells. Collectively, PTEN knockdown in MCF-7 cells increases cell growth through downregulation of p21 (slightly decreased) and p27, and upregulation of CDK1, 2, 4, and 6, cyclin A, and Cdc25C.
Figure 4.
Effect of PTEN knockdown on cyclin A, CDKs, and CDKIs responsible for G1/S or G2/M transition in MCF-7 cells.
Notes: Since cell cycle progression from G1 to S is tightly controlled by related cyclins, CDKs and CDKIs, we thus investigated some G1/S related proteins expression. (A) A Western blot depicting p21 and p27 expressions in MCF7-COLsi and MCF7-PTENsi-2 cells (upper panel). Quantitative Western blot analysis of p21 and p27 expressions in MCF7-COLsi and MCF7-PTENsi-2 cells (lower panel) (n=3). (B) A Western blot demonstrating CDK2, 4, and 6 expression in MCF7-COLsi and MCF7-PTENsi-2 cells (upper panel). Quantitative Western blot analysis of CDK2, 4, and 6 expressions in MCF7-COLsi and MCF7-PTENsi-2 cells (lower panel) (n=3). (C) A Western blot showing cyclin A, CDK1, and Cdc25C expressions in MCF7-COLsi and MCF7-PTENsi-2 cells (upper panel). Quantitative analysis of cyclin A, CDK1, and Cdc25C expressions in MCF7-COLsi and MCF7-PTENsi-2 cells (lower panel) (n=3). The fold-induction data are expressed as of the intensity of the protein bands produced from the target gene/β-actin (± SE; n=4) relative to that of the MCF7-COLsi cells. The experiment was repeated three times. (**P<0.01; *P<0.05).
Abbreviations: PTEN, phosphatase and tensin homolog; SE, standard error.
Evaluation of PTEN knockdown effect on MCF-7 cell growth in vivo
After inoculation of 5×10⁶ of MCF7-COLsi or MCF7-PTENsi- 2 cells (mixed with matrigel), respectively, into the back of nude mice for 3 weeks, the xenografted tumors in both groups were harvested for weight and volume measurement. As shown in Figure 5, MCF7-PTENsi-2 cell group had 167%±13% and 180%±21% of tumor weight and volume as compared to that of MCF7-COLsi cell group. Moreover, five and nine out of ten mice could finally developed xenografted tumor in MCF7-COLsi and MCF7-PTENsi-2 groups, respectively. Our result indicates that PTEN knockdown in MCF-7 cells significantly increases tumorigenesis and tumor growth in vivo.
Figure 5.
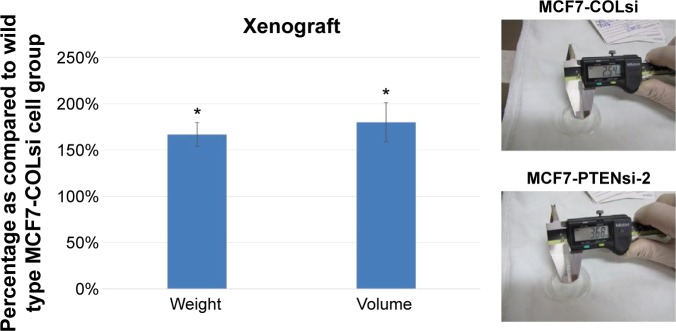
Evaluation of PTEN effect on MCF-7 cell tumorigenesis and progression in vivo.
Notes: MCF7-COLsi and MCF7-PTENsi-2 cells (5×10⁶) were equally mixed with matrigel and then injected into the back area of each nude mouse subcutaneously. The tumor volume and weight in each group were measured regularly. Data are presented as the percentage mean ± SE as compared to the MCF7-COLsi group (n=10) (*P<0.05).
Abbreviations: PTEN, phosphatase and tensin homolog; SE, standard error.
Discussion
PTEN, located in human chromosome 10q23 region, encodes a 403 aa, 47.17 kDa protein containing nine exons with distinct N-terminal and C-terminal.5 PTEN was first identified in 1997 and since then has been found to be inactivated frequently in a variety of human cancers. Thus, PTEN has been deemed widely as a tumor suppressor gene and become a focus to investigate in cancer treatment category.18,19
PTEN represses several mitogenic pathways to inhibit cancer cell proliferation or metastasis. Among others, PI3K is one of the most famous PTEN downstream proteins. About one-quarter breast cancer has been reported to have activating mutations in PIK3CA, encoding the PI3K catalytic subunit.20 Around 1%–14% breast cancer has also been demonstrated to gain increased copy number of PIK3CA.21,22 Thus, it is not surprised to find that one-fifth of breast cancer is shown to have PTEN deletion.9,23–25 Moreover, 34%–48% of breast cancer is reported to have PTEN promoter hypermethylation, leading to epigenetic silencing of PTEN.26,27
The array CGH result also indicated that PTEN allelic imbalance is highly associated with breast cancer brain metastasis.7 PTEN status has further been shown to relate to treatment response. A meta-analysis study reported that in HER2-positive recurrent or metastatic breast cancer patients, PTEN loss was adversely associated with trastuzumab-based salvage treatment in HER2-positive breast cancer patients with tumor recurrence or metastasis (RR =0.682, 95% confidence interval: 0.550–0.846).10 However, for breast cancer, the exact influence and mechanism induced by PTEN insufficiency is still not well understood.
As shown in Figure 1B, when PTEN is knocked down in MCF-7 cells, several downstream mitogenic protein phosphorylations are upregulated, such as p-AKT, p-ERK1/2, p-mTOR, p-p70S6K, and p-GSK3β.28 In this study, we clearly showed that PTEN knockdown in ER+ MCF-7 cells could increase MCF-7 cell growth. As shown in Figure 2A, the doubling time was decreased in MCF7-PTENsi-2 cells. The Ki-67 expression, a cell proliferation index, was increased in MCF-7 cells after PTEN knockdown (Figure 2B). Moreover, the in vivo xenograft animal model demonstrated that MCF7-PTENsi-2 cells had higher tumorigenesis and tumor progression than MCF7-COLsi cells. Collectively, we concluded that PTEN knockdown in ER+ MCF-7 cells stimulates cell growth in vitro and in vivo.
Previously, cell division is divided into two consecutive processes featured by DNA replication and replicated DNA separation into two separate cells. Further studies revealed that cell division could be categorized into four main stages, that is, G1, S, G2, and M phases.29 To further understand how PTEN insufficiency influences ER+ MCF-7 cell growth, we next analyzed the cell cycle distribution for both MCF7-COLsi and MCF7-PTENsi-2 cells by flow cytometry. Figure 3A revealed that PTEN knockdown increased G2/M phase cells and decreased G0/G1 phase cells in MCF-7 cells. Since G2 and M phase cells could not be distinguished by flow cytometry due to the same DNA amount for these two phase cells, we therefore stained DNA with PI to count M-phase cells, which have condensed chromatin, under the microscope. As shown in Figure 3B, MCF7-PTENsi-2 cells had more M-phase cells as shown by PI staining. Collectively, we concluded that PTEN knockdown in MCF-7 cells increased M phase cells and decreased G0/G1 phase cells, indicating increased cell proliferation, in accordance with the results shown in Figure 2.
E2F-1, one kind of transcriptional factor, is initially inactive due to binding to hypophosphorylated retinoblastoma protein amid cell cycle progression.30 In mid to late G1 phase, E2F-1 becomes active due to displacement from phosphorylated retinoblastoma protein, which is done by specific cyclin-bound CDKs. Active E2F-1 would further stimulate specific gene expression necessary for the cell to progress to S phase.31 The vital CDKs for G1/S transition include CDK 2, 4, and 6. As shown in Figure 4B, MCF7-PTENsi-2 cells had much higher expressions of CDK 2, 4, and 6 as compared to MCF7-COLsi cells. Further, specific endogenous CKIs inhibit the activity of cyclin–CDK complex required for G1/S transition. Among others, p21 and p27 are the two major CKIs related to G1/S transition.17 Figure 4A revealed that PTEN knockdown significantly repressed p27 expression with mild downregulation of p21 as compared to MCF7-COLsi cells. Subsequently, MCF7-PTENsi-2 cells had fewer cells staying in G0/G1 phase as compared to MCF7-COLsi cells (Figure 3A). The combination of cyclin A and CDK1 is crucial for G2/M transition.32,33 Cdc25C is capable of activation of cyclin A-bound CDK1 through removal of inhibitory phosphorylation.33 As shown in Figure 4C, MCF7-PTENsi-2 had higher expression of cyclin A, CDK1, and Cdc25C than MCF7-COLsi cells, leading to the higher percentage of M phase cells in MCF7-PTENsi-2 cells. Taken together, we concluded that PTEN knockdown in MCF-7 cells increases M phase cells and decreases G0/G1 phase cells through upregulation of CDK1, 2, 4, and 6, cyclin A, and Cdc25C and downregulation of p21 and p27 (for p27, the inhibition did not reach statistic significance).
Conclusion
Since PTEN is one frequently mutated or lost tumor suppressor gene in breast cancer and breast cancer with PTEN insufficiency indicates more advanced disease, targeting PTEN and its downstream signaling pathways has emerged as a new direction to treat breast cancer. In this study, we clearly show that PTEN knockdown increases MCF-7 cell growth in vitro and in vivo. As analyzed by flow cytometry, PTEN knockdown increases M phase cells and decreases G0/G1 phase cells in MCF-7 cells through modulating CKIs, CDKs, cyclin A, and Cdc25C expressions. Our results provide more targets to be aimed against ER+ breast cancer with PTEN insufficiency.
Acknowledgments
This work was supported by CMRPG2E0031 to Kun-Chun Chiang.
Footnotes
Disclosure
All authors declared there are no competing financial interests.
References
- 1.Jemal A, Bray F, Center MM, Ferlay J, Ward E, Forman D. Global cancer statistics. CA Cancer J Clin. 2011;61(2):69–90. doi: 10.3322/caac.20107. [DOI] [PubMed] [Google Scholar]
- 2.Siegel R, Naishadham D, Jemal A. Cancer statistics, 2012. CA Cancer J Clin. 2012;62(1):10–29. doi: 10.3322/caac.20138. [DOI] [PubMed] [Google Scholar]
- 3.Rabbani SA, Mazar AP. Evaluating distant metastases in breast cancer: from biology to outcomes. Cancer Metastasis Rev. 2007;26(3–4):663–674. doi: 10.1007/s10555-007-9085-8. [DOI] [PubMed] [Google Scholar]
- 4.Valastyan S, Weinberg RA. Tumor metastasis: molecular insights and evolving paradigms. Cell. 2011;147(2):275–292. doi: 10.1016/j.cell.2011.09.024. [DOI] [PMC free article] [PubMed] [Google Scholar]
- 5.Boosani CS, Agrawal DK. PTEN modulators: a patent review. Expert Opin Ther Pat. 2013;23(5):569–580. doi: 10.1517/13543776.2013.768985. [DOI] [PMC free article] [PubMed] [Google Scholar]
- 6.Cancer Genome Atlas N Comprehensive molecular portraits of human breast tumours. Nature. 2012;490(7418):61–70. doi: 10.1038/nature11412. [DOI] [PMC free article] [PubMed] [Google Scholar]
- 7.Wikman H, Lamszus K, Detels N, et al. Relevance of PTEN loss in brain metastasis formation in breast cancer patients. Breast Cancer Res. 2012;14(2):R49. doi: 10.1186/bcr3150. [DOI] [PMC free article] [PubMed] [Google Scholar]
- 8.Heikkinen T, Greco D, Pelttari LM, et al. Variants on the promoter region of PTEN affect breast cancer progression and patient survival. Breast Cancer Research. 2011;13(6):R130. doi: 10.1186/bcr3076. [DOI] [PMC free article] [PubMed] [Google Scholar]
- 9.Depowski PL, Rosenthal SI, Ross JS. Loss of expression of the PTEN gene protein product is associated with poor outcome in breast cancer. Modern Pathol. 2001;14(7):672–676. doi: 10.1038/modpathol.3880371. [DOI] [PubMed] [Google Scholar]
- 10.Wang Y, Liu Y, Du Y, Yin W, Lu J. The predictive role of phosphatase and tensin homolog (PTEN) loss, phosphoinositol-3 (PI3) kinase (PIK3CA) mutation, and PI3K pathway activation in sensitivity to trastuzumab in HER2-positive breast cancer: a meta-analysis. Curr Med Res Opin. 2013;29(6):633–642. doi: 10.1185/03007995.2013.794775. [DOI] [PubMed] [Google Scholar]
- 11.Paplomata E, O’Regan R. The PI3K/AKT/mTOR pathway in breast cancer: targets, trials and biomarkers. Ther Adv Med Oncol. 2014;6(4):154–166. doi: 10.1177/1758834014530023. [DOI] [PMC free article] [PubMed] [Google Scholar]
- 12.Chiang KC, Yeh CN, Hsu JT, et al. MART-10, a novel vitamin D analog, inhibits head and neck squamous carcinoma cells growth through cell cycle arrest at G0/G1 with upregulation of p21 and p27 and downregulation of telomerase. J Steroid Biochem Mol Biol. 2013;138:427–434. doi: 10.1016/j.jsbmb.2013.09.002. [DOI] [PubMed] [Google Scholar]
- 13.Chiang KC, Yeh CN, Chen TC. Vitamin d and pancreatic cancer-an update. Cancers (Basel) 2011;3(1):213–226. doi: 10.3390/cancers3010213. [DOI] [PMC free article] [PubMed] [Google Scholar]
- 14.Chung LC, Tsui KH, Feng TH, Lee SL, Chang PL, Juang HH. L-Mimosine blocks cell proliferation via upregulation of B-cell translocation gene 2 and N-myc downstream regulated gene 1 in prostate carcinoma cells. Am J Physiol. 2012;302(4):C676–C685. doi: 10.1152/ajpcell.00180.2011. [DOI] [PubMed] [Google Scholar]
- 15.Juang HH, Chung LC, Sung HC, et al. Metallothionein 3: an androgen-upregulated gene enhances cell invasion and tumorigenesis of prostate carcinoma cells. Prostate. 2013;73(14):1495–1506. doi: 10.1002/pros.22697. [DOI] [PubMed] [Google Scholar]
- 16.Scholzen T, Gerdes J. The Ki-67 protein: from the known and the unknown. J Cell Physiol. 2000;182(3):311–322. doi: 10.1002/(SICI)1097-4652(200003)182:3<311::AID-JCP1>3.0.CO;2-9. [DOI] [PubMed] [Google Scholar]
- 17.Okayama H. Cell cycle control by anchorage signaling. Cell Signal. 2012;24(8):1599–1609. doi: 10.1016/j.cellsig.2012.04.005. [DOI] [PubMed] [Google Scholar]
- 18.Waite KA, Eng C. Protean PTEN: form and function. Am J Hum Genet. 2002;70(4):829–844. doi: 10.1086/340026. [DOI] [PMC free article] [PubMed] [Google Scholar]
- 19.Chu EC, Tarnawski AS. PTEN regulatory functions in tumor suppression and cell biology. Med Sci Monit. 2004;10(10):RA235–RA241. [PubMed] [Google Scholar]
- 20.Yuan TL, Cantley LC. PI3K pathway alterations in cancer: variations on a theme. Oncogene. 2008;27(41):5497–5510. doi: 10.1038/onc.2008.245. [DOI] [PMC free article] [PubMed] [Google Scholar]
- 21.Wu G, Xing M, Mambo E, et al. Somatic mutation and gain of copy number of PIK3CA in human breast cancer. Breast Cancer Res. 2005;7(5):R609–R616. doi: 10.1186/bcr1262. [DOI] [PMC free article] [PubMed] [Google Scholar]
- 22.López-Knowles E, O’Toole SA, McNeil CM, et al. PI3K pathway activation in breast cancer is associated with the basal-like phenotype and cancer-specific mortality. Int J Cancer. 2010;126(5):1121–1131. doi: 10.1002/ijc.24831. [DOI] [PubMed] [Google Scholar]
- 23.Saal LH, Holm K, Maurer M, et al. PIK3CA mutations correlate with hormone receptors, node metastasis, and ERBB2, and are mutually exclusive with PTEN loss in human breast carcinoma. Cancer Res. 2005;65(7):2554–2559. doi: 10.1158/0008-5472-CAN-04-3913. [DOI] [PubMed] [Google Scholar]
- 24.Maurer M, Su T, Saal LH, et al. 3-Phosphoinositide-dependent kinase 1 potentiates upstream lesions on the phosphatidylinositol 3-kinase pathway in breast carcinoma. Cancer Res. 2009;69(15):6299–6306. doi: 10.1158/0008-5472.CAN-09-0820. [DOI] [PMC free article] [PubMed] [Google Scholar]
- 25.Panigrahi AR, Pinder SE, Chan SY, Paish EC, Robertson JF, Ellis IO. The role of PTEN and its signalling pathways, including AKT, in breast cancer; an assessment of relationships with other prognostic factors and with outcome. J Pathol. 2004;204(1):93–100. doi: 10.1002/path.1611. [DOI] [PubMed] [Google Scholar]
- 26.Khan S, Kumagai T, Vora J, et al. PTEN promoter is methylated in a proportion of invasive breast cancers. Int J Cancer. 2004;112(3):407–410. doi: 10.1002/ijc.20447. [DOI] [PubMed] [Google Scholar]
- 27.García JM, Silva J, Peña C, et al. Promoter methylation of the PTEN gene is a common molecular change in breast cancer. Genes Chromosomes Cancer. 2004;41(2):117–124. doi: 10.1002/gcc.20062. [DOI] [PubMed] [Google Scholar]
- 28.Zhang P, Chen JH, Guo XL. New insights into PTEN regulation mechanisms and its potential function in targeted therapies. Biomed Pharmacother. 2012;66(7):485–490. doi: 10.1016/j.biopha.2012.04.004. [DOI] [PubMed] [Google Scholar]
- 29.Norbury C, Nurse P. Animal cell cycles and their control. Annu Rev Biochem. 1992;61:441–470. doi: 10.1146/annurev.bi.61.070192.002301. [DOI] [PubMed] [Google Scholar]
- 30.Powers JT, Hong S, Mayhew CN, Rogers PM, Knudsen ES, Johnson DG. E2F1 uses the ATM signaling pathway to induce p53 and Chk2 phosphorylation and apoptosis. Mol Cancer Res. 2004;2(4):203–214. [PubMed] [Google Scholar]
- 31.Krtolica A, Krucher NA, Ludlow JW. Hypoxia-induced pRB hypophosphorylation results from downregulation of CDK and upregulation of PP1 activities. Oncogene. 1998;17(18):2295–2304. doi: 10.1038/sj.onc.1202159. [DOI] [PubMed] [Google Scholar]
- 32.Boxem M, Srinivasan DG, van den Heuvel S. The Caenorhabditis elegans gene ncc-1 encodes a cdc2-related kinase required for M phase in meiotic and mitotic cell divisions, but not for S phase. Development. 1999;126(10):2227–2239. doi: 10.1242/dev.126.10.2227. [DOI] [PubMed] [Google Scholar]
- 33.van den Heuvel S. Cell-Cycle Regulation. Worm Book. Pasadena: The C. elegans Research Community; 2005. [Google Scholar]


