

Abstract
Genome-wide association studies in human type 2 diabetes (T2D) have renewed interest in the pancreatic islet as a contributor to T2D risk. Chronic low-grade inflammation resulting from obesity is a risk factor for T2D and a possible trigger of β-cell failure. In this study, microarray data were collected from mouse islets after overnight treatment with cytokines at concentrations consistent with the chronic low-grade inflammation in T2D. Genes with a cytokine-induced change of >2-fold were then examined for associations between single nucleotide polymorphisms and the acute insulin response to glucose (AIRg) using data from the Genetics Underlying Diabetes in Hispanics (GUARDIAN) Consortium. Significant evidence of association was found between AIRg and single nucleotide polymorphisms in Arap3 (5q31.3), F13a1 (6p25.3), Klhl6 (3q27.1), Nid1 (1q42.3), Pamr1 (11p13), Ripk2 (8q21.3), and Steap4 (7q21.12). To assess the potential relevance to islet function, mouse islets were exposed to conditions modeling low-grade inflammation, mitochondrial stress, endoplasmic reticulum (ER) stress, glucotoxicity, and lipotoxicity. RT-PCR revealed that one or more forms of stress significantly altered expression levels of all genes except Arap3. Thapsigargin-induced ER stress up-regulated both Pamr1 and Klhl6. Three genes confirmed microarray predictions of significant cytokine sensitivity: F13a1 was down-regulated 3.3-fold by cytokines, Ripk2 was up-regulated 1.5- to 3-fold by all stressors, and Steap4 was profoundly cytokine sensitive (167-fold up-regulation). Three genes were thus closely associated with low-grade inflammation in murine islets and also with a marker for islet function (AIRg) in a diabetes-prone human population. This islet-targeted genome-wide association scan identified several previously unrecognized candidate genes related to islet dysfunction during the development of T2D.
The failure of pancreatic islets to adequately compensate for increased insulin resistance plays a key role in the progression of type 2 diabetes (T2D) (1, 2), as indicated by the identification of islet-related genes in numerous genome-wide association studies (3). Factors thought to trigger islet dysfunction include glucotoxicity and lipotoxicity (4, 5), oxidative stress (6, 7), endoplasmic reticulum (ER) stress (6, 8), and inflammation (9, 10). Among these contributing factors, low-grade systemic inflammation precedes the development of hyperglycemia and is arguably the earliest potential trigger of islet decline in the progression of T2D. Of particular interest, increased serum levels of IL-6 and IL-1β produce an increased risk for development of T2D that is not observed with either cytokine alone in both humans (11) and mouse models of T2D (12).
We previously reported that circulating levels of these cytokines were sufficient to reduce glucose-stimulated insulin release and increase cell death in islets from diabetes-prone mice but not heterozygous controls (12). To begin to identify the genes responsible for this effect, we conducted a microarray study of islets isolated from prediabetic BKS.Cg-m+/+Leprdb/J (db/db) mice and heterozygous controls to compare their responses to exposure to circulating levels of IL-1β and IL-6 at concentrations that mimic low-grade inflammation. The most cytokine-sensitive genes from the mouse islet microarray study were evaluated for associations with the Genetics Underlying Diabetes in Hispanics (GUARDIAN) Consortium. GUARDIAN is a genome-wide association scan (GWAS) in Hispanic Americans, the largest US minority group and one at high risk of T2D (13). Participants in this study were monitored for glucose homeostasis measured by the frequently sampled intravenous glucose tolerance test (FSIVGTT) and the euglycemic clamp. Both FSIVGTTs and the euglycemic clamp methods yield underlying physiological, highly heritable parameters that are relevant to the risk of T2D (14, 15).
GWAS studies have repeatedly shown that polymorphisms related to β-cell function and/or development are closely associated with type 2 diabetes (16, 17; reviewed in Ref. 18). For this study, the acute insulin response to glucose (AIRg) test from the GUARDIAN Consortium was used as an indicator of islet function to evaluate genes from the rodent microarray (13). Specifically, GUARDIAN estimated the AIRg from the FSIVGTT using minimal model analysis (19) as the mean insulin increment in the plasma insulin concentration above the basal in the first 8 minutes after the administration of glucose. The GUARDIAN GWAS on AIRg was used to determine the support for association in humans of those genes/loci discovered from mouse islet microarray experiments that were (1) particularly sensitive to inflammatory stress and (2) specifically found in islets. Seven genes emerged as potentially important to β-cell function in the human and mouse forms of T2D. Each gene was examined further for expression changes in response to multiple islet cell stressors related to lipotoxicity, hyperglycemia, ER stress, oxidative stress, and low-grade inflammation in mouse islet models. We confirmed that 3 genes (F13a1, Ripk2, and Steap4) were cytokine sensitive in mouse islets and 2 others (Pamr1 and Klhl6) were induced by thapsigargin exposure, suggesting ER stress sensitivity. Our findings demonstrate the value of using targeted GWAS data to identify novel genes that are potentially important to the pathophysiology of β-cell decline in T2D.
Materials and Methods
Microarray data collection and analysis
Islets were isolated from prediabetic 4- or 5-week-old male db/db mice and nondiabetic male heterozygous controls as described previously (20). All animal procedures were approved by the University of Virginia (UVA) Institutional Animal Care and Use Committee. After overnight incubation to permit recovery from the isolation process, islets were exposed for 20 hours to 10 pg/mL IL-1β + 20 pg/mL IL-6 (low cytokines) or 100 pg/mL IL-1β + 200 pg/mL IL-6 (high cytokines) or left untreated for each strain. Islets were then collected for use in the microarray study. Two replicates for each condition were used, each consisting of 4 pooled biological samples. Because this study focuses on genes associated with low-grade inflammation, the high-dose cytokine data were not used to generate any gene lists for GUARDIAN analysis. The high-dose cytokine treatment, considered ∼10-fold greater than the circulating cytokine levels associated with low-grade inflammation, served as additional confirmation of cytokine effects on gene expression in the microarray. After the treatment, tissues were extracted for total RNA using a QIAGEN RNeasy kit. Microarray analysis of Affymetrix chips was performed by the UVA Biomolecular Research Facility essentially as described previously (21). In brief, biotin-labeled cRNA was prepared from 2 μg of total RNA, fragmented, and then hybridized to Affymetrix GeneChip Mouse Genome 430 2.0 oligonucleotide arrays. The arrays were scanned with an Affymetrix GeneChip Scanner 7G to generate raw intensity data.
Affymetrix .CEL files were processed using R/BioConductor packages for GCRMA-based quantification (gcrma version 2.34.0) with quantile normalization across all 12 samples. Quality control metrics including global principal components analysis and median distance heatmaps were generated with arrayQualityMetrics version 3.18.0, with no outliers detected. By principal components analysis, db/db islets treated with high concentrations of cytokines were mildly separated from the other samples, but little other clustering along experimental axes was observed. Note that GUARDIAN only used the data sets from the untreated and low-dose cytokine conditions to compose the list of genes for further analysis; the high-dose cytokine conditions were not considered to be representative of low-grade inflammation and were thus not relevant to the present study. Probesets with minimal detectable expression were filtered out by requiring at least 2 of the 12 samples to exhibit an Affymetrix MAS5 present/marginal/absent call of either “present” or “marginal,” leaving 27 751 probesets of 45 101 for further analysis (22). Statistics for this reduced set of expressed probesets were calculated by a moderated ANOVA across all 6 experimental groups, using the package limma (version 3.18.13), with intensity-trended, empirical Bayesian shrunken variance estimates; probesets exhibiting minimum absolute log2 fold changes of >1.0 (ie, 2× fold changes) between the low-dose cytokine and control db/wt heterozygous islets, achieving statistical significance of 5% or better false discovery rate, were selected for further analysis, yielding 145 probesets from 128 named mouse genes (23, 24). All microarray data were deposited in Gene Expression Omnibus (GEO) under accession number GSE62868 and are available at http://www.ncbi.nlm.nih.gov/geo/query/acc.cgi?acc=GSE62868.
GUARDIAN
The GUARDIAN Consortium included 7 cohorts of individuals without T2D who self-reported Mexican ancestry. Approval was made by review boards for all contributing institutions, and informed consent was obtained from all participants. Inclusion criteria have been described previously (15). Full details of this study can be found in Ref. 13. Four studies (Insulin Resistance Atherosclerosis Study [IRAS], n = 187; IRAS Family Study, n = 1034; BetaGene, n = 1202; and TRIPOD, n = 125) used FSIVGTTs to determine, among other endpoints, the AIRg. AIRg was used as a measure of islet function to identify single nucleotide polymorphisms (SNPs) of interest. Variance component models as implemented in sequential oligogenic linkage analysis routines (25) were used to test association in family cohorts. All models included age, sex, study site (in multicenter recruitment studies), and admixture proportions. The primary inference was the additive genetic model. A nonparametric meta-analysis was computed to combine the evidence of association across cohorts. Additional details can be found elsewhere (15). GUARDIAN GWAS results were used to examine a specific set of 128 genes in mouse islets that were identified as highly sensitive to the low-dose cytokine condition. Of the 128 genes, 14 were not expressed in humans. The remaining 114 genes were examined for variants with nominal P values of <.05; SNPs within the gene or within several hundred kilobases were tagged; SNPs with P < .001 were considered significant with respect to AIRg. A total of 7 genes were identified.
Intracellular calcium ([Ca2+]i) measurements
[Ca2+]i was measured using the ratiometric [Ca2+]i indicator fura-2 AM using methods described in detail previously (26, 27).
Cell death
Islets were treated with 20 μg/mL of propidium iodide (PI) and incubated for 15 minutes. Islets were imaged once under brightfield illumination to determine the islet borders and imaged again to measure PI fluorescence using 535 nm excitation and 617 nm emission. Islets were circled, and the mean PI fluorescence intensity was determined for each islet individually (28).
Confirmation of gene expression under various stress conditions by RT-PCR
To confirm candidate genes in normal islet tissue, islets were isolated as described above from adult male (8–12 weeks) outbred CD-1 mice (Charles River Laboratories). CD-1 mice were chosen because we have extensively characterized the islets from these mice for in vitro effects of cytokine exposure on islet function (27, 29, 30). In addition, these mice are outbred, so they do not harbor the potential strain-specific issues of inbred strains. Islets were incubated overnight in RPMI 1640 medium (Invitrogen) supplemented with 10% fetal bovine serum and 1% penicillin/streptomycin to allow recovery from collagenase digestion before further treatment. Islets were then treated with low physiological doses of several different agents for 48 hours designed to induce different forms of cellular stress. Various islet stressors were prepared as follows. Rotenone and thapsigargin were purchased from Sigma-Aldrich and prepared in stocks of dimethylsulfoxide to final concentrations of <0.1%. Glucose-free RPMI 1640 medium (10% fetal bovine serum and 1% penicillin/streptomycin) was supplemented with 1 M glucose stock to produce the 28G condition. Stocks of the murine forms of IL-1β and IL-6 (purchased from R&D Systems, Inc) were prepared in PBS with 0.1% bovine serum albumin. Palmitate, oleate, and linoleate were purchased from Sigma-Aldrich and were prepared in 100 mM stock concentrations in methanol and stored at −80°C. To treat the islets, the required amount of each fatty acid was taken in a glass tube and dried under a stream of nitrogen to remove methanol. The dried mixture of fatty acids was then resuspended in the RPMI 1640 medium with 0.1% bovine serum albumin followed by vortexing and sonication. Islets were exposed to final concentrations of each stressor for 48 hours as described in the Results and Discussion. This experiment was repeated a total of 4 times on separate occasions. For each repetition, islets were isolated from several mice (typically 3 or 4, depending on islet yield) to generate enough islet material for gene expression studies. Islets from each mouse were distributed in equal numbers among the 6 treatment conditions.
After treatment of islets with the various stressors, total RNA was isolated with an RNeasy mini kit (QIAGEN). RNA purity and concentration were determined using a Nanodrop spectrophotometer (Thermo Scientific), and it was reverse transcribed into cDNA using a QuantiTect Reverse Transcription Kit (QIAGEN) according to the manufacturer's protocol. The expression levels of 7 novel genes were measured by TaqMan gene expression assays (Life Technologies). The relative gene expression was calculated using the 2−ΔΔCT method (31) and normalized to expression of β-actin.
Statistical analysis for gene expression
A two-tailed t test assuming unequal variance was used for all studies of gene expression by RT-PCR in Figures 4 to 8. A P value of <.05 was used to indicate a significant difference compared with the untreated control condition.
Figure 4.

Gene expression levels for F13a1 in mouse islets after a 48-hour treatment with various stressors as described in detail in the Results and Discussion. This and all subsequent figures use n = 4 replicates for each condition to determine statistical significance. *, P < .05. Cytos, cytokines (10 pg/mL IL-1β + 20 pg/mL IL-6); 28G, 28 mM glucose; FFA, free fatty acids (50 μM palmitate + 100 μM oleate + 50 μM linoleate); Thaps, 100 nM thapsigargin; Rote, 20 nM rotenone.
Figure 8.

Gene expression levels for Steap4 in mouse islets after a 48-hour treatment with various stressors as described in detail in Results and Discussion. *, P < .05; **P < .01. Cytos, cytokines (10 pg/mL IL-1β + 20 pg/mL IL-6); 28G, 28 mM glucose; FFA, free fatty acids (50 μM palmitate + 100 μM oleate + 50 μM linoleate); Thaps, 100 nM thapsigargin; Rote, 20 nM rotenone.
Results and Discussion
Combining islet microarray data with GWAS data
We used human GWAS data from GUARDIAN and the results of microarray data from mouse islets to identify genes common to each study. mRNA for the microarray study was collected from mouse islets exposed to proinflammatory cytokines overnight at concentrations consistent with low-grade systemic inflammation (10 pg/mL IL-1β + 20 pg/mL IL-6) and also a 10-fold higher dose. The effects of these cytokines on islet function are shown in Figure 1. Acute glucose-stimulated [Ca2+]i responses for each cytokine dose paired with untreated controls are shown for islets isolated from db/db mice in Figure 1A and for islets from heterozygous control mice in Figure 1B. Cytokine treatment increased the basal [Ca2+]i levels before glucose stimulation (Figure 1C) and reduced the first-phase (peak) response to glucose stimulation (phase 1, Figure 1D) in both strains in a dose-dependent manner. Note that cytokine effects on [Ca2+]i handling are much more pronounced among islets from the db/db mouse than among islets from heterozygous controls, as described previously (12). We also showed that low-grade inflammation significantly diminished glucose-stimulated insulin secretion in islets from db/db mice but not heterozygous controls (12). In the microarray study, substantial differences were found between islets from db/db mice and heterozygous controls in terms of the number of cytokine-sensitive genes at both low-dose and high-dose cytokine treatments (Supplemental Table 1).
Figure 1.

Effects of cytokine (cyto) treatment on islet function. A and B, Islets isolated from db/db mice (A) and heterozygous (het) control mice (B) were exposed overnight to 10 pg/mL IL-1β + 20 pg/mL IL-6, 10× that dose, or left untreated. After 3 minutes in 3 mM glucose, islets were stimulated with 11 mM glucose and observed for changes in [Ca2+]i using the ratiometric dye fura-2 AM. C and D, Mean values for basal (C) and phase 1 (D, peak) response to glucose stimulation. #, P < .10; *, P < .05; **, P < .01; ***, P < .001; N.S., not significant.
As described in Figure 2A, microarray data were used to identify 128 genes from heterozygous control islets plus 10 nonoverlapping genes from db/db mouse islets that showed a >2-fold increase or decrease in expression in response to the low-grade inflammatory stimulus. Among the 138 mouse genes in total, 14 were not found in humans, but the remaining 124 genes expressed in humans were used to query the GUARDIAN GWAS database as described in Figure 2B. A total of 7 genes were common to the microarray and GWAS studies as potentially indicative of an islet phenotype as shown in Table 1. A full list of all genes with a >2-fold increase or decrease in expression in response to low-dose cytokine treatment can be found in Supplemental Tables 2 to 4. Note that the supplemental tables contain some genes listed multiple times because of multiple probesets and some unidentified hypothetical genes and that we did not include a list of genes that changed in response to high-dose cytokine treatment, but these data were deposited in GEO (accession number GSE62868).
Figure 2.

Schematic diagram of the experimental design related to the microarray study of islets (A) and analysis of GUARDIAN data to identify genes related to β-cell function (B). LogFC, log fold change.
Table 1.
Information on 7 genes of interest from GUARDIAN and microarray trials
| GUARDIAN |
Microarray of Mouse Islets |
|||||||
|---|---|---|---|---|---|---|---|---|
| Gene Symbol | Hum (chr) | SNP | AIRg | Probe ID | Expr Δ | LogFC | AveExpr | Adjusted P Value |
| Arap3 | 5q31.3 | rs11957762 | 6.82E–04 | 1419833_s_at | Down | 1.787 | 3.234 | 7.99E–02 |
| F13a1 | 6p25.3 | rs1905210 | 3.10E–04 | 1448929_at | Down | 1.766 | 2.895 | 1.31E–06 |
| Klhl6 | 3q27.1 | rs1191952 | 9.24E–04 | 1437886_at | Down | 2.413 | 3.513 | 4.79E–02 |
| Nid1 | 1q42.3 | rs17616115 | 9.26E–04 | 1448469_at | Down | 2.298 | 4.050 | 6.19E–02 |
| Pamr1 | 11p13 | rs694961 | 8.85E–04 | 1433529_at | Up | 1.071 | 9.042 | 8.96E–02 |
| Ripk2 | 8q21.3 | rs12679456 | 6.97E–04 | 1450173_at | Up | 2.919 | 6.713 | 7.49E–02 |
| Steap4 | 7q21.12 | rs2538898 | 6.60E–04 | 1460197_a_at | Up | 5.800 | 10.267 | 5.54E–03 |
Abbreviations: Hum (chr), human chromosome location; Probe ID, probe identification number for Affymetrix GeneChip Mouse Genome 430 2.0; expr Δ, direction of the change in gene expression; logFC, log of fold change.
Confirmation of genes by RT-PCR in response to islet stressors
We examined various stressors hypothesized to trigger β-cell failure in T2D for their effects on gene expression and islet function. Using [Ca2+]i as a readout, we first tested each stressor for effects on the first phase (peak) [Ca2+]i response to glucose stimulation in islets. The attenuation or loss of first-phase insulin secretion is a well established marker for early signs of β-cell decline in type 1 diabetes (32) and type 2 diabetes (33, 34). Islets were exposed for 48 hours to one of the following stressors: 20 nM rotenone as a model of oxidative stress, 100 nM thapsigargin as a model of ER stress, 10 pg/mL IL-1β + 20 pg/mL IL-6 as a model of low-grade inflammation, 28 mM glucose as a model of hyperglycemia, or 50 μM palmitate + 100 μM oleate + 50 μM linoleate as a model of lipotoxicity. Islets incubated in standard RPMI 1640 medium were used as controls. As shown in Figure 3A, each stressor significantly attenuated the phase 1 response to glucose stimulation to a degree similar to that of the others, but none of the stressors increased cell death at these low concentrations (Figure 3B). For some stressors, several different concentrations were tested to identify an appropriate dose that attenuated phase 1 glucose responses without causing significant increases in cell death. An example is shown for free fatty acids in Supplemental Figure 1. Additional effects of these stressors on islet function were described previously (30).
Figure 3.
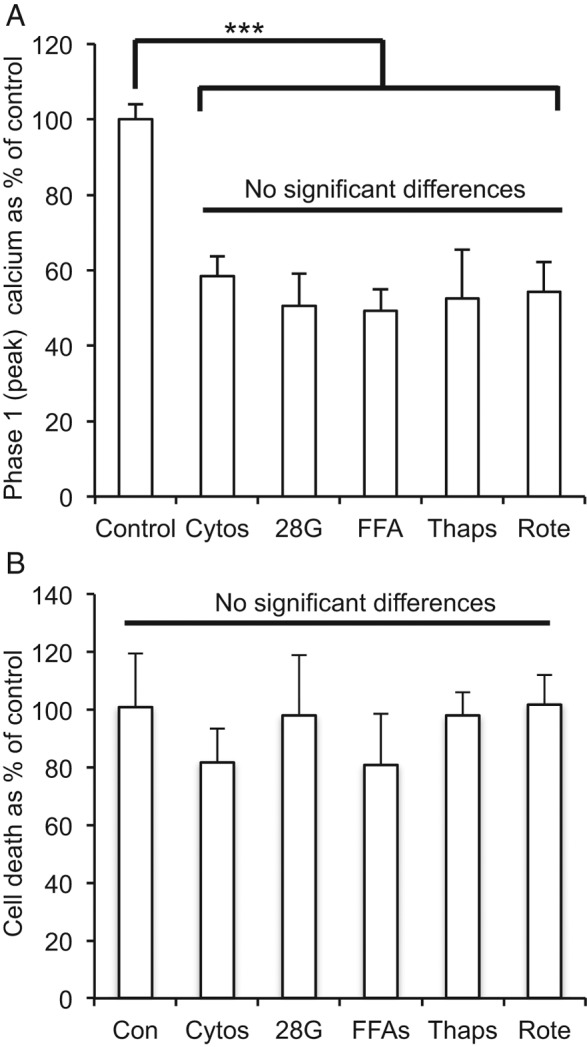
Stressor effects on islet viability and function. A, Islets exposed to various stressors for 48 hours produced similar effects on phase 1 [Ca2+]i responses to 3 to 11 mM glucose stimulation. All stressors reduced [Ca2+]i responses (***, P < .001) compared with untreated control islets, but none of the stressor effects significantly differed from one another. (Adapted from Qureshi et al [30] with permission of Elsevier, © 2015). B, None of the stressors altered cell death rates compared with those of untreated control islets in duplicate trials measuring PI fluorescence assessing 18 to 37 islets/condition. Cytos, cytokines (10 pg/mL IL-1β + 20 pg/mL IL-6); 28G, 28 mM glucose; FFA, free fatty acids (50 μM palmitate + 100 μM oleate + 50 μM linoleate); Thaps, 100 nM thapsigargin; Rote, 20 nM rotenone.
For each of the following genes, expression levels are shown as fold changes over the control condition and values are normalized to actin expression. The mean CT values for the genes of interest in untreated control islets were 35.0 for Arap3, 35.6 for F13a1, 32.1 for Klhl6, 32.0 for Nid1, 31.6 for Pamr1, 31.1 for Ripk2, and 37.0 for Steap4. As an additional validation, we examined CXCL1, one of the most highly up-regulated genes in the entire microarray, especially among islets from db/db mice (Supplemental Table 4). As reported previously, CXCL1 was strongly up-regulated by cytokine treatment (∼50-fold) in islets isolated from outbred CD-1 mice (35). All gene expression studies used n = 4 replicate mRNA samples collected on separate occasions, each of which consisted of islets pooled from several mice and distributed in equal numbers from each mouse for each condition.
In contrast to the microarray data, we found that Nid1 and Arap3 showed little expression change in response to stress. Nid1 (nidogen 1), also known as enactin, encodes a protein involved in basement membrane architecture that is essential in basement membrane formation in wound healing (36). In islets, nidogen is a component of the islet capsule that acts as a physical boundary to inflammatory agents (37, 38) and is important for preventing islet allograft rejection (39). None of the stressors caused significant changes in Nid1 expression although Nid1 showed borderline up-regulation by free fatty acids (2.0-fold increase, P = .053). Arap3 encodes a phosphoinositide-binding protein with ARF-GAP– and RHO-Gap–associating domains (40). Arap3 mediates phosphoinositide 3-kinase activity (40), a well-established component of the glucose-stimulated insulin secretion pathway (41, 42). In RT-PCR studies, a 48-hour exposure to 28 mM glucose induced a small increase in islet Arap3 expression (1.5-fold increase, P < .05), but no other significant effects were observed. Thus, we could not confirm a relationship between these 2 candidate genes and the various stress mechanisms using the models in for this study.
F13a1: a stress-inhibited coagulation factor
F13a1 (coagulation factor XIII, A1 polypeptide) encodes a coagulation factor XIII subunit that is activated in the blood-clotting cascade and stabilizes fibrin clots (43). Whereas F13a has been a long-established cause of the blood clotting disorder factor XIII deficiency, it has recently been associated with obesity (44) and the metabolic/fertility disorder polycystic ovarian syndrome (45). F13a is a tetrameric zymogen that is converted by thrombin into transglutaminase (43), a calcium-regulated protein that might play a role in glucose-stimulated insulin secretion (46). It is hypothesized that transglutaminase is only active during β-cell stimulation when [Ca2+]i levels are high (46). Of interest, among all 7 gene hits, F13a1 had the strongest association with AIRg, a measure of islet function, in the GUARDIAN analysis. Our microarray data suggested that inflammation strongly inhibits the expression of F13a1. Follow-up RT-PCR confirms this. As shown in Figure 4, cytokines at circulating levels in T2D produced the only significant effect on F13a1 expression, cutting expression levels to <30% of untreated control islets. Both rotenone (P = .063) and thapsigargin (P = .105) also appeared to down-regulate F13a1, although the changes did not reach statistical significance. Exposure to high glucose, in contrast, consistently up-regulated F13a1 expression to varying degrees (1.2, 3.2-, 3.8-, and 6.9-fold; P = .098).
Klhl6: an ER stress-sensitive kelch-like protein involved with immune response
Kelch-like protein 6 (Klhl6) is a member of the kelch-like family of ∼42 proteins that generally contain a BTB/POZ domain, a BACK domain of unknown function, and 5 to 6 kelch motifs for which the proteins are named (47). Klhl6 encodes a protein involved in the antigen receptor signaling of B lymphocytes (48, 49) that appears to play a role in some types of lymphocytic leukemia (50). Recently, it has been shown that increased B lymphocyte content and proinflammatory mediators correlated with dysfunction in islets from type 2 diabetic donors, suggesting that an adaptive immune response may contribute to islet dysfunction in T2D (51). Because islets consist of multiple cell types, resident B lymphocytes within islets could be responsible for our observed changes in Klhl6 expression in both the microarray and follow-up RT-PCR studies. To date, there are no published reports of Klhl6 expression in islets, although the Human Protein Atlas lists Klhl6 as a moderately stained protein in islets by immunohistochemistry. As shown in Figure 5, proinflammatory cytokine exposure did not appear to affect islet Klhl6 expression, whereas thapsigargin-induced ER stress caused an approximately 4-fold increase (P < .001).
Figure 5.

Gene expression levels for Klhl6 in mouse islets after a 48-hour treatment with various stressors as described in detail in Results and Discussion. **, P < .01. Cytos, cytokines (10 pg/mL IL-1β + 20 pg/mL IL-6); 28G, 28 mM glucose; FFA, free fatty acids (50 μM palmitate + 100 μM oleate + 50 μM linoleate); Thaps, 100 nM thapsigargin; Rote, 20 nM rotenone.
Pamr1: an ER-stress-induced protein involved in muscle regeneration
Peptidase domain-containing protein associated with muscle regeneration 1 (Pamr1; also known as RAMP) plays a central role in the regeneration of skeletal muscle, and its mRNA expression is induced to regenerate muscle fiber after skeletal muscle injury (52). Up-regulation of Pamr1 has also been associated with coronary artery disease in epicardial and subcutaneous adipose tissue (53). Thus, one could hypothesize that inflammatory stressors such as cytokines might lead to increased Pamr1 expression as part of a response to skeletal muscle injury or cardiac stress. Although our microarray data indicated that cytokines might up-regulate Pamr1, we observed no increase in Pamr1 expression in islets by RT-PCR in response to cytokine exposure, as shown in Figure 6. We did, however, observe significant thapsigargin-induced Pamr1 expression (P < .05), as well as possible induction by free fatty acid exposure (P = .059), suggesting that Pamr1 is a stress-induced gene in islets.
Figure 6.

Gene expression levels for Pamr1 in mouse islets after a 48-hour treatment with various stressors as described in detail in Results and Discussion. *, P < .05. Cytos, cytokines (10 pg/mL IL-1β + 20 pg/mL IL-6); 28G, 28 mM glucose; FFA, free fatty acids (50 μM palmitate + 100 μM oleate + 50 μM linoleate); Thaps, 100 nM thapsigargin; Rote, 20 nM rotenone.
Ripk2: a broadly stress-sensitive kinase
Receptor-interacting protein kinase 2 (Ripk2) belongs to a family of kinases that have been heavily implicated in regulating both necrotic and apoptotic pathways (54, 55). Cytokine-induced nuclear factor-κB activation up-regulates Ripk2 (56), and Ripk2 also activates the nuclear factor-κB pathway (57), thus implicating Ripk2 in proinflammatory signaling. Of interest, Ripk2 may play a key role in modulating β-cell apoptotic pathways as shown by meta-analysis of cytokine-induced β-cell apoptosis in type 1 diabetes (58). Specifically, small interfering RNA knockdown of Ripk2 expression increased cytokine-induced apoptosis in β-cells, suggesting a protective role (58). In our studies, the various stressors broadly activated Ripk2, as shown in Figure 7. Although the fold changes were small (∼1.5- to 3-fold), oxidative stress, ER stress, low-grade inflammation, high glucose, and free fatty acids all significantly up-regulated Ripk2 expression. These data suggest that Ripk2 may be a more generalized cellular stress responder in islets than previously thought.
Figure 7.

Gene expression levels for Ripk2 in mouse islets after a 48-hour treatment with various stressors as described in detail in Results and Discussion. *, P < .05; ***, P < .001. Cytos, cytokines (10 pg/mL IL-1β + 20 pg/mL IL-6); 28G, 28 mM glucose; FFA, free fatty acids (50 μM palmitate + 100 μM oleate + 50 μM linoleate); Thaps, 100 nM thapsigargin; Rote, 20 nM rotenone.
Steap4: a highly cytokine-sensitive metalloreductase
Six transmembrane epithelial antigen of prostate 4 (Steap4, also known as Stamp2 or Tiarp) is a metalloreductase that reduces iron from Fe3+ to Fe2+ and copper from Cu2+ to Cu1+ to facilitate cellular import of these metals (59). Steap4 was first identified in adipose tissue as a result of its high sensitivity to proinflammatory cytokines and was originally named TNF-α–induced adipose-related-protein (Tiarp), (60). Subsequent studies have shown that Steap4 expression is strongly induced by a variety of cytokines in adipocytes including IL-1β, IL-6, and TNF-α (61) and in hepatocytes by IL-17 and TNF-α (62). Moreover, in combination, these cytokines have synergistic effects in the up-regulation of Steap4 (61, 62). Consistent with these synergistic cytokine effects in other tissues, as shown in Figure 8, the combination of low concentrations of IL-1β + IL-6 induced a 167-fold increase in Steap4 expression. Treatment with free fatty acids also significantly up-regulated Steap4 but to a much lesser degree (Figure 8). With regard to diabetes, STEAP4−/− mice develop various signs of metabolic disease including insulin resistance, glucose intolerance, hyperglycemia, and hyperinsulinemia, and the adipose tissue of STEAP4−/− mice shows indications of increased inflammation (63). Steap4 thus appears to be a gene that is highly responsive to low-grade inflammation associated with T2D.
Interpreting gene expression studies in islets
Normal pancreatic islets are a heterogeneous collection of hormone-secreting cells including primarily insulin-producing β-cells, with minor representation of glucagon-producing α-cells and somatostatin-producing δ-cells. In addition, islets include resident immune cells, vascular cells, and pancreatic ductal cells. Although insulin-producing β-cells comprise 50% to 80% of the total islet mass in rodents, human islets tend to have a much higher fraction of α-cells and a lower fraction of β-cells as well as a different architectural organization (64, 65). Any of these other islet cell types could contribute to changes in gene expression. For example, Steap4 is highly expressed in macrophages and Klhl6 is expressed primarily in B lymphocytes; both of these cell types have been found in isolated islets (51, 66). Thus, for any of these 7 genes, we cannot rule out non–β-cell contributions to some of the observed changes in gene expression. Although this could be considered a drawback, one advantage of using islets in favor of dispersed β-cells or cell lines is that islets retain the glucose and nutrient sensitivity observed in vivo to a much greater degree than dispersed cells (67–70). In addition, we have demonstrated that these 7 genes not only are expressed in islets and are responsive to various cellular stresses but are also associated with an impact on AIRg measurements in GUARDIAN. Genetic mutations in any of these genes could thus affect insulin secretion in response to glucose stimulation, which would be of direct importance to furthering our understanding of the causes of T2D.
In conclusion, GWAS studies focusing on the causes of T2D have implicated islet dysfunction as a major contributing factor (18, 71). By examining isolated islets for stress responses and cross-referencing gene hits with genes associated with glucose-stimulated insulin release in human populations with T2D, we identified 7 genes that may play a role in promoting or preventing islet decline in T2D. By further examining stress-induced expression changes in each of these genes, we identified 5 genes that stood out: F13a1 as a novel stress-inhibited gene in islets, Klhl6 and Pamr1 as induced genes specific to ER stress, Ripk2 as a broadly stress-induced gene, and Steap4 as an exceptionally cytokine-sensitive gene. These genes provide promising leads in elucidating islet stress responses and islet dysfunction during the development of T2D.
Acknowledgments
We thank Kathryn Corbin and the UVA Cell and Islet Isolation Core facility for procuring mouse islets, the DNA Sciences Core at the UVA Biomolecular Research Facility for assistance with the microarray studies, and the UVA Bioinformatics Core for helping to deposit the microarray data in GEO. We give special thanks to the researchers and participants in the GUARDIAN Consortium who made this study possible.
This research was supported by the National Institute of Diabetes and Digestive and Kidney Diseases (K01DK081621 and R01DK089182 [to C.S.N.] and DK085175 [GUARDIAN Consortium]), the National Heart and Lung Institute (Grants HL047887, HL047889, HL047890, and HL47902 [IRAS] and Grants HL060944, HL061019, and HL060919 [IRAS Family Study]), the National Institute of Diabetes and Digestive and Kidney Diseases (DK061628 [BetaGene]), and the American Diabetes Association Distinguished Clinical Scientist Award (BetaGene).
Disclosure Summary: The authors have nothing to disclose.
Footnotes
- AIRg
- acute insulin response to glucose
- [Ca2+]i
- intracellular calcium
- ER
- endoplasmic reticulum
- FSIVGTT
- frequently sampled intravenous glucose tolerance test
- GEO
- Gene Expression Omnibus
- GUARDIAN
- Genetics Underlying Diabetes in Hispanics
- GWAS
- genome-wide association scan
- PI
- propidium iodide
- SNP
- single nucleotide polymorphism
- T2D
- type 2 diabetes
- UVA
- University of Virginia.
References
- 1. Weir GC, Bonner-Weir S. Five stages of evolving β-cell dysfunction during progression to diabetes. Diabetes 2004;53(suppl 3):S16–S21. [DOI] [PubMed] [Google Scholar]
- 2. Leahy JL, Hirsch IB, Peterson KA, Schneider D. Targeting β-cell function early in the course of therapy for type 2 diabetes mellitus. J Clin Endocrinol Metab. 2010;95:4206–4216. [DOI] [PubMed] [Google Scholar]
- 3. Diabetes Genetics Initiative of Broad Institute of Harvard and MIT, Lund University, Novartis Institutes of BioMedical Research, et al. Genome-wide association analysis identifies loci for type 2 diabetes and triglyceride levels. Science. 2007;316:1331–1336. [DOI] [PubMed] [Google Scholar]
- 4. Roduit R, Morin J, Masse F, et al. Glucose down-regulates the expression of the peroxisome proliferator-activated receptor-α gene in the pancreatic β-cell. J Biol Chem. 2000;275:35799–35806. [DOI] [PubMed] [Google Scholar]
- 5. Robertson RP, Harmon J, Tran PO, Poitout V. β-cell glucose toxicity, lipotoxicity, and chronic oxidative stress in type 2 diabetes. Diabetes. 2004;53(suppl 1):S119–S124. [DOI] [PubMed] [Google Scholar]
- 6. Ihara Y, Toyokuni S, Uchida K, et al. Hyperglycemia causes oxidative stress in pancreatic β-cells of GK rats, a model of type 2 diabetes. Diabetes. 1999;48:927–932. [DOI] [PubMed] [Google Scholar]
- 7. Karunakaran U, Park KG. A systematic review of oxidative stress and safety of antioxidants in diabetes: focus on islets and their defense. Diabetes Metab J. 2013;37:106–112. [DOI] [PMC free article] [PubMed] [Google Scholar]
- 8. Eizirik DL, Cardozo AK, Cnop M. The role for endoplasmic reticulum stress in diabetes mellitus. Endocr Rev. 2008;29:42–61. [DOI] [PubMed] [Google Scholar]
- 9. Vozarova B, Weyer C, Lindsay RS, Pratley RE, Bogardus C, Tataranni PA. High white blood cell count is associated with a worsening of insulin sensitivity and predicts the development of type 2 diabetes. Diabetes. 2002;51:455–461. [DOI] [PubMed] [Google Scholar]
- 10. Donath MY, Schumann DM, Faulenbach M, et al. Islet inflammation in type 2 diabetes: from metabolic stress to therapy. Diabetes Care. 2008;31(suppl 2):S161–164. [DOI] [PubMed] [Google Scholar]
- 11. Spranger J, Kroke A, Möhlig M, et al. Inflammatory cytokines and the risk to develop type 2 diabetes: results of the prospective population-based European Prospective Investigation into Cancer and Nutrition (EPIC)-Potsdam Study. Diabetes. 2003;52:812–817. [DOI] [PubMed] [Google Scholar]
- 12. O'Neill CM, Lu C, Corbin KL, et al. Circulating levels of IL-1B+IL-6 cause ER stress and dysfunction in islets from prediabetic male mice. Endocrinology. 2013;154:3077–3088. [DOI] [PMC free article] [PubMed] [Google Scholar]
- 13. Palmer ND, Goodarzi MO, Langefeld CD, et al. 2014. Genetic variants associated with quantitative glucose homeostasis traits translate to type 2 diabetes in Mexican Americans: the GUARDIAN (Genetics Underlying Diabetes in Hispanics) Consortium. Diabetes. 2015;64:1853–1866. [DOI] [PMC free article] [PubMed] [Google Scholar]
- 14. Bergman RN, Zaccaro DJ, Watanabe RM, et al. Minimal model-based insulin sensitivity has greater heritability and a different genetic basis than homeostasis model assessment or fasting insulin. Diabetes. 2003;52:2168–2174. [DOI] [PubMed] [Google Scholar]
- 15. Goodarzi MO, Langefeld CD, Xiang AH, et al. Insulin sensitivity and insulin clearance are heritable and have strong genetic correlation in Mexican Americans. Obesity (Silver Spring). 2014;22:1157–1164. [DOI] [PMC free article] [PubMed] [Google Scholar]
- 16. Grant SF, Thorleifsson G, Reynisdottir I, et al. Variant of transcription factor 7-like 2 (TCF7L2) gene confers risk of type 2 diabetes. Nat Genet. 2006;38:320–323. [DOI] [PubMed] [Google Scholar]
- 17. Deussing JM, Kühne C, Putz B, et al. Expression profiling identifies the CRH/CRH-R1 system as a modulator of neurovascular gene activity. J Cereb Blood Flow Metab. 2007;27:1476–1495. [DOI] [PubMed] [Google Scholar]
- 18. Hakonarson H, Grant SF. Genome-wide association studies (GWAS): impact on elucidating the aetiology of diabetes. Diabetes Metab Res Rev. 2011;27:685–696. [DOI] [PubMed] [Google Scholar]
- 19. Pacini G, Bergman RN. MINMOD: a computer program to calculate insulin sensitivity and pancreatic responsivity from the frequently sampled intravenous glucose tolerance test. Comput Methods Programs Biomed. 1986;23:113–122. [DOI] [PubMed] [Google Scholar]
- 20. Carter JD, Dula SB, Corbin KL, Wu R, Nunemaker CS. A practical guide to rodent islet isolation and assessment. Biol Proced Online. 2009;11:3–31. [DOI] [PMC free article] [PubMed] [Google Scholar]
- 21. Gallagher PG, Bao Y, Serrano SM, Kamiguti AS, Theakston RD, Fox JW. Use of microarrays for investigating the subtoxic effects of snake venoms: insights into venom-induced apoptosis in human umbilical vein endothelial cells. Toxicon. 2003;41:429–440. [DOI] [PubMed] [Google Scholar]
- 22. Liu WM, Mei R, Di X, et al. Analysis of high density expression microarrays with signed-rank call algorithms. Bioinformatics. 2002;18:1593–1599. [DOI] [PubMed] [Google Scholar]
- 23. McCarthy DJ, Smyth GK. Testing significance relative to a fold-change threshold is a TREAT. Bioinformatics. 2009;25:765–771. [DOI] [PMC free article] [PubMed] [Google Scholar]
- 24. Smyth G. Limma: linear models for microarray data. In: Gentleman R, Carey V, Dudoit S, Irizarry R, Huber W, eds. Bioinformatics and Computational Biology Solutions using R and Bioconductor. New York, NY: Springer; 2005:397–420. [Google Scholar]
- 25. Almasy L, Blangero J. Multipoint quantitative-trait linkage analysis in general pedigrees. Am J Hum Genet. 1998;62:1198–1211. [DOI] [PMC free article] [PubMed] [Google Scholar]
- 26. Jahanshahi P, Wu R, Carter JD, Nunemaker CS. Evidence of diminished glucose stimulation and endoplasmic reticulum function in nonoscillatory pancreatic islets. Endocrinology. 2009;150:607–615. [DOI] [PMC free article] [PubMed] [Google Scholar]
- 27. Corbin KL, Hall TE, Haile R, Nunemaker CS. A novel fluorescence imaging approach for comparative measurements of pancreatic islet function in vitro. Islets. 2011;3:14–20. [DOI] [PMC free article] [PubMed] [Google Scholar]
- 28. Ma K, Nunemaker CS, Wu R, Chakrabarti SK, Taylor-Fishwick DA, Nadler JL. 12-Lipoxygenase Products Reduce Insulin Secretion and β-cell viability in human islets. J Clin Endocrinol Metab. 2010;95:887–893. [DOI] [PMC free article] [PubMed] [Google Scholar]
- 29. Dula SB, Jecmenica M, Wu R, et al. Evidence that low-grade systemic inflammation can induce islet dysfunction as measured by impaired calcium handling. Cell Calcium. 2010;48:133–142. [DOI] [PMC free article] [PubMed] [Google Scholar]
- 30. Qureshi FM, Dejene EA, Corbin KL, Nunemaker CS. Stress-induced dissociations between intracellular calcium signaling and insulin secretion in pancreatic islets. Cell Calcium. 2015;57:366–375. [DOI] [PMC free article] [PubMed] [Google Scholar]
- 31. Schmittgen TD, Livak KJ. Analyzing real-time PCR data by the comparative CT method. Nat Protoc. 2008;3:1101–1108. [DOI] [PubMed] [Google Scholar]
- 32. Sosenko JM, Skyler JS, Beam CA, et al. Acceleration of the loss of the first-phase insulin response during the progression to type 1 diabetes in diabetes prevention trial-type 1 participants. Diabetes. 2013;62:4179–4183. [DOI] [PMC free article] [PubMed] [Google Scholar]
- 33. Del Prato S, Tiengo A. The importance of first-phase insulin secretion: implications for the therapy of type 2 diabetes mellitus. Diabetes Metab Res Rev. 2001;17:164–174. [DOI] [PubMed] [Google Scholar]
- 34. Cheng K, Andrikopoulos S, Gunton JE. First phase insulin secretion and type 2 diabetes. Curr Mol Med. 2013;13:126–139. [PubMed] [Google Scholar]
- 35. Nunemaker CS, Chung HG, Verrilli GM, et al. Increased serum CXCL1 and CXCL5 are linked to obesity, hyperglycemia, and impaired islet function. J Endocrinol. 2014;222:267–276. [DOI] [PMC free article] [PubMed] [Google Scholar]
- 36. Fässler R, Sasaki T, Timpl R, Chu ML, Werner S. Differential regulation of fibulin, tenascin-C, and nidogen expression during wound healing of normal and glucocorticoid-treated mice. Exp Cell Res. 1996;222:111–116. [DOI] [PubMed] [Google Scholar]
- 37. Jiang FX, Naselli G, Harrison LC. Distinct distribution of laminin and its integrin receptors in the pancreas. J Histochem Cytochem. 2002;50:1625–1632. [DOI] [PubMed] [Google Scholar]
- 38. Irving-Rodgers HF, Ziolkowski AF, Parish CR, et al. Molecular composition of the peri-islet basement membrane in NOD mice: a barrier against destructive insulitis. Diabetologia. 2008;51:1680–1688. [DOI] [PMC free article] [PubMed] [Google Scholar]
- 39. Irving-Rodgers HF, Choong FJ, Hummitzsch K, Parish CR, Rodgers RJ, Simeonovic CJ. Pancreatic islet basement membrane loss and remodeling after mouse islet isolation and transplantation: impact for allograft rejection. Cell Transplant. 2014;23:59–72. [DOI] [PubMed] [Google Scholar]
- 40. Krugmann S, Anderson KE, Ridley SH, et al. Identification of ARAP3, a novel PI3K effector regulating both Arf and Rho GTPases, by selective capture on phosphoinositide affinity matrices. Mol Cell. 2002;9:95–108. [DOI] [PubMed] [Google Scholar]
- 41. Prentki M, Matschinsky FM. Ca2+, cAMP, and phospholipid-derived messengers in coupling mechanisms of insulin secretion. Physiol Rev. 1987;67:1185–1248. [DOI] [PubMed] [Google Scholar]
- 42. Zawalich WS, Zawalich KC. Regulation of insulin secretion by phospholipase C. Am J Physiol. 1996;271:E409–E416. [DOI] [PubMed] [Google Scholar]
- 43. Karimi M, Bereczky Z, Cohan N, Muszbek L. Factor XIII Deficiency. Semin Thromb Hemost. 2009;35:426–438. [DOI] [PubMed] [Google Scholar]
- 44. Naukkarinen J, Surakka I, Pietilainen KH, et al. Use of genome-wide expression data to mine the “gray zone” of GWA studies leads to novel candidate obesity genes. PLoS Genet. 2010;6:e1000976. [DOI] [PMC free article] [PubMed] [Google Scholar]
- 45. Schweighofer N, Lerchbaum E, Trummer O, et al. Androgen levels and metabolic parameters are associated with a genetic variant of F13A1 in women with polycystic ovary syndrome. Gene. 2012;504:133–139. [DOI] [PubMed] [Google Scholar]
- 46. Bungay PJ, Owen RA, Coutts IC, Griffin M. A role for transglutaminase in glucose-stimulated insulin release from the pancreatic β-cell. Biochem J. 1986;235:269–278. [DOI] [PMC free article] [PubMed] [Google Scholar]
- 47. Dhanoa BS, Cogliati T, Satish AG, Bruford EA, Friedman JS. Update on the Kelch-like (KLHL) gene family. Hum Genomics. 2013;7:13. [DOI] [PMC free article] [PubMed] [Google Scholar]
- 48. Gupta-Rossi N, Storck S, Griebel PJ, Reynaud CA, Weill JC, Dahan A. Specific over-expression of deltex and a new Kelch-like protein in human germinal center B cells. Mol Immunol. 2003;39:791–799. [DOI] [PubMed] [Google Scholar]
- 49. Kroll J, Shi X, Caprioli A, et al. The BTB-Kelch protein KLHL6 is involved in B-lymphocyte antigen receptor signaling and germinal center formation. Mol Cell Biol. 2005;25:8531–8540. [DOI] [PMC free article] [PubMed] [Google Scholar]
- 50. Puente XS, Pinyol M, Quesada V, et al. Whole-genome sequencing identifies recurrent mutations in chronic lymphocytic leukaemia. Nature. 2011;475:101–105. [DOI] [PMC free article] [PubMed] [Google Scholar]
- 51. Butcher MJ, Hallinger D, Garcia E, et al. Association of proinflammatory cytokines and islet resident leucocytes with islet dysfunction in type 2 diabetes. Diabetologia. 2014;57:491–501. [DOI] [PMC free article] [PubMed] [Google Scholar]
- 52. Nakayama Y, Nara N, Kawakita Y, et al. Cloning of cDNA encoding a regeneration-associated muscle protease whose expression is attenuated in cell lines derived from Duchenne muscular dystrophy patients. Am J Pathol. 2004;164:1773–1782. [DOI] [PMC free article] [PubMed] [Google Scholar]
- 53. Guauque-Olarte S, Gaudreault N, Piche ME, et al. The transcriptome of human epicardial, mediastinal and subcutaneous adipose tissues in men with coronary artery disease. PLoS One. 2011;6:e19908. [DOI] [PMC free article] [PubMed] [Google Scholar]
- 54. Peter ME. Programmed cell death: apoptosis meets necrosis. Nature. 2011;471:310–312. [DOI] [PubMed] [Google Scholar]
- 55. Newton K, Dugger DL, Wickliffe KE, et al. Activity of protein kinase RIPK3 determines whether cells die by necroptosis or apoptosis. Science. 2014;343:1357–1360. [DOI] [PubMed] [Google Scholar]
- 56. Yin X, Krikorian P, Logan T, Csizmadia V. Induction of RIP-2 kinase by proinflammatory cytokines is mediated via NF-κB signaling pathways and involves a novel feed-forward regulatory mechanism. Mol Cell Biochem. 2010;333:251–259. [DOI] [PubMed] [Google Scholar]
- 57. McCarthy JV, Ni J, Dixit VM. RIP2 is a novel NF-κB-activating and cell death-inducing kinase. J Biol Chem. 1998;273:16968–16975. [DOI] [PubMed] [Google Scholar]
- 58. Lopes M, Kutlu B, Miani M, et al. Temporal profiling of cytokine-induced genes in pancreatic β-cells by meta-analysis and network inference. Genomics. 2014;103:264–275. [DOI] [PubMed] [Google Scholar]
- 59. Ohgami RS, Campagna DR, McDonald A, Fleming MD. The Steap proteins are metalloreductases. Blood. 2006;108:1388–1394. [DOI] [PMC free article] [PubMed] [Google Scholar]
- 60. Moldes M, Lasnier F, Gauthereau X, et al. Tumor necrosis factor-α-induced adipose-related protein (TIARP), a cell-surface protein that is highly induced by tumor necrosis factor-α and adipose conversion. J Biol Chem. 2001;276:33938–33946. [DOI] [PubMed] [Google Scholar]
- 61. Kralisch S, Sommer G, Weise S, et al. Interleukin-1β is a positive regulator of TIARP/STAMP2 gene and protein expression in adipocytes in vitro. FEBS Lett. 2009;583:1196–1200. [DOI] [PubMed] [Google Scholar]
- 62. Sparna T, Retey J, Schmich K, et al. Genome-wide comparison between IL-17 and combined TNF-α/IL-17 induced genes in primary murine hepatocytes. BMC Genomics. 2010;11:226. [DOI] [PMC free article] [PubMed] [Google Scholar]
- 63. Wellen KE, Fucho R, Gregor MF, et al. Coordinated regulation of nutrient and inflammatory responses by STAMP2 is essential for metabolic homeostasis. Cell. 2007;129:537–548. [DOI] [PMC free article] [PubMed] [Google Scholar]
- 64. Brissova M, Fowler MJ, Nicholson WE, et al. Assessment of human pancreatic islet architecture and composition by laser scanning confocal microscopy. J Histochem Cytochem. 2005;53:1087–1097. [DOI] [PubMed] [Google Scholar]
- 65. Cabrera O, Berman DM, Kenyon NS, Ricordi C, Berggren PO, Caicedo A. The unique cytoarchitecture of human pancreatic islets has implications for islet cell function. Proc Natl Acad Sci USA. 2006;103:2334–2339. [DOI] [PMC free article] [PubMed] [Google Scholar]
- 66. Eguchi K, Manabe I. Macrophages and islet inflammation in type 2 diabetes. Diabetes Obes Metab 2013;15(suppl 3):152–158. [DOI] [PubMed] [Google Scholar]
- 67. Hauge-Evans AC, Squires PE, Persaud SJ, Jones PM. Pancreatic β-cell-to-β-cell interactions are required for integrated responses to nutrient stimuli: enhanced Ca2+ and insulin secretory responses of MIN6 pseudoislets. Diabetes. 1999;48:1402–1408. [DOI] [PubMed] [Google Scholar]
- 68. Nunemaker CS, Zhang M, Wasserman DH, et al. Individual mice can be distinguished by the period of their islet calcium oscillations: is there an intrinsic islet period that is imprinted in vivo? Diabetes. 2005;54:3517–3522. [DOI] [PubMed] [Google Scholar]
- 69. Nunemaker CS, Dishinger JF, Dula SB, et al. Glucose metabolism, islet architecture, and genetic homogeneity in imprinting of [Ca2+]i and insulin rhythms in mouse islets. PLoS One 2009;4:e8428. [DOI] [PMC free article] [PubMed] [Google Scholar]
- 70. Chowdhury A, Dyachok O, Tengholm A, Sandler S, Bergsten P. Functional differences between aggregated and dispersed insulin-producing cells. Diabetologia. 2013;56:1557–1568. [DOI] [PMC free article] [PubMed] [Google Scholar]
- 71. McCarthy MI. Genomics, type 2 diabetes, and obesity. N Engl J Med. 2010;363:2339–2350. [DOI] [PubMed] [Google Scholar]