

Abstract
We have combined Fourier transform IR, polarized Raman spectroscopy, and vibrational CD measurements of the amide I′ band profile of alanyl-X-alanine tripeptides in 2H2O to obtain the dihedral angles of their central amino acid residue. X represents glycine, valine, methionine, histidine, serine, proline, lysine, leucine, tryptophan, tyrosine, and phenylalanine. The experimental data were analyzed by means of a recently developed algorithm, which exploits the excitonic coupling between the amide modes of the two peptide groups. The results were checked by measuring the respective electronic CD spectra. The investigated peptides can be sorted into three classes. Valine, phenylalanine, tryptophan, histidine, and serine predominantly adopt an extended β-strand conformation. Cationic lysine and proline prefer a polyproline II-like structure. Alanine, methionine, glycine, and leucine populate these two conformations with comparable probability. Our results are in variance with the prediction of the random-coil model, but supportive of Flory's isolated-pair hypothesis. We combined the obtained structural propensities of the investigated residues and similar information about other residues in the literature (i.e., glutamate, aspartate, isoleucine, and glutamine) to predict possible conformations of the monomeric amyloid β peptide Aβ1–42 in aqueous solution, which reproduces results from most recent spectroscopic studies. Thus, it is demonstrated that the unfolded state of peptides can be understood in terms of the intrinsic structural propensities of their amino acid residues.
Proteins are often called the workhorses of a living cell because they perform a plethora of functions, such as catalysis, transportation of nutrients, and recognition and transmission of signals. It was demonstrated >40 years ago that the amino acid sequence of a protein determines its ultimate conformation and function. However, this view is currently under scrutiny because of the discovery of natural “disordered” or unfolded proteins with very well defined functions (1). Such intrinsically unstructured proteins (IUPs) (2) have been found to be involved in DNA/RNA–protein interaction, functioning as inhibitors and scavengers and facilitating the formation and function of multiprotein complexes (1, 3). Other IUPs mediate regulatory posttranslational modification processes, such as phosphorylation and proteolysis. The discovery of natively unfolded proteins has led Wright and Dyson (3) to propose a reassessment of the structure–function paradigm.
The unfolded state of proteins and peptides is still widely conceived as being completely disordered structurally because the respective dihedral angles are assumed to sample the entire allowed region of the Ramachandran space (4–9). This view reflects the predictions of the random-coil model of Brant and Flory (7), who treated an unfolded polypeptide like a synthetic flexible polymer. However, experimental and theoretical evidence have been provided during the last 15 years for the notion that well defined conformations can persist locally even in disordered peptides and proteins (10). In this context, the polyproline II (PPII) conformation, which is a left-handed helix with an axial translation of 3.2 Å composed of three prolyl residues per turn (11), has emerged as the most relevant structural motif (12). The classical secondary structures, such as α-helices, β-sheets, and turns, are stabilized by a combination of local, nonlocal, and peptide–solvent interactions (13), whereas the PPII conformation of nonproline residues can exist only in water and reflects the local propensity of a given residue (14–17). From these findings, it follows that even short peptides should be able to adopt the PPII conformation, contrasting the common belief that their structure is random (13). Indeed, a (temperature-dependent) mixture of PPII and extended β-strand conformation has been obtained for trialanine (18–20) and various alanine-based oligopeptides (21, 22). PPII-like conformations were also obtained for EEE, DDD, and KKK (23). Even the classical alanine dipeptide seems to occupy predominantly the PPII conformation (15). On the contrary, trivaline mostly adopts an extended β-sheet conformation (18, 19).
Theoretical calculations by Pappu and coworkers (17, 24) suggest that Flory's isolated-pair hypothesis is valid for all extended conformations in the upper left quadrant of the Ramachandran plot. Therefore, the local conformation of an unfolded peptide strongly reflects the intrinsic structural propensities of the respective amino acid residue. To address this issue experimentally, we performed a simple host–guest experiment by analyzing the structure of a series of AXA peptides, where X represents G, V, L, M, K, S, H, P, Y, W, and F. The solution structure of A3 has already been investigated (18, 19). A recently developed strategy involving the combined application of Fourier transform (FT) IR, polarized Raman spectroscopy, as well as vibrational CD (VCD) and electronic CD (ECD) measurements is applied to obtain the dihedral angles of the X. The results of our analysis are at variance with the random-coil model. The applicability of our results for a more detailed understanding of the unfolded state is corroborated by our prediction of possible structures of monomeric amyloid peptides in aqueous solution based on individual propensities of the amino acid residues investigated in this study and related studies.
Theoretical Background
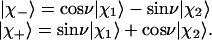
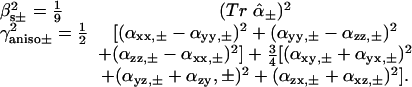
The theory used to obtain the dihedral angles of tripeptides from the amide I′ bands in their visible Raman and IR spectra has been described in detail (25, 26). Briefly, we invoked a two-oscillator model to describe the mixing between the two amide I′ modes of tripeptides by transition dipole and through-bond coupling (27). This approach was justified recently (28) by detailed computational studies on tripeptides and higher-order peptides. The corresponding excitonic states are written as follows:
 |
[1] |
The parameter ν describes the degree of mixing between the unperturbed states  and
and  which is maximal at ν = 45°. This case requires the unperturbed modes to be accidentally degenerate.
  and
and  are the excitonic states of the in-phase and out-of-phase combination of the interacting modes, respectively.
The mixing parameter ν can be determined from the intensity ratio 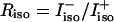 of the two amide I′ bands in the spectrum of isotropic Raman scattering (
 and
and  are the isotropic intensities of
  and
and  , respectively). The corresponding ratio
 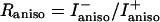 depends on the mixing parameter and on the dihedral angles φ and Ψ, which determine the relative orientation of the peptide groups. To extract this information from the experimentally determined Raniso value, the Raman tensor of the excitonic states
  and
and  has to be calculated as follows:
 |
[2] |
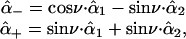
where  and
and  are the amide I′ Raman tensors of the two peptide groups. To calculate
  and
and  , one peptide tensor has to be transformed into the coordinate system of the other one (26). Thus, the Raman tensors of the excitonic states become dependent on the relative orientation of the peptide groups.
The tensors calculated by means of Eq. 2 can be used to calculate the isotropic and anisotropic scattering for the two excitonic states as follows:
 |
[3] |
Eq. 3 can be used to calculate 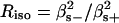 and
and 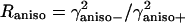 as a function of the mixing parameters ν and the dihedral angles φ and Ψ.
In the next step, we use the mixing parameter and the intensity ratio 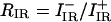 in the FT IR spectrum to obtain the angle
  between the transition dipole moments of the amide I′ mode.
  can be calculated as a function of φ and Ψ. The related algorithm is described in ref. 26. Only φ and Ψ values that reproduce the experimentally obtained Raniso and RIR are considered to be consistent with the experimental data. Thus, up to eight solutions are generally obtained. In most cases, six of them can be ruled out because they represent sterically forbidden conformations.
The physical, dihedral, and oriental parameters obtained as described were finally used to simulate the VCD signal of amide I′, as described in detail in ref. 18. Thus, VCD serves as a check of our analysis and is used to discriminate between the different solutions obtained from the IR and Raman spectroscopic data. In most cases, this procedure yields a single pair of values for φ and Ψ.
Materials and Methods
Materials. l-alanyl-l-glycyl-l-alanine (AGA), l-alanyl-l-tryptophyl-l-alanine (AWA), l-alanyl-l-prolyl-l-alanine (APA), l-alanyl-l-histidyl-l-alanine (AHA), l-alanyl-l-leucyl-l-alanine (ALA), l-alanyl-l-phenylalanyl-l-alanine (AFA), l-alanyl-l-tyrosyl-l-alanine (AYA) were purchased from Bachem Bioscience Inc. (>98% purity) and used without further purification. l-alanyl-l-seryl-l-alanine (ASA), l-alanyl-l-lysyl-l-alanine (AKA), l-alanyl-l-methionyl-l-alanine (AMA), l-alanyl-l-valinyl-l-alanine (AVA) were custom-synthesized by Peptide International (95% purity). AVA and AMA peptides exhibited significant signal contributions to the amide I′ region from trifluoroacetic acid (TFA), which is an HPLC purification solvent. Here, we used several steps of freeze-drying of the peptide in 0.1 M HCl to remove the TFA before the final spectroscopic data acquisition. NaClO4 was obtained from Sigma. All chemicals were of analytical grade. The peptides were dissolved in 2H2O at a concentration of 0.1–0.2 M for IR, Raman spectroscopy, and VCD and 1 mM for ECD. The p2H of the solutions was adjusted by adding small aliquots of 2HCl or NaO2H to obtain the different protonation states of the peptides. The p2H values were determined by using the method of Glasoe and Long (29) to correct the values obtained from pH electrode measurements. For the Raman spectroscopy experiments, the solvent contained 0.1 M NaClO4, the 934 cm-1 Raman band of which was used as an internal standard (30).
Spectroscopies. We used the same equipment and experimental set ups described in ref. 18. The Raman spectra were obtained with the 442 nm (65 mW) excitation from an IK 4601R-E HeCd laser (Kimmon Electric, Englewood, CO). The ChiralIR VCD instrumentation (Biotools, Edmonton, Alberta, Canada) description was the same as used in ref. 18.
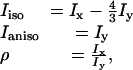
Spectral Analysis. All IR and Raman spectra were analyzed by using the program multifit (31). They were normalized to the internal standard (the ClO4- band at 934 cm-1). To eliminate solvent contributions, we measured the solvent reference spectra for both polarizations, which were then subtracted from the corresponding peptide spectra. The intensities of the normalized polarized Raman bands were derived from their band areas. These and the corresponding IR spectrum were self-consistently analyzed in that they were fitted with a set of identical frequencies, half-widths and band profiles. The isotropic and anisotropic Raman intensities and the depolarization ratios ρ were calculated as follows:
 |
[4] |
where Ix and Iy denote the Raman scattering, polarized parallel and perpendicular to the polarization of the exciting laser light.
Results
Experimental and Theoretical Protocol. We have measured the FT IR, isotropic Raman, anisotropic Raman, and VCD spectra of a series of AXA peptides in 2H2O, where X represents V, L, S, M, G, P, H, K,W, Y, and F. For most of these peptides, we took spectra at acid, neutral, and alkaline p2H. In our analysis, we generally preferred the spectra taken at neutral p2H because the amide I′ couplet in the respective VCD spectra are nearly symmetric and, therefore, easier to analyze (18). However, for AHA and AKA, we also analyzed the spectra taken at p2H 1 to avoid the coexistence of different protonation states. For AYA and AWA, we analyzed only the cationic state (p2H 1) because fluorescence impaired the analysis of the Raman spectra at neutral and alkaline pH. Finally, we selected the anionic state for APA (p2H 12) because the two amide I′ bands are better resolved than in the corresponding spectra of the zwitterionic and anionic states. The selective use of spectra can be justified because the protonation states of the terminal groups generally have only a very limited influence on the conformation of the central amino acid (18). The conformations reflected by the obtained dihedral angles are classified in terms of the conformational letter code suggested by Zimmerman et al. (6), namely, E for -180° ≤ φ ≤ -110°, 110° ≤ Ψ ≤ 180° and F for -110° ≤ φ ≤ -40°, 130° ≤ Ψ ≤ 180°. Other conformational regions considered by Zimmerman et al. are not relevant to the present study.
Structure Analysis of AXA Peptides. Fig. 1 shows a representative data set depicting the spectra of APA, ALA, and AFA at 1,550–1,700 cm-1. The self-consistent decomposition of the IR and Raman spectra yielded the amide I′ bands AI- and AI+, which are assignable to the out-of-phase and in-phase combination of the two amide I′ vibrations, respectively. Apparently, the corresponding intensity ratios are significantly different for P, L, and F, indicating that their dihedral angles are different. The amide I′ VCD signals of those three peptides reflect a left-handed conformation. The intensity ratios Riso, Raniso, and RIR obtained from the spectral analysis were used to obtain the dihedral angles, which are given in Table 1. The φ and Ψ values obtained for the three residues each reflect an extended left-handed structure in the upper left quadrant of the Ramachandran plot (Fig. 2). The respective angles and the transition dipole moments that were inferred from the integrated IR intensities were used to calculate the VCD signal, and an excellent agreement with the experimental spectra were obtained (solid lines in Fig. 1).
Fig. 1.

Isotropic and anisotropic Raman and IR amide I′ spectra of anionic APA and zwitterionic ALA and AFA measured in 2H2O. The Raman spectra were measured with a 442-nm excitation (laser power, 65 mW; slit width, 100 μm). The solid lines in the IR and Raman spectra are the results of a self-consistent spectral decomposition. The solid line in the representation of the VCD spectra results from calculations using the dihedral angles obtained from the IR and Raman spectroscopic data.
Table 1. Spectroscopic parameters and the obtained dihedral angles of AYA peptides.
| AXA | RIR | Riso | Raniso | ρ+ | ρ- | ϕ,o | ψ,o |
|---|---|---|---|---|---|---|---|
| AAA† | 1.52† | 0.48† | 1.14† | 0.22† | 0.13† | –120 + 7/–3† | 164 + 7/–2† |
| AFA | 1.52 | 0.46 | 0.88 | 0.21 | 0.13 | –140 ± 15 | 170 ± 10 |
| AGA | 1.35 | 0.34 | 1.31 | 0.23 | 0.08 | –105 ± 20 | 170 ± 10 |
| AMA | 1.35 | 0.45 | 1.16 | 0.19 | 0.09 | –110 ± 10† | 170 ± 10† |
| AHA‡ | 1.8 | 0.2 | 1.14 | 0.35 | 0.13 | –160 ± 10 | 140 ± 10 |
| AHA§ | 1.55 | 0.56 | 0.94 | 0.25 | 0.15 | –130 ± 10 | 170 ± 10 |
| AVA¶ | — | 0.51 | 0.93 | 0.2 | 0.12 | –165 ± 5 | 140 ± 5 |
| AKA‡ | 1.64 | 0.53 | (0.6)? | 0.08 | 0.07 | –155 ± 10 | 145 ± 10 |
| AKA§ | 1.16 | 0.42 | 1.06 | 0.16 | 0.17 | –55 ± 10 | 150 ± 20 |
| ALA | 1.45 | 0.5 | 1.02 | 0.29 | 0.18 | –125 ± 5 | 170 ± 10 |
| AYA§ | 1.15 | 0.38 | 4.0 | 0.34 | 0.05 | –70 ± 10 | 150 ± 10 |
| APA∥ | 1.2 | 0.8 | 1.05 | 0.18 | 0.15 | –75 ± 5 | 150 ± 5 |
| AWA§ | 1.5 | 0.38 | (0.5)* | 0.25 | 0.13 | –170 ± 10** | 150 ± 20** |
| ASA | 1.75 | 0.3 | 0.7 | 0.38 | 0.23 | –130 ± 10 | 178 ± 20 |
Taken from ref. 18
Zwitterionic
Cationic
RIR could not be determined because of a strong spectral contamination from the 1,676 cm-1 band of TFA, which could not be eliminated
Anionic
The dihedral angles reflect a combined analysis of the Raman and VCD spectra
Fig. 2.

Representation of the dihedral angles obtained for the investigated AXA peptides in the upper left square of the Ramachandran space. The Zimmerman code was used to differentiate between the conformational regions of extended β-strand and PPII. The dotted and solid vertical lines are from the transition region discussed in the text.
The obtained φ and Ψ angles of APA and AFA are indicative of a nearly canonical PPII conformation in the F region for APA and a mostly extended, β-strand-like conformation in the E region for the AFA (Fig. 2). ALA, however, behaves like AAA in that the dihedral angles reflect a representative conformation with a φ angle of -125°. Its coordinate is close to the border between the E and F regions. This “transition region” is illustrated in Fig. 2. Our earlier findings on AAA, KAA, and SAA suggest that dihedral angles in this region reflect a nearly equal mixture of PPII and β-strand (18, 19).
Fig. 3 depicts the ECD spectra of the above peptides taken at different temperatures. ALA and APA show the asymmetric couplet with a minimum at 195 and a maximum at 210–220 nm, diagnostic of a substantial PPII fraction (12, 19). The signal is more pronounced for APA, indicating a larger PPII population. The spectra of AFA do not correspond to any of the reported basis spectra of secondary structures (32). Peptides with aromatic residues show a totally different spectrum, which results from excitonic coupling between residue and backbone transitions (33). This effect precludes any structural information from this spectrum.
Fig. 3.

Temperature-dependent ECD spectra of APA, ALA, and AFA measured at p2H 1. The increment for the spectra recording was 20°C. Inset displays the difference spectra Δε (80°–0°).
The Raman, IR and VCD spectra of the remaining peptides (AGA, AVA, AHA, AMA, AKA, AYA, AWA, and ASA) were analyzed correspondingly. To demonstrate the validity of the obtained results, Fig. 4 exhibits the corresponding VCD spectra together with the simulations based on the respective dihedral angles derived from the IR and Raman spectra. Thus, we found that the conformation of their central residue falls well into the three categories represented by APA (PPII, F), ALA (PPII, F and β-strand, E), and AFA (β-strand, E). AHA, ASA, AVA, AWA, and zwitterionic AKA clearly prefer an extended β-strand conformation in the E region. Cationic AKA is predominantly PPII (F). AGA and AMA are assignable to the border region between E and F, which indicates a mixture of PPII and β-strand. All spectroscopic parameters and the obtained dihedral angles are given in Table 1. Fig. 2 illustrates the dihedral angles in the coordinate frame of the Ramachandran plot. For completeness, we have also added the recently reported dihedral angles for E and D (23), which are both located in the F region.
Fig. 4.

VCD spectra of zwitterionic AXA peptides at 1,500–1,750 cm-1. The solid lines resulted from a calculation based on the dihedral angles obtained from the analysis of the IR and Raman band profiles of amide I′, as described in the text. The AKA couplet in Top reflects the cationic state, and that in Middle is the zwitterionic state of the terminal groups.
Some of these results deserve further comments. It has to be noted that the VCD spectrum of AGA displays three bands with a negative signal flanked by two positive ones. We tested two possible explanations. First, we assumed that G could also sample the α-helical region. This scenario did not yield a quantitatively satisfactory reproduction of the VCD spectrum. Second, we assumed that G could also sample the lower right quadrant of the Ramachandran space. Now, we obtain a satisfactory agreement with the experimental spectrum.
The analysis of the spectra of AYA was difficult because the VCD spectrum reveals vibrational coupling between the tyrosine ring mode at 1,610 cm-1 and the C-terminal amide I mode. In contrast to AWA and AFA, the AYA ring mode exhibits some IR intensity reflecting an intrinsic transition dipole moment, which can interact with that of the amide I mode. This coupling yields excitonic mixing of the vibrational states and a couplet in the VCD spectrum, which overlaps with that of amide I. The simulation of the VCD spectrum does not take this interaction into account. It is, therefore, not surprising that the negative signal at AI- was reproduced only qualitatively (Fig. 4).
We have also measured the ECD spectra for X = G, V, H, M, K, H, Y, W, and S. As expected, we observed the PPII couplet for all nonaromatic residues (data not shown), including also AVA, AHA, and ASA because the terminal alanine residues can be expected to populate PPII at least partially. Generally, a quantitative interpretation is by far more difficult for ECD than for VCD spectra, because ECD spectra result from a superposition of contributions from all residues, whereas VCD spectra mostly reflect coupling between the peptide groups. A detailed comparative study on the CD spectra of dipeptides and tripeptides is necessary to determine the individual residue contribution to the ECD signal.
Discussion
Several important conclusions can be drawn immediately from our results. First, they strongly corroborate the notion that individual amino acid residues have a clear structural preference in aqueous solution and that they do not sample the entire sterically allowed part of the Ramachandran space, as suggested, for example, in the earlier studies of Scheraga and colleagues (6) and reiterated in a very recent computational study on proline-based peptides (34). Second, they provide evidence for the notion that, in the absence of any nonlocal interactions, the conformation of a polypeptide chain in the so-called unfolded state can be described in terms of a two-state model comprising PPII and an extended β-strand. The individual residue structure within these regions certainly depends on the respective residue, particularly for the extended β-strand (35). Third, our data support the isolated-pair hypothesis (36), in that APA, AVA, and cationic AKA resemble P3, V3, and K3 with respect to the conformation of the central residue, which indicates that it is not context-dependent. A nonlocal interaction is discernable only for zwitterionic AKA in that K is switched to a β-strand conformation in the zwitterionic state, apparently because of the Columbic interactions between side chains. Our data are in line with results from recent host–guest experiments on AcP3-X-P3GY-NH2 peptides, in that these experiments revealed the hierarchy P >> A > G, L, M > V for the PPII propensity of X (37). Our data suggest that the PPII propensity of nonproline residues does not depend on the proline context but is instead an intrinsic property, in accordance with recent theoretical prediction by Pappu and coworkers (38). Comparison with the study of Avbelj and Baldwin (35) is even more important. They obtained a large set of dihedral angles from the coil library of the Protein Data Bank and plotted the frequency curves g(φ) for a set of representative amino acid residues. They showed that these curves could be decomposed into two Gaussian distributions assignable to PPII and extended β-strand. They found that these distributions are not consistent with predictions of the random-coil model of Brant and Flory (7). The PPII propensity hierarchy emerging from their data are A > L > F >> V, which coincides well with our findings, even though our data indicate a somewhat higher β-strand propensity for F. Our results, combined with the data in the discussed literature, clearly reveal that the coil state of peptides and proteins is not random and that the local conformation reflects, to a major extent, the individual propensity of the amino acid. This finding is important for the understanding of the structure of unfolded states of proteins and peptides.
Our ECD spectra (Fig. 3) indicate that either the extended β-strand conformation or a truly random coil state is stabilized at the expense of PPII at higher temperatures (19, 22). Our recent analysis on tripeptides is more supportive of a dominant β-strand conformation, even though some degree of heterogeneity cannot be excluded (16). Interestingly, a study by Gruebele and coworkers (39) underscores this notion in that it reveals a substantial β-strand character of proteins at high temperature.
We now use the structural propensities obtained in the present study and related data reported by Kelly et al. (37), Chellgren and Creamer (40), and Avbelj and Baldwin (35) to predict some conformational properties of the amyloid peptide Aβ1–42. To this end, we assumed the absence of any nonlocal interactions. This consumption might be considered unrealistic for such a long polypeptide chain, but a very recent NMR study reported by Hou et al. (41) revealed weak backbone hydrogen bonding only for the residues E11 and S26, which were interpreted as indicating a turn or bend-like structure of the segments D7-E11 and F20-S26. The remaining part of the peptide is described as exhibiting a mixture of random coil and short β-strand-like segments. Large scale structures do not exist. Earlier NMR and ECD data provided compelling evidence that α-helical segments require the presence of membrane mimetic or special helix formation supporting reagents (42). In the absence of any nonlocal interactions, the conformational manifold reflects the individual propensities of the side chains, which yields the following Zimmerman code sequence for Aβ1–42: D1(F)-A2(F/E)-E3(F)-F4(E)-R5(F)-H6(E)-D7(F)-S8(E)-G9(F/E)-Y10(F)-E11(F)-V12(E)-H13(E)-H14(E)-Q15(F)-K16(F)-L17(F/E)-V18(E)-F19(E)-F20(E)-A (21)(F/E)-E22(F)-D23(F)-V24(E)-G25(F/E)-S26(E)-N27(E)-K28(F)-G29(F/E)-A (30)(F/E)-I31(E)-I32(E)-G33(F/E)-L34(F/E)-M35(F/E)-V36(E)-G37(F/E)-G38(F/E)-V39(E)-V40(E)-I41(E)-A42(F/E). The notation F/E indicates a mixture of PPII and β-strand. The predictions for D and E were made based on the recently resulted conformation of D3 and E3 (23). We assume that R has also a high PPII propensity, whereas I is comparable with V (37). It follows from our assignment that the highest possible PPII content is ≈60%, whereas the lowest is 26%. If we assume that PPII and β-strand are isoenergetic for A, L, M, and G, the conformation with 43% PPII has the highest probability and 213 = 8,192 different conformations coexist. The respective combinatorial entropy is 67 J/K, corresponding to a free energy contribution of ≈20 kJ/mol at room temperature. The NMR data of Hou et al. were interpreted as suggesting that the segments L17-V18-F19-F20 and V39-V40-I41 adopt a β-strand structure (41). This result is in nearly perfect agreement with our prediction. Altogether, however, our prediction suggests that the so-called random-coil fraction of the peptide inferred from the NMR data contains a dynamic mixture of PPII and extended residue conformations.
The existence of a substantial PPII propensity of the amyloid peptide is supported by experiments on shorter Aβ fragments. Jarvet et al. (43) investigated Aβ12–28 by CD and NMR and identified a substantial PPII population. We have recently arrived at a similar conclusion for the longer and more representative fragment Aβ1–28 by comparing the experimentally obtained amide I′ band profile of the anisotropic Raman spectrum with simulation for various conformations assignable to the left-handed quadrant of the Ramachandran plot (44). An estimation based on the propensities described above yields an average PPII content of 50% for this peptide. By comparing the respective Δε values at the 195-nm minima of the ECD spectra of P3 (100% PPII) (26) and Aβ1–28 (44), we roughly estimated a fraction of 65 ± 5%. This result indicates that our prediction even underestimates the average PPII content, which is indeed not unlikely because theoretical (45) and experimental evidence (46, 47) has been provided recently for the notion that the PPII propensity of alanine increases with the number of residues, probably because of peptide–solvent interactions (45). This “enhancement” effect has not been taken into consideration in our prediction.
Summary
We combined FT IR, Raman, VCD, and ECD spectroscopy to obtain the central residue conformation for a series of AXA peptides. Our results are at variance with the random-coil model for peptides and proteins in that they reveal a clear structural preference in aqueous solution of all investigated amino acid residues. A strong PPII propensity was obtained for K, Y, and P. However, we found that G, M, L, and A exhibit similar propensities for PPII and an extended β-strand conformation at room temperature. F,V, H, W, and S clearly prefer a β-strand conformation. From our earlier studies, we know that D and E also adopt a PPII-like structure (23). In this study, we combined our results with structural propensities reported previously to predict possible conformations for the amyloid peptide Aβ1–42. The result of this prediction is in good agreement with recent spectroscopic studies. Hence, the knowledge of the individual propensity can be used as a very suitable starting point for predicting the structure of unfolded peptides and disordered proteins, as well as for simulations of protein folding.
Acknowledgments
We thank Dr. Michael Zagorski for providing us with a copy of the galley of ref. 41 and Thomas Measey for a thorough check of the manuscript. This work was supported by National Institutes of Health Center of Biomedical Research Excellence II Grant P20 RR16439-01 (to the Center for Research in Protein Structure, Function, and Dynamics), and the University of Puerto Rico Fondos Institucionales para la Investigación Grant 20-02-2-78-514.
This paper was submitted directly (Track II) to the PNAS office.
Abbreviations: ECD, electronic CD; FT, Fourier transform; VCD, vibrational CD; PPII, polyproline II.
References
- 1.Dunker, A. K., Lawson, J. D., Brown, C. J., Williams, R. M., Romero, P., Oh, J. S., Oldfield, C. J., Campen, A. M., Ratliff, C. M., Hipps, K. W., et al. (2001) J. Mol. Graphics Model. 19, 26-59. [DOI] [PubMed] [Google Scholar]
- 2.Tompa, P. (2002) Trends Biochem. Sci. 27, 527-533. [DOI] [PubMed] [Google Scholar]
- 3.Wright, P. E. & Dyson, H. J. (1999) J. Mol. Biol. 293, 321-331. [DOI] [PubMed] [Google Scholar]
- 4.Tanford, C., Kawahara, K. & Lapanje, S. (1967) J. Am. Chem. Soc. 89, 729-736. [DOI] [PubMed] [Google Scholar]
- 5.Tanford, C. (1968) Adv. Protein Chem. 23, 121-282. [DOI] [PubMed] [Google Scholar]
- 6.Zimmerman, S. S., Pottle, M. S., Némethy, G. & Scheraga, H. A. (1977) Macromolecules 10, 1-9. [DOI] [PubMed] [Google Scholar]
- 7.Brant, D. A. & Flory, P. J. (1965) J. Am. Chem. Soc. 87, 2791-2800. [Google Scholar]
- 8.Smith, L. J., Bolin, K. A., Schwalbe, H., MacArthur, M. W., Thornton, J. M. & Dobson, C. M. (1996) J. Mol. Biol. 255, 494-506. [DOI] [PubMed] [Google Scholar]
- 9.Schwalbe, H., Fiebig, K. M., Buck, M., Jones, J. A., Grimshaw, S. B., Spencer, A., Glaser, S. J., Smith, L. J. & Dobson, C. M. (1997) Biochemistry 36, 8977-8991. [DOI] [PubMed] [Google Scholar]
- 10.Bochicchio, B. & Tamburro, A. M. (2002) Chirality 14, 782-792. [DOI] [PubMed] [Google Scholar]
- 11.Cowan, P. M. & McGavin, S. (1955) Nature 176, 501-503. [DOI] [PubMed] [Google Scholar]
- 12.Shi, Z., Woody, R. W. & Kallenbach, N. R. (2002) Adv. Protein Chem. 62, 163-240. [DOI] [PubMed] [Google Scholar]
- 13.Dill, K. A. (2002) Protein Sci. 8, 1166-1180. [DOI] [PMC free article] [PubMed] [Google Scholar]
- 14.Han, W. G., Jalkanen, J., Elstner, M. & Suhai, S. (1998) J. Phys. Chem. B 102, 2587-2602. [Google Scholar]
- 15.Weise, C. F. & Weisshaar, J. C. (2003) J. Phys. Chem. B 107, 3265-3277. [Google Scholar]
- 16.Eker, F., Cao, X., Nafie, L., Huang, Q. & Schweitzer-Stenner, R. (2003) J. Phys. Chem. B 107, 358-365. [Google Scholar]
- 17.Pappu, R. V. & Rose, G. D. (2002) Protein Sci. 11, 2437-2455. [DOI] [PMC free article] [PubMed] [Google Scholar]
- 18.Eker, F., Cao, X., Nafie, L. & Schweitzer-Stenner, R. (2002) J. Am. Chem. Soc. 124, 14330-14341. [DOI] [PubMed] [Google Scholar]
- 19.Eker, F., Griebenow, K. & Schweitzer-Stenner, R. (2003). (2003) J. Am. Chem. Soc. 125, 878-885. [DOI] [PubMed] [Google Scholar]
- 20.Mu, Y., Kosov, D. S. & Stock, G. (2003) J. Phys. Chem. B 107, 5064-5073. [Google Scholar]
- 21.Park, S.-H., Shalongo, W. & Stellwagen, E. (1997) Protein Sci. 6, 1694-1700. [DOI] [PMC free article] [PubMed] [Google Scholar]
- 22.Shi, Z., Olson, C. A., Rose, G. D., Baldwin, R. L. & Kallenbach, N. R. (2002) Proc. Natl. Acad. Sci. USA 99, 9190-9195. [DOI] [PMC free article] [PubMed] [Google Scholar]
- 23.Eker, F., Griebenow, K., Cao, X., Nafie, L. & Schweitzer-Stenner, R. (2004) Biochemistry 43, 613-621. [DOI] [PubMed] [Google Scholar]
- 24.Pappu, R. V., Srinivasan, R. & Rose, G. D. (2000) Proc. Natl. Acad. Sci. USA 97, 12565-12570. [DOI] [PMC free article] [PubMed] [Google Scholar]
- 25.Schweitzer-Stenner, R. (2002) Biophys. J. 83, 523-532. [DOI] [PMC free article] [PubMed] [Google Scholar]
- 26.Schweitzer-Stenner, R., Eker, F., Perez, A., Griebenow, K., Cao, X. & Nafie, L. (2003) Biopolymers 71, 558-568. [DOI] [PubMed] [Google Scholar]
- 27.Torii, H. & Tasumi, M. (1998) J. Raman Spectrosc. 29, 81-86. [Google Scholar]
- 28.Choi, J.-H., Ham, S. & Cho, M. (2003) J. Phys. Chem. 107, 9132-9138. [Google Scholar]
- 29.Glasoe, P. K. & Long, F. A. (1960) J. Phys. Chem. 64, 188-193. [Google Scholar]
- 30.Sieler, G. & Schweitzer-Stenner, R. (1997) J. Am. Chem. Soc. 119, 1720-1726. [Google Scholar]
- 31.Jentzen, W., Unger, E., Karvounis, G., Shelnutt, J. A., Dreybrodt, W. & Schweitzer-Stenner, R. (1996) J. Phys. Chem. 100, 14184-14191. [Google Scholar]
- 32.Sreerama, N. & Woody, R. W. (1994) Biochemistry 33, 10022-10025. [DOI] [PubMed] [Google Scholar]
- 33.Woody, R. W. (1992) Adv. Biophys. Chem. 2, 37-79. [Google Scholar]
- 34.Vila, J. A., Baldoni, H., Ripoli, D. R., Ghosh, A. & Scheraga, H. A. (2004) Biophys. J. 86, 731-742. [DOI] [PMC free article] [PubMed] [Google Scholar]
- 35.Avbelj, F. & Baldwin, R. L. (2003) Proc. Natl. Acad. Sci. USA 100, 5742-5747. [DOI] [PMC free article] [PubMed] [Google Scholar]
- 36.Flory, P. J. (1969) Statistical Mechanics of Chain Molecules (Wiley, New York), p. 252.
- 37.Kelly, M. A., Chellgren, B. W., Rucker, A. L., Troutman, J. M., Fried, M. G., Miller, A.-F. & Creamer, T. P. (2001) Biochemistry 40, 14376-14383. [DOI] [PubMed] [Google Scholar]
- 38.Drozdov, A. N., Grossfield, A. & Pappu, R. V. (2004) J. Am. Chem. Soc. 126, 2574-2581. [DOI] [PubMed] [Google Scholar]
- 39.Wang, W. Y., Larios, E. & Gruebele, M. (2003) J. Am. Chem. Soc. 125, 16220-16227. [DOI] [PubMed] [Google Scholar]
- 40.Chellgren, B. W. & Creamer, T. P. (2004) Biochemistry 43, 5864-5869. [DOI] [PubMed] [Google Scholar]
- 41.Hou, L., Shao, H., Zhang, Y., Li, H., Menon, N. K., Neuhaus, E. B., Brewer, J. M., Byeon, I. J., Ray, D. G., Vitek, M. P., et al. (2004) J. Am. Chem. Soc. 126, 1993-2005. [DOI] [PubMed] [Google Scholar]
- 42.Ma, K., Clancy, E. L., Zhang, Y, Ray, D. G., Wollenberger, K. & Zagorski, M. G. (1999) J. Am. Chem. Soc. 121, 8698-8706. [Google Scholar]
- 43.Jarvet, J., Damberg, P., Danielsson, J., Johansson, I., Eriksson, L. E. G. & Gräslund, A. (2003) FEBS Lett. 555, 371-374. [DOI] [PubMed] [Google Scholar]
- 44.Eker, F., Griebenow, K. & Schweitzer-Stenner, R. (2004) Biochemistry 43, 6893-6898. [DOI] [PubMed] [Google Scholar]
- 45.Garcia, A. (2004) Polymers 45, 669-676. [Google Scholar]
- 46.Schweitzer-Stenner, R., Eker, F., Griebenow, K., Cao, X. & Nafie, L. (2004) J. Am. Chem. Soc. 126, 2768-2776. [DOI] [PubMed] [Google Scholar]
- 47.McColl, I. H., Blanch, E. W., Hecht, L., Kallenbach, N. R. & Barron, L. D. (2004) J. Am. Chem. Soc. 126, 5076-5077. [DOI] [PubMed] [Google Scholar]