

Abstract
Aim
This study evaluated the influence of CYP2C19 polymorphisms on the pharmacokinetics of nelfinavir and its metabolite M8 in patients with pancreatic cancer.
Methods
Nelfinavir was administered orally to patients for over 10 days. The plasma concentrations of nelfinavir and M8 were measured by HPLC. The genotypes of CYP2C19*1, CYP2C19*2 and CYP2C19*3 were determined by the polymerase chain reaction-restriction fragment length polymorphism method.
Results
Pharmacokinetic profiles of nelfinavir and M8 were characterized by wide interindividual variability. The mean Cmax of nelfinavir in CYP2C19*1/*1 patients was 3.89 ± 0.40 (n = 3) and 5.12 ± 0.41 (n = 30) µg ml–1, while that of CYP2C19*1/*2 patients was 3.60 (n = 1) and 6.14 ± 0.31 (n = 5) µg ml–1 at the doses of 625 and 1250 mg nelfinavir twice daily, respectively. For the M8 metabolite, the mean Cmax of CYP2C19*1/*1 patients was 1.06 ± 0.06 (n = 3) and 1.58 ± 0.27 (n = 30) µg ml–1, while those of CYP2C19*1/*2 patients were 1.01 (n = 1) and 1.23 ± 0.15 (n = 5) µg ml–1 at the doses of 625 and 1250 mg nelfinavir twice daily, respectively. The area under the plasma concentration–time curve (AUC(0,12 h)) values of nelfinavir for CYP2C19*1/*1 patients were 28.90 ± 1.27 and 38.90 ± 4.99 µg ml–1·h and for CYP2C19*1/*2 patients, AUC(0,12 h) was 28.20 (n = 1) and 40.22 ± 3.17 (n = 5) µg ml–1·h at the doses of 625 and 1250 mg nelfinavir twice daily, respectively. The Cmax of nelfinavir was significantly higher (P <0.05) in CYP2C19*1/*2 patients but there was no statistical difference in AUC(0,12 h).
Conclusion
CYP2C19*1/*2 genotype modestly affected the pharmacokinetic profiles of nelfinavir and M8 in patients with locally advanced pancreatic cancer.
Keywords: CYP2C19, genotype, metabolite, nelfinavir, pharmacokinetics
What is Already Known about this Subject
The impact of CYP2C19 polymorphism on pharmacokinetics of nelfinavir and M8 was studied on HIV-positive patients and healthy volunteers.
CYP2C19 mutation enhanced the exposure of nelfinavir and reduced the exposure of M8.
What this Study Adds
The heterozygous CYP2C19 *1/*2 mildly elevates the systemic exposure of nelfinavir in the pancreatic cancer patients.
The metabolic ratio was found to be lower in patients carrying CYP2C19 *1/*2 allele than those with wild-type CYP2C19.
Introduction
Approximately 37 000 individual in the United States develop pancreatic cancer each year and almost an equal number of patients die from the disease 1. The overall 5 year survival is less than 5%. Even in patients who undergo curative surgery, 5 year survival has not exceeded 20%. Combined chemotherapy and radiotherapy have been widely used as an adjunct to treat pancreatic cancer before or after surgery, or as definitive treatment for unresectable locally advanced disease 2–4. The standard of care is gemcitabine-based chemotherapy combined with radiotherapy 5. Unfortunately, the advantages of such chemo-radiotherapy in patients with pancreatic cancer are limited due to the rapid onset of radioresistance.
Overexpression of EFGR and KRAS mutations are frequent molecular alterations in pancreatic cancer, both of which lead to constitutive PI3K/Akt signaling, a common mediator of radioresistance 6,7. In preclinical studies, activation of the PI3K/Akt pathway has been shown to induce resistance to radiation in tumour cells 6,8. Conversely, inhibition of this pathway has been shown to radiosensitize various types of cancer cells 9,10. There has also been increase in gemcitabine-induced apoptosis in chemoresistant locally advanced pancreatic cancer when this pathway was inhibited 11.
Nelfinavir is a potent HIV protease inhibitor approved by the Food and Drug Administration for the treatment of HIV infection. Interestingly, nelfinavir has also been shown to block Akt signalling and sensitize tumour cells to radiotherapy in murine tumour models 12. The radiosensitizing effect of nelfinavir is at least in part owing to the down regulation of hypoxia-inducible factor 1α and VEGF expression, which results in increased tumor oxygenation 13. Nelfinavir has been evaluated in patients with solid tumours as a radiosensitizer 14–17.
The pharmacokinetics of nelfinavir have been previously studied in HIV-positive patients and healthy volunteers. Nelfinavir is extensively metabolized in the liver by cytochrome P450 2C19 (CYP2C19) to its major metabolite M8 18,19. Genetic polymorphisms that create an aberrant splice site and a premature stop codon in CYP2C19 confer a poor metabolizer phenotype 20,21. CYP2C19 polymorphism shows marked interracial heterogeneity, with the poor metabolizer phenotype representing 2 to 5% of Caucasian and 13 to 23% of Asian populations. Two defective CYP2C19 alleles, CYP2C19*2 and CYP2C19*3, have been described to account for about 87% of Caucasian and about 99% of Oriental poor metabolizer alleles 22,23.
A phase 1 study was conducted using hypofractionated stereotactic radiotherapy and concurrent nelfinavir as a radiosensitizer in patients with locally advanced pancreatic cancer that were considered to be unresectable or borderline resectable. The neoadjuvant regimen consisted of gemcitabine and 5-fluorouracil (5-FU). This was based on our previous findings that the sequential administration of gemcitabine followed by 5-FU resulted in synergistic cytotoxicity in tumour cells 24. Stereotactic radiation is designed to deliver higher daily dose fractions over a short time frame to the tumour tissue with a narrow margin to maximize radiation damage to the tumour, while minimizing radiation toxicity to normal tissues. The objective of the current work was to characterize the influence of CYP2C19 genotypes on the pharmacokinetics of nelfinavir in patients with pancreatic cancer undergoing chemo-radiotherapy.
Methods
Patient selection
Eligibility for recruitment was from patients with an initial diagnosis of locally advanced pancreatic carcinoma who were being treated at the University of Nebraska Medical Center (UNMC). This study had the approval of the Institutional Review Board (IRB#:441-07-FB), UNMC. All patients gave written informed consent.
Treatment plan
Patients initially received 750 (females) or 900 (males) mg m–2 gemcitabine i.v. over 30 min, 50 mg m–2 leucovorin i.v. over 30 min and 2700 mg m–2 5-FU IV over 24 h on day 1 weekly for 2 of 3 weeks for three cycles (days 1–63). Oral nelfinavir was given at 625 mg or 1250 mg twice daily for 3 weeks starting 2 weeks prior to initiation of radiation (days 56–75). We chose 625 mg as a low dose because this dose has been shown to be better tolerated and preferred by patients. We chose 1250 mg as a high dose because the standard dose of nelfinavir in HIV patients is 1250 mg twice daily given orally. The drugs required for the study were obtained from commercial sources. Because the duration of nelfinavir therapy was limited, there was no planned dose modification for grade 1–2 toxicities attributed to nelfinavir. In the event of grade 3 or worse toxicity attributed to nelfinavir, the drug was withheld until the toxicity was grade 2 or less in severity, then the drug was resumed at 625 mg oral administration daily or 625 mg orally twice daily. Participants were instructed to take nelfinavir with food. The study was conducted in compliance with the ethical principles and in compliance with local laws and regulations.
Pharmacokinetic studies
After patients had received at least 10 days of nelfinavir, serial blood samples were collected at the following time points during steady-state: 0 h (to measure the trough concentration) and after nelfinavir dosing: 1, 2, 3, 4, 5, 6, 8 and 12 h (the latter prior to the next planned dose of nelfinavir) on the twice daily regimen. Blood was collected into 10 ml green-top tubes (BD Franklin Lakes, NJ) containing sodium heparin. The collected heparinized blood was placed on ice immediately. The tube was centrifuged for 10 min at 800 × g at 4 °C. Plasma was removed from the tube, placed in a labelled cryovial in 1.8 ml aliquots, and frozen at −80 °C until the time of analysis. A total of 351 samples from 39 patients were collected for pharmacokinetic analysis so that there were on average approximately nine samples per patient.
Quantification of nelfinavir and M8 concentrations was performed using a Waters HPLC system consisting of a 2695 pump, an autosampler and a 996 photodiode array detector (Milford, MA, USA). Chromatographic separation was obtained by isocratic conditions at room temperature on an analytical C8 Nova Pak column (250 × 3.9 mm; 3.0 µm). The mobile phase contained 20 m m acetate buffer: acetonitrile (54.7: 45.3, v/v) at pH 4.88 25. The u.v. spectrum was monitored at 255 nm for the detection of nelfinavir and M8 and at 268 nm for the detection of the internal standard amprenavir. The flow rate was 1 ml min–1. A standard curve was generated for every analytical run.
Stock solutions of nelfinavir, its M8 metabolite and amprenavir (internal standard) were prepared by dissolving weighed amounts in 2 ml glass vials in methanol, separately. The solutions were stored in −20 °C. For the preparation of calibration standards, working solutions of nelfinavir, M8 and amprenavir were prepared by diluting appropriate volumes of the stock solutions in methanol. Calibration concentrations of 0.1562–10 µg ml–1 for nelfinavir and M8 were obtained by spiking human blank plasma. Calibration standards were prepared daily with each new batch of samples and added to blank plasma, while quality control samples were prepared in plasma, divided in small aliquots and stored at −20 °C until use. Individual primary methanol stock solutions of nelfinavir, M8 and amprenavir were prepared at concentrations high enough so that when combined, a secondary dilution of each in 1 ml volume of methanol resulted in a free base concentration of 200 µg ml–1. This standard was non-serially diluted to concentrations of 100, 50, 25, 12.5, 6.25, 3.125, 1.532 µg ml–1. A 20 µl addition of each of these solutions to 180 µl of human bank plasma resulted in a standard curve with concentrations of 10, 5, 2.5, 1.25, 0.625, 0.3125 and 0.1532 µg ml–1. Calibration curves were fitted by least squares linear regression analysis using 1/concentration2 as the weighting factor.
On the day of analysis, patients’ plasma was thawed at room temperature. A 0.2 ml patient plasma sample was taken in 2 ml Eppendorf tube, spiked with the internal standard, mixed with 0.3 ml of the precipitating solvent, a mixture of acetonitrile and 0.1 m orthophosphoric acid (80% : 20% v/v). It was vortex-mixed for 30 s, incubated on ice for 10 min and again vortexed for 30 s. The mixture was centrifuged at 12 000 rev min–1 for 10 min in a refrigerated microcentrifuge at 4 °C. The supernatant was transferred to a borosilicate glass tube and evaporated in a Zymark TurboVap® evaporator to dryness with the flow of nitrogen for 40 min at 40 °C, and the residue was re-suspended in a 200 µl mixture of acetonitrile and 0.1 m orthophosphoric acid (80% : 20% v/v). It was filtered through 0.2 μ syringe filter into a labeled autosampler tube and 20 µl was injected. The current HPLC-u.v. assay method has certain advantages over other reported assays for the quantification of nelfinavir and the M8 metabolite. The sample preparation is simple, utilizing an efficient rapid liquid–liquid extraction. The assay is entirely isocratic involving only two stable solvent components with low volatility, a pH adjusted acetate buffer solution and acetonitrile. The background blank baseline is clear with little interference from endogeneous peaks. In addition, the equilibration is rapid, absorbance at 255 nm is transparent and the run time is less than 20 min. Non-compartmental analysis was performed to obtain pharmacokinetic parameters of nelfinavir and M8 including the elimination half-life (t1/2), the total body clearance (CLT/F) and the apparent volume of distribution (VD/F) using WinNonlin Pro version 1.5 (Pharsight Corporation, Mountain View, CA, USA).
Pharmacogenetic studies
Venous blood (20 ml) was collected for pharmacogenetic analysis. Genomic DNA was isolated from the buffy coat using the QIAamp 96 DNA Blood Kit (Qiagen, Valencia, CA, USA) as per manufacturer’s instructions. Genotyping and polymerase chain reaction-restriction fragment length polymorphism (PCR-RFLP) conditions were performed as previously described by Goldstein & Blaisdell 26. The primers used for amplification of CYP2C19 exon 5 were forward 5´-CAGAGCTTGGCATATTGTATC-3´ and reverse 5´-GTAAACACACAACTAGTCAATG-3´. The primers used for the amplification of CYP2C19 exon 4 were forward 5´-AAATTGTTTCCAATCATTTAGCT-3´ and reverse 5´- ACTTCAGGGCTTGGTCAATA-3´. A mixture of 2 µl 10 × PCR buffer (Fisher BioReagents®), 0.8 µl 2.5 m m deoxyneocleotide triphosphate, 1.6 µl 25 m m magnesium chloride, 0.5 µl each of forward and reverse primer (10 pmol µl–1), 40 ng genomic DNA, 0.1 µl Taq polymerase (5 U µl–1) and sterile water to a final volume of 20 µl were used. The PCR settings were as follows: step 1, 94 °C for 5 min, step 2, 94 °C for 20 s, step 3, 53 °C for 10 s and step 4, 72 °C for 10 s. Steps 2 to 4 were repeated for 37 cycles, followed by 72 °C for 5 min. To detect the CYP2C19*2 allele, Sma I restriction enzyme was used and to detect the CYP2C19*3 allele, BamH I restriction enzyme was used. Following addition of the respective restriction enzyme to the PCR product, the reaction was incubated at 37 °C overnight. The stop buffer containing EDTA, glycerol and bromophenol blue was added to both reactions and analyzed by gel electrophoresis on 3% agarose gel. After ethidium bromide staining of the gel, the sizes of the digested DNA fragments were determined by manual visualization.
Statistical analysis
Student’s unpaired t-test was used to compare the mean values of individual groups. A P value <0.05 was considered as statistically significant.
Results
Demography of the patients
Demographic details of patients in this study are summarized in Table1. A total of 39 patients were enrolled in this study between December 2008 and June 2013. Among them, 97.4% were Caucasian White and 2.6% were Native American. There were 59% male patients and 41% female patients. The mean age of these patients was 61 years old ranging from 39 to 79 years old. All of these patients were genotyped for CYP2C19. There were 84.6% wild-type CYP2C19*1/*1 and 15.4% were as heterozygous CYP2C19*1/*2.
Table 1.
The demography of the enrolled patients
| Patients | CYP2C19 | CYP2C19 | 625 mg | 1250 mg | |
|---|---|---|---|---|---|
| Characteristics | All | *1/*1 | *1/*2 | twice daily | twice daily |
| Number of patients | 39 | 33 | 6 | 4 | 35 |
| Gender | |||||
| Male | 23 | 21 | 2 | 2 | 21 |
| Female | 16 | 12 | 4 | 2 | 14 |
| Age (years) | |||||
| Mean | 61 | 61 | 61 | 67 | 61 |
| Range | 34−79 | 34-79 | 48-76 | 60−71 | 34−79 |
| Race | |||||
| Caucasian White | 38 | 32 | 6 | 4 | 34 |
| Native American | 1 | 1 | 0 | 0 | 1 |
HPLC methodology development and validation
We developed an HPLC-u.v. assay for the simultaneous determination of nelfinavir and its M8 metabolite in human plasma samples, using amprenavir as an internal standard. The molecular structures of nelfinavir, its metabolite M8 and amprenavir are shown in Figure 1. The retention time of amprenavir, the M8 metabolite and nelfinavir were 3.2 ± 0.28, 6.3 ± 0.35 and 16.1 ± 0.58 min, respectively. The elution time of each drug analyte varied slightly from assay to assay and was attributed to column wear and daily mobile phase buffer preparations. This shift was more evident in the retention times of the M8 metabolite and nelfinavir, but never exceeded ± 1 min.
Figure 1.
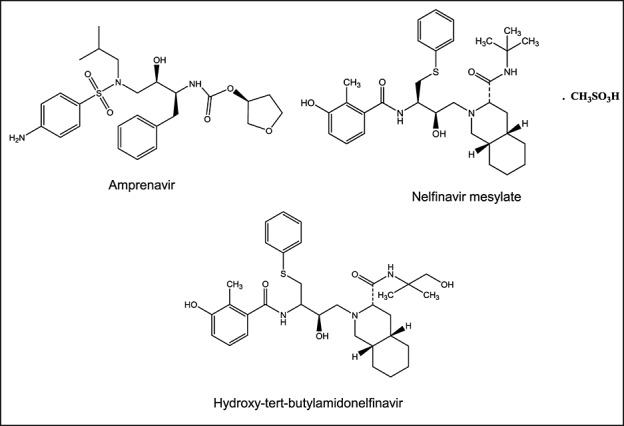
Chemical structures of nelfinavir, M8 and the internal standard
The calibration curves of nelfinavir and its metabolite were linear in the calibration range of 0.3125–5 µg ml–1. Linear slope and intercept parameters were determined for 12 calibration curves which were 0.3504 ± 0.09 for M8 and 0.9157 ± 0.07 for nelfinavir. The correlation coefficients (r2) of the calibration curves of nelfinavir and the M8 metabolite were ≥0.99 as determined by least square analysis over a concentration range of 0.3125–5 µg ml–1. Within this range, the calibration curves of nelfinavir and metabolites were linear using the F test for lack-of-fit as an indicator of linearity for each regression model.
The limit of quantification i.e. the lowest plasma concentration level that could be accurately and reproducibly quantified was validated at 0.3125 µg ml–1. The assay was validated for day-to-day variability by analyzing five concentrations of metabolite M8 and nelfinavir on 3 separate days over six separate assay runs. Precision was expressed as the % coefficient of variation. The method proved to be accurate and precise at five concentrations of both the M8 metabolite and nelfinavir. The between-day precision ranged from 0.64–4.3% for M8 metabolites and 0.76–3.59% for nelfinavir. Within-day precision for M8 metabolites and nelfinavir ranged from 1.44–4.36% and 3.04–5.41%, respectively (n = 6). At the lower level of the calibration curves, relative standard deviation was 3.59% for metabolites and 3.14 % for nelfinavir. The accuracy ranged from 87.09–93.55% and 86.82–90.93% for M8 and nelfinavir, respectively. The mean calculated recoveries for the M8 metabolite were 86%, 85%, 83%, 82% and 79% for the concentrations 5, 2.5, 1.25, 0.625 and 0.3125 µg ml–1, respectively. Similarly, the mean extraction recoveries for nelfinavir were 87%, 87%, 84%, 82% and 82% for 5, 2.5, 1.25, 0.625 and 0.3125 µg ml–1, respectively. Validation of the assay was performed in accordance with the FDA guidance for industry on bioanalytical methods validation and the European Medicines Agency guideline on bioanalytical method validation.
PCR-RFLP
The PCR amplification of exon 5 yielded a single product of 321 base pair (bp) which were digested completely to two smaller bands at 109 bp and 212 bp by Sma I in individuals with homozygous CYP2C19*1/*1 genotype. By contrast, 15% of patients in the study showed 3 bands upon digestion with Sma I at 321 bp, 212 bp and 109 bp, indicating that they have the CYP2C19*1/*2 genotype. Their 321 bp fragment was digested partially by Sma I to a 212 bp and 109 bp fragments. All other patients showed complete digestion of their 321 bp fragment resulting in two bands only at 212 bp and 109 bp. The PCR amplification of exon 4 yielded a single product of 271 bp. When digested with BamH I, the samples from all patients showed complete digestion to form two bands at 175 bp and 96 bp, indicating that no CYP2C19*3 allele was present. In this study, 85% of patients were homozygous CYP2C19 *1/*1 and 15% were heterozygous CYP2C19*1/*2.
Influence of the CYP2C19*2 variant on the pharmacokinetics of nelfinavir
At the time of study, subjects were taking nelfinavir 625 mg or 1250 mg orally twice daily for at least 10 days. The mean plasma concentration–time profiles of nelfinavir and its metabolite M8 are shown in Figure 2. Pharmacokinetic profiles of nelfinavir and its M8 metabolite were characterized by wide interindividual variability. CYP2C19 polymorphism affected the pharmacokinetic profiles of nelfinavir and its metabolite M8 in patients with locally advanced pancreatic cancer, but the differences appeared to be incremental between the wild-type *1/*1 and heterozygous *1/*2 genotypes. The pharmacokinetic parameters of nelfinavir and its metabolite M8 are presented in Tables2 and 3. The Cmax and AUC(0,12 h) of nelfinavir and its metabolite M8 in individual patients and the means are shown in Figures 3 and 4. For patients with wild-type CYP2C19 (*1/*1 alleles) receiving 1250 mg (n = 30) nelfinavir twice daily, the mean Cmax and AUC(0,12 h) of nelfinavir were 5.12 ± 0.41 µg ml–1 and 38.90 ± 4.99 µg ml–1·h, respectively, whereas for patients with heterozygous CYP2C19 *1/*2 alleles (n = 5), the mean Cmax and AUC(0,12 h) of nelfinavir were 6.14 ± 0.31 µg ml–1 and 40.22 ± 3.17 µg ml–1·h, respectively. While Cmax was significantly higher (P < 0.05) in heterozygous CYP2C19 *1/*2 patients, there was no statistical difference in AUC(0,12 h) values. t1/2, e, CLT/F and VD/F of nelfinavir were not significantly influenced by the genotype of CYP2C19.
Figure 2.
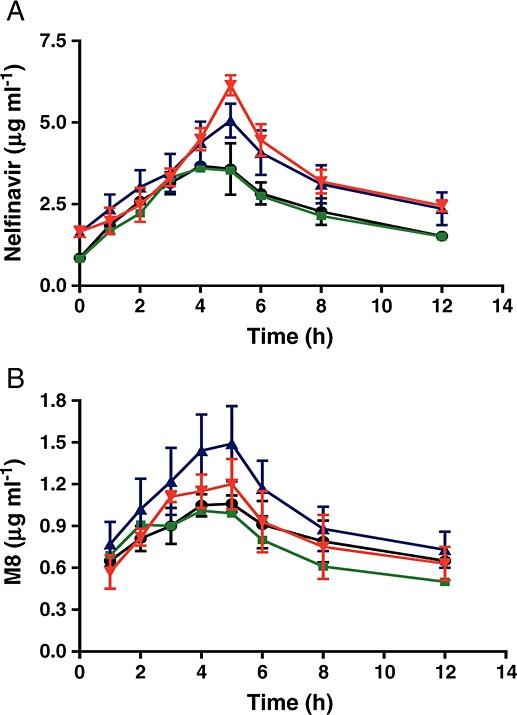
Influence of CYP2C19 polymorphism on the mean concentration–time profiles of nelfinavir and its metabolite M8 after oral administration of nelfinavir twice daily at the dose of 625 mg and 1250 mg in patients with locally advanced pancreatic cancer.  1250 mg twice daily, CYP2C19*1/*2;
  1250 mg twice daily, CYP2C19*1/*1;
  625 mg twice daily, CYP2C19*1/*2;
  625 mg twice daily, CYP2C19*1/*1
Table 2.
The influence of CYP2C19 polymorphism on the pharmacokinetics of nelfinavir
| Low dose (625 mg twice daily) | Normal dose (1250 mg twice daily) | |||
|---|---|---|---|---|
| *1/*1 | *1/*2 | *1/*1 | *1/*2 | |
| Parameters | (n = 3) | (n = 1) | (n = 30) | (n = 5) |
| Cmax (µg ml–1) | 3.89 ± 0.40 | 3.60 | 5.12 ± 0.41 | 6.14 ± 0.31 |
| tmax (h) | 4.33 ± 0.58 | 4.00 | 4.93 ± 0.37 | 5.00 ± 0.00 |
| t1/2,e (h) | 7.48 ± 2.13 | 7.07 | 8.10 ± 2.85 | 6.87 ± 0.67 |
| AUC(0,12 h) (µg ml–1·h) | 28.90 ± 1.27 | 28.20 | 38.90 ± 4.99 | 40.22 ± 3.17 |
| CLT/F (l kg–1 h–1) | 0.34 ± 0.07 | 0.32 | 0.41 ± 0.12 | 0.43 ± 0.14 |
| VD/F (l kg–1) | 3.48 ± 0.40 | 3.23 | 4.63 ± 1.89 | 5.02 ± 2.99 |
AUC(0,12 h), area under the concentration plotted against time curve from time zero to 12 h; Cmax, highest observed plasma drug concentration;
tmax, time to reach the maximum plasma concentration;
t1/2,e, elimination half-life;
VD/F, apparent volume of distribution;
CLT/F, apparent total body clearance.
Table 3.
The influence of CYP2C19 polymorphism on the pharmacokinetics of M8
| Low dose (625 mg twice daily) | Normal dose (1250 mg twice daily) | |||
|---|---|---|---|---|
| *1/*1 | *1/*2 | *1/*1 | *1/*2 | |
| Parameters | (n = 3) | (n = 1) | (n = 30) | (n = 5) |
| Cmax (µg ml–1) | 1.06 ± 0.06 | 1.01 | 1.58 ± 0.27 | 1.23 ± 0.15 |
| tmax (h) | 4.67 ± 0.58 | 4.00 | 4.73 ± 0.52 | 5.00 ± 0.41 |
| t1/2, e (h) | 9.24 ± 1.02 | 7.52 | 9.79 ± 3.26 | 11.75 ± 5.12 |
| AUC(0,12 h) (µg ml–1·h) | 9.48 ± 0.99 | 8.53 | 11.59 ± 1.66 | 9.73 ± 1.54 |
| AUC(0,12 h)M8 : AUC(0,12 h)NFV | 0.33 ± 0.05 | 0.30 | 0.31 ± 0.06 | 0.25 ± 0.06 |
AUC(0,12 h), area under the concentration plotted against time curve from time zero to 12 h; Cmax, highest observed plasma drug concentration;
tmax, time to reach the maximum plasma concentration;
t1/2,e, elimination half-life.
Figure 3.
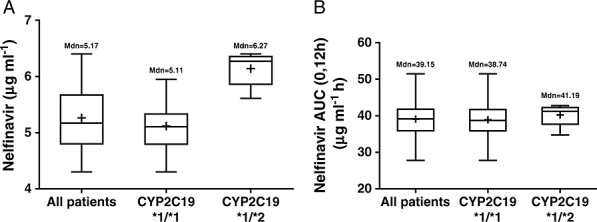
Box-and-whiskers plot showing A) Cmax and B) AUC(0,12 h) of nelfinavir in patients after oral administration of 1250 mg nelfinavir twice daily. Boxes indicate the 25–75th percentile ranges, + sign indicates the mean concentration and the mean AUC(0,12 h) values. The horizontal line in each box corresponds to the median
Figure 4.
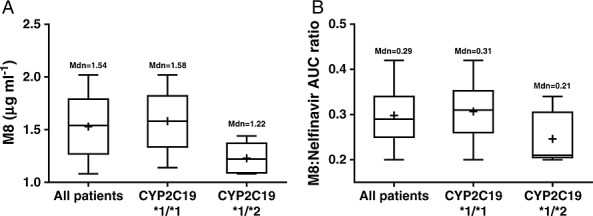
Box-and-whiskers plot showing A) Cmax and B) the metabolic ratio of M8 in patients after oral administration of 1250 mg nelfinavir twice daily. Boxes indicate the 25–75th percentile ranges, + sign indicates mean concentration and mean metabolic ratio of M8 in patients. The horizontal line in each box corresponds to the median
Dose-dependent pharmacokinetics of nelfinavir were noted. In patients carrying wild-type CYP2C19 *1/*1 alleles, doubling the dose from 625 mg (n = 3) to 1250 mg (n = 30) resulted in less than doubled Cmax and AUC(0,12 h) of nelfinavir, indicating non-linear pharmacokinetics and lower oral bioavailability (F) at the higher dose. As the dose increased, the time required to reach the maximum plasma drug concentration (tmax) was significantly prolonged (P< 0.05). There was a trend of increase in CLT/F and VD/F, which may be accounted largely by the decrease in F at the higher dose.
In patients with wild-type CYP2C19 *1/*1 alleles, the mean Cmax and AUC(0,12 h) of M8 were 1.06 ± 0.6 µg ml–1 and 9.48 ± 0.99 µg ml–1 h at the dose of 625 mg (n = 3) nelfinavir twice daily and 1.58 ± 0.27 µg ml–1 and 11.59 ± 1.66 µg ml–1 h at the dose of 1250 mg (n = 30) nelfinavir twice daily. In patients with heterozygous CYP2C19 *1/*2, the mean Cmax and AUC of M8 were 1.01 µg ml–1 and 8.53 µg ml–1 · h at the dose of 625 mg (n = 1) nelfinavir twice daily, but 1.23 ± 0.15 µg ml–1 and 9.73 ± 1.54 µg ml–1 h at the dose of 1250 mg (n = 5) nelfinavir twice daily. Moreover, as shown in Figure 4, the metabolic ratio, as determined based on the AUC(0,12 h) of M8 and the AUC(0,12 h) of nelfinavir, was significantly lower in patients carrying CYP2C19 *1/*2 alleles than in those with wild-type CYP2C19 (0.24 vs. 0.30, P < 0.05).
Discussion
When the pharmacokinetic properties of nelfinavir were evaluated in healthy volunteers and HIV infected patients, no substantial differences were found between two groups 18. Since its pharmacokinetics have not yet been studied in the context of a neoadjuvant therapy for patients with pancreatic cancer, we evaluated the plasma concentrations of nelfinavir and its metabolite M8, in patients with pancreatic cancer. The CYP2C19 enzyme is involved in metabolism of many drugs such as citalopram, diazepam, and imipramine 27. In this study, we investigated the impact of CYP2C19 genotypes on the pharmacokinetic parameters of nelfinavir. M8 is a major metabolite of nelfinavir catalyzed by CYP2C19, which was previously shown to possess anti-HIV activity similar to nelfinavir in vitro 19. However, its anticancer activity is unknown. The pharmacokinetic profile of M8 was examined in the current study to correlate with the influence of CYP2C19 genotypes on the metabolism of nelfinavir.
This is the first clinical study that investigated the effect of the CYP2C19*2 variant on the pharmacokinetics of nelfinavir in patients with pancreatic cancer. CYP2C19*2 is the most frequently occurring CYP2C19 variant, where a single base substitution (G681A) in exon 5 creates an aberrant splice site and produces a premature stop codon, resulting in a truncated, non-functional protein 20. Among the 39 patients enrolled in the current study who were predominantly Caucasians, there were six patients carrying heterozygous CYP2C19*1/*2 alleles and no CYP2C19*2/*2 homozygote was found. This is in agreement with the literature that the frequency of CYP2C19*1/*2 is far greater than that of CYP2C19*2/*2 (15% vs. 2%). We found that the CYP2C19*1/*2 genotype was associated with the higher Cmax (P <0.05) of nelfinavir and lower Cmax of M8 (P <0.05) in the cancer patients. These findings along with the pharmacokinetic parameters of nelfinavir obtained in the current work are consistent with the results observed in HIV-infected and healthy volunteers 28,29. However, the lack of statistical difference in AUC(0,12 h) of nelfinavir between CYP2C19*1/*1 and CYP2C19*1/*2 suggests that with the doses of nelfinavir used in this study, the activity of the enzyme produced by the heterozygous genotype is sufficient to metabolize nelfinavir to its metabolite despite a defective allele. It also reflects the large interpatient variability. Prior to receiving nelfinavir treatment, the patients also received three cycles of weekly i.v. infusion of gemcitabine and 5-FU. Although these drugs are not known to interfere directly with CYP2C19 activity, they may induce gastrointestinal and/or hepatic toxicities that affect the absorption and/or metabolism of nelfinavir in some patients, which could confound the effect caused by CYP2C19 polymorphism.
A moderate yet statistically significant increase in Cmax (P <0.05) of nelfinavir was observed in patients carrying CYP2C19*1/*2 alleles in the current study. The therapeutic impact of such increase remains to be seen in future clinical trials. The parameters t1/2, e, VD/F and CLT/F of nelfinavir in the studied patients were not significantly affected by the genotype of CYP2C19. These results suggest that heterozygous CYP2C19 *1/*2 mildly elevates the systemic exposure of nelfinavir in the patients with pancreatic cancer. Further, a significantly lower metabolic ratio in patients carrying the CYP2C19*1/*2 alleles than the wild type CYP2C19 indicates that the CYP2C19*1/*2 genotype slows down the biotransformation of nelfinavir to M8 in patients with pancreatic cancer. Nelfinavir has been found to downregulate Akt phosphorylation, hypoxia inducible factor 1α and VEGF expression at 5–10 µ m in vitro 12,13, a concentration range that is achieved in patients taking 1250 mg nelfinavir twice daily. It is conceivable that the CYP2C19*2 allele may be used to stratify patients for better antitumour responses. Indeed, the CYP2C19*2 variant has been correlated with improved anti-HIV efficacy of nelfinavir in HIV-infected patients 30. Future studies with larger patient populations with the inclusion of the homozygous CYP2C19*2/*2 genotype will be required to characterize fully the effect of the CYP2C19*2 variant on nelfinavir pharmacokinetics.
Competing Interests
All authors have completed the Unified Competing Interest form at www.icmje.org/coi_disclosure.pdf and declare the support from Fred and Pamela Buffet Cancer Center at the University of Nebraska Medical Center for the submitted work, no financial relationships with any other organizations that might have an interest in the submitted work in the previous 3 years and no other relationships or activities that could appear to have influenced the submitted work.
This work is supported by the Center for Cancer Experimental Therapeutics/Early Phase Clinical Trials (PK/PD/PG). We would like to thank the Fred and Pamela Buffet Cancer Center at University of Nebraska Medical Center for providing financial support.
References
- Jemal A, Siegel R, Ward E, Hao Y, Xu J, Murray T, Thun MJ. Cancer statistics, 2008. CA Cancer J Clin. 2008;58:71–96. doi: 10.3322/CA.2007.0010. [DOI] [PubMed] [Google Scholar]
- Yeo CJ, Abrams RA, Grochow LB, Sohn TA, Ord SE, Hruban RH, Zahurak ML, Dooley WC, Coleman J, Sauter PK, Pitt HA, Lillemoe KD, Cameron JL. Pancreaticoduodenectomy for pancreatic adenocarcinoma: postoperative adjuvant chemoradiation improves survival. A prospective, single-institution experience. Ann Surg. 1997;225:621. doi: 10.1097/00000658-199705000-00018. 33; discussion 633–6. [DOI] [PMC free article] [PubMed] [Google Scholar]
- Spitz FR, Abbruzzese JL, Lee JE, Pisters PW, Lowy AM, Fenoglio CJ, Cleary KR, Janjan NA, Goswitz MS, Rich TA, Evans DB. Preoperative and postoperative chemoradiation strategies in patients treated with pancreaticoduodenectomy for adenocarcinoma of the pancreas. J Clin Oncol. 1997;15:928–37. doi: 10.1200/JCO.1997.15.3.928. [DOI] [PubMed] [Google Scholar]
- Klinkenbijl JH, Jeekel J, Sahmoud T, van Pel R, Couvreur ML, Veenhof CH, Arnaud JP, Gonzalez DG, de Wit LT, Hennipman A, Wils J. Adjuvant radiotherapy and 5-fluorouracil after curative resection of cancer of the pancreas and periampullary region: phase III trial of the EORTC gastrointestinal tract cancer cooperative group. Ann Surg. 1999;230:776. doi: 10.1097/00000658-199912000-00006. 82; discussion 782–4. [DOI] [PMC free article] [PubMed] [Google Scholar]
- van Tienhoven G, Gouma DJ, Richel DJ. Neoadjuvant chemoradiotherapy has a potential role in pancreatic carcinoma. Ther Adv Med Oncol. 2011;3:27–33. doi: 10.1177/1758834010383150. [DOI] [PMC free article] [PubMed] [Google Scholar]
- Gupta AK, Bakanauskas VJ, Cerniglia GJ, Cheng Y, Bernhard EJ, Muschel RJ, McKenna WG. The Ras radiation resistance pathway. Cancer Res. 2001;61:4278–82. [PubMed] [Google Scholar]
- Morgan MA, Parsels LA, Kollar LE, Normolle DP, Maybaum J, Lawrence TS. The combination of epidermal growth factor receptor inhibitors with gemcitabine and radiation in pancreatic cancer. Clin Cancer Res. 2008;14:5142–9. doi: 10.1158/1078-0432.CCR-07-4072. [DOI] [PMC free article] [PubMed] [Google Scholar]
- Jiang Z, Pore N, Cerniglia GJ, Mick R, Georgescu MM, Bernhard EJ, Hahn SM, Gupta AK, Maity A. Phosphatase and tensin homologue deficiency in glioblastoma confers resistance to radiation and temozolomide that is reversed by the protease inhibitor nelfinavir. Cancer Res. 2007;67:4467–73. doi: 10.1158/0008-5472.CAN-06-3398. [DOI] [PubMed] [Google Scholar]
- Gottschalk AR, Doan A, Nakamura JL, Stokoe D, Haas-Kogan DA. Inhibition of phosphatidylinositol-3-kinase causes increased sensitivity to radiation through a PKB-dependent mechanism. Int J Radiat Oncol Biol Phys. 2005;63:1221–7. doi: 10.1016/j.ijrobp.2005.08.014. [DOI] [PubMed] [Google Scholar]
- Barrera R, Cinta Mane M, Rodriguez JF, Jimenez A. Keratoconjunctivitis sicca and diabetes mellitus in a dog. J Am Vet Med Assoc. 1992;200:1967–8. [PubMed] [Google Scholar]
- Ng SSW, Tsao MS, Chow S, Hedley DW. Inhibition of phosphatidylinositide 3-kinase enhances gemcitabine-induced apoptosis in human pancreatic cancer cells. Cancer Res. 2000;60:5451–5. [PubMed] [Google Scholar]
- Gupta AK, Cerniglia GJ, Mick R, McKenna WG, Muschel RJ. HIV protease inhibitors block Akt signaling and radiosensitize tumor cells both in vitro and in vivo. Cancer Res. 2005;65:8256–65. doi: 10.1158/0008-5472.CAN-05-1220. [DOI] [PubMed] [Google Scholar]
- Pore N, Gupta AK, Cerniglia GJ, Jiang Z, Bernhard EJ, Evans SM, Koch CJ, Hahn SM, Maity A. Nelfinavir down-regulates hypoxia-inducible factor 1alpha and VEGF expression and increases tumor oxygenation: implications for radiotherapy. Cancer Res. 2006;66:9252–9. doi: 10.1158/0008-5472.CAN-06-1239. [DOI] [PubMed] [Google Scholar]
- Buijsen J, Lammering G, Jansen RL, Beets GL, Wals J, Sosef M, Den Boer MO, Leijtens J, Riedl RG, Theys J, Lambin P. Phase I trial of the combination of the Akt inhibitor nelfinavir and chemoradiation for locally advanced rectal cancer. Radiother Oncol. 2013;107:184–8. doi: 10.1016/j.radonc.2013.03.023. [DOI] [PubMed] [Google Scholar]
- Alonso-Basanta M, Fang P, Maity A, Hahn SM, Lustig RA, Dorsey JF. A phase I study of nelfinavir concurrent with temozolomide and radiotherapy in patients with glioblastoma multiforme. J Neurooncol. 2014;116:365–72. doi: 10.1007/s11060-013-1303-3. [DOI] [PMC free article] [PubMed] [Google Scholar]
- Rengan R, Mick R, Pryma D, Rosen MA, Lin LL, Maity AM, Evans TL, Stevenson JP, Langer CJ, Kucharczuk J, Friedberg J, Prendergast S, Sharkoski T, Hahn SM. A phase I trial of the HIV protease inhibitor nelfinavir with concurrent chemoradiotherapy for unresectable stage IIIA/IIIB non-small cell lung cancer: a report of toxicities and clinical response. J Thorac Oncol. 2012;7:709–15. doi: 10.1097/JTO.0b013e3182435aa6. [DOI] [PMC free article] [PubMed] [Google Scholar]
- Brunner TB, Geiger M, Grabenbauer GG, Lang-Welzenbach M, Mantoni TS, Cavallaro A, Sauer R, Hohenberger W, McKenna WG. Phase I trial of the human immunodeficiency virus protease inhibitor nelfinavir and chemoradiation for locally advanced pancreatic cancer. J Clin Oncol. 2008;26:2699–706. doi: 10.1200/JCO.2007.15.2355. [DOI] [PubMed] [Google Scholar]
- Regazzi M, Maserati R, Villani P, Cusato M, Zucchi P, Briganti E, Roda R, Sacchelli L, Gatti F, Delle Foglie P, Nardini G, Fabris P, Mori F, Castelli P, Testa L. Clinical pharmacokinetics of nelfinavir and its metabolite M8 in human immunodeficiency virus (HIV)-positive and HIV-hepatitis C virus-coinfected subjects. Antimicrob Agents Chemother. 2005;49:643–9. doi: 10.1128/AAC.49.2.643-649.2005. [DOI] [PMC free article] [PubMed] [Google Scholar]
- Zhang KE, Wu E, Patick AK, Kerr B, Zorbas M, Lankford A, Kobayashi T, Maeda Y, Shetty B, Webber S. Circulating metabolites of the human immunodeficiency virus protease inhibitor nelfinavir in humans: structural identification, levels in plasma, and antiviral activities. Antimicrob Agents Chemother. 2001;45:1086–93. doi: 10.1128/AAC.45.4.1086-1093.2001. [DOI] [PMC free article] [PubMed] [Google Scholar]
- de Morais SM, Wilkinson GR, Blaisdell J, Nakamura K, Meyer UA, Goldstein JA. The major genetic defect responsible for the polymorphism of S-mephenytoin metabolism in humans. J Biol Chem. 1994;269:15419–22. [PubMed] [Google Scholar]
- De Morais SM, Wilkinson GR, Blaisdell J, Meyer UA, Nakamura K, Goldstein JA. Identification of a new genetic defect responsible for the polymorphism of (S)-mephenytoin metabolism in Japanese. Mol Pharmacol. 1994;46:594–8. [PubMed] [Google Scholar]
- Zhang YA, Reviriego J, Lou YQ, Sjoqvist F, Bertilsson L. Diazepam metabolism in native Chinese poor and extensive hydroxylators of S-mephenytoin: interethnic differences in comparison with white subjects. Clin Pharmacol Ther. 1990;48:496–502. doi: 10.1038/clpt.1990.185. [DOI] [PubMed] [Google Scholar]
- Ferguson RJ, De Morais SM, Benhamou S, Bouchardy C, Blaisdell J, Ibeanu G, Wilkinson GR, Sarich TC, Wright JM, Dayer P, Goldstein JA. A new genetic defect in human CYP2C19: mutation of the initiation codon is responsible for poor metabolism of S-mephenytoin. J Pharmacol Exp Ther. 1998;284:356–61. [PubMed] [Google Scholar]
- Ren Q, Kao V, Grem JL. Cytotoxicity and DNA fragmentation associated with sequential gemcitabine and 5-fluoro-2’-deoxyuridine in HT-29 colon cancer cells. Clin Cancer Res. 1998;4:2811–8. [PubMed] [Google Scholar]
- Kiser JJ, Rutstein RM, Samson P, Graham B, Aldrovandi G, Mofenson LM, Smith E, Schnittman S, Fenton T, Brundage RC, Fletcher CV. Atazanavir and atazanavir/ritonavir pharmacokinetics in HIV-infected infants, children, and adolescents. AIDS. 2011;25:1489–96. doi: 10.1097/QAD.0b013e328348fc41. [DOI] [PMC free article] [PubMed] [Google Scholar]
- Goldstein JA, Blaisdell J. Genetic tests which identify the principal defects in CYP2C19 responsible for the polymorphism in mephenytoin metabolism. Methods Enzymol. 1996;272:210–8. doi: 10.1016/s0076-6879(96)72025-6. [DOI] [PubMed] [Google Scholar]
- Poolsup N, Li Wan Po A, Knight TL. Pharmacogenetics and psychopharmacotherapy. J Clin Pharm Ther. 2000;25:197–220. doi: 10.1046/j.1365-2710.2000.00281.x. [DOI] [PubMed] [Google Scholar]
- Damle BD, Uderman H, Biswas P, Crownover P, Lin C, Glue P. Influence of CYP2C19 polymorphism on the pharmacokinetics of nelfinavir and its active metabolite. Br J Clin Pharmacol. 2009;68:682–9. doi: 10.1111/j.1365-2125.2009.03499.x. [DOI] [PMC free article] [PubMed] [Google Scholar]
- Khaliq Y, Gallicano K, Seguin I, Fyke K, Carignan G, Bulman D, Badley A, Cameron DW. Single and multiple dose pharmacokinetics of nelfinavir and CYP2C19 activity in human immunodeficiency virus-infected patients with chronic liver disease. Br J Clin Pharmacol. 2000;50:108–15. doi: 10.1046/j.1365-2125.2000.00238.x. [DOI] [PMC free article] [PubMed] [Google Scholar]
- Saitoh A, Capparelli E, Aweeka F, Sarles E, Singh KK, Kovacs A, Burchett SK, Wiznia A, Nachman S, Fenton T, Spector SA. CYP2C19 genetic variants affect nelfinavir pharmacokinetics and virologic response in HIV-1-infected children receiving highly active antiretroviral therapy. J Acquir Immune Defic Syndr. 2010;54:285–9. doi: 10.1097/QAI.0b013e3181bf648a. [DOI] [PMC free article] [PubMed] [Google Scholar]