

ABSTRACT
Adaptation is a common theme in both pathogen emergence, for example, in zoonotic cross-species transmission, and pathogen control, where adaptation might limit the effect of the immune response and antiviral treatment. When such evolution requires deleterious intermediate mutations, fitness ridges and valleys arise in the pathogen's fitness landscape. The effect of deleterious intermediate mutations on within-host pathogen adaptation is examined with deterministic calculations, appropriate for pathogens replicating in large populations with high error rates. The effect of deleterious intermediate mutations on pathogen adaptation is smaller than their name might suggest: when two mutations are required and each individual single mutation is fully deleterious, the pathogen can jump across the fitness valley by obtaining two mutations at once, leading to a proportion of adapted mutants that is 20-fold lower than that in the situation where the fitness of all mutants is neutral. The negative effects of deleterious intermediates are typically substantially smaller and outweighed by the fitness advantages of the adapted mutant. Moreover, requiring a specific mutation order has a substantially smaller effect on pathogen adaptation than the effect of all intermediates being deleterious. These results can be rationalized when the number of routes of mutation available to the pathogen is calculated, providing a simple approach to estimate the effect of deleterious mutations. The calculations discussed here are applicable when the effect of deleterious mutations on the within-host adaptation of pathogens is assessed, for example, in the context of zoonotic emergence, antigenic escape, and drug resistance.
IMPORTANCE Adaptation is critical for pathogens after zoonotic transmission into a new host species or to achieve antigenic immune escape and drug resistance. Using a deterministic approach, the effects of deleterious intermediate mutations on pathogen adaptation were calculated while avoiding commonly made simplifications that do not apply to large pathogen populations replicating with high mutation rates. Perhaps unexpectedly, pathogen adaptation does not halt when the intermediate mutations are fully deleterious. The negative effects of deleterious mutations are substantially outweighed by the fitness gains of adaptation. To gain an understanding of the effect of deleterious mutations on pathogen adaptation, a simple approach that counts the number of routes available to the pathogen with and without deleterious intermediate mutations is introduced. This methodology enables a straightforward calculation of the proportion of the pathogen population that will cross a fitness valley or traverse a fitness ridge, without reverting to more complicated mathematical models.
INTRODUCTION
The fitness landscape of a pathogen is likely to have a rugged shape and consist of multiple optima. Reductions in fitness occur when underlying combinations of genetic mutations lead to an unfit or deleterious phenotype, creating depressions in the fitness landscape. One phenomenon causing sharp peaks and troughs in the fitness landscape is sign epistasis, where a beneficial adaptation involves a combination of individually deleterious mutations (1–5). In the case where mutants with intermediate mutations are less fit than the wild-type and adapted viruses, a fitness valley, a barrier of disadvantageous mutations hampering the access to other landscape regions, is created (4, 6). If there is a specific order in which mutations can occur without compromising fitness, for example, where compensatory or obligatory comutations can remove the deleterious effect of another mutation, the landscape contains a fitness ridge. Such fitness valleys and ridges are commonplace in virology, as will be illustrated with examples drawn from the influenza virus field.
During zoonotic overspill infections of an avian influenza virus into humans, pressure exists for the pathogen to adapt to this possible new host (7–9). The virus was fit in its original host and needs to be fit in the new host, but this adaptation process might require deleterious intermediate mutations. The need for adaptation of a zoonotic pathogen is illustrated by the requirement of a combination of mutations in avian influenza A/H5N1 virus for airborne transmission between mammals (10, 11). Interestingly, two of the mutations that were found to be necessary to confer airborne transmissibility, polymerase basic protein 2 (PB2) E627K and polymerase basic protein 1 (PB1) H99Y (11, 12), increased the fitness of the adapted virus if both mutations occurred together, as inferred from the substantially larger plaque sizes of the double mutant virus than the wild type, yet each individual mutation decreased the fitness compared to that of the wild-type virus (12). Similarly, Imai et al. showed that the receptor-binding mutations N224K and Q226L in the hemagglutinin (HA) gene, required for an airborne transmissible phenotype of influenza A/H5N1 virus, reduced the stability of HA but could be compensated for by mutation T318I in the HA stalk, which restored protein stability (10). Although the stabilizing mutation was not essential for virus survival, it did substantially increase viral fitness.
Another example of deleterious intermediate mutations is escape from preexisting host immunity through fitness-decreasing mutations for antigenically variable pathogens (13, 14). For example, the altered receptor-binding avidity and lower replication resulting from the antigenic escape mutation HA K165E in A/Puerto Rico/8/1934 (H1N1) could be compensated for by mutations in HA or the neuraminidase (NA) (15, 16), and stabilizing mutations were required to occur prior to the introduction of immune-escape mutations in influenza A/H3N2 virus (17). Similarly, there are numerous examples where antiviral resistance-conferring mutations come at a fitness cost for the virus but can be compensated for by other mutations: several neuraminidase substitutions can occur and have occurred as either permissive or compensatory mutations to counteract the adverse fitness effects of the oseltamivir resistance mutation NA H275Y in influenza A/H1N1 virus (18–20), and similarly, the I222V NA mutation in influenza A/H3N2 virus partially restored the viral fitness-decreasing oseltamivir resistance mutation NA E119V (21).
The name “deleterious mutation” may suggest that the existence of such mutations is unlikely, and thus, the expectation is that the crossing of a fitness valley comprised of individually deleterious mutations is difficult, if not impossible. Indeed, when evolution is described as an adaptive walk or directed evolution, adaptation consists of a series of incrementally neutral or beneficial mutations, and the crossing of the fitness valley would be technically impossible (22–26). Also, the possibility of obtaining several mutations at once to jump across a fitness valley is not considered in some theoretical models (27–29). A methodological framework that is frequently used to study pathogen evolution and that makes such assumptions is the strong selection-weak mutation (SSWM) approximation (30, 31). Models using the SSWM assumption describe the evolutionary trajectory of a population where selective sweeps cause the sequential fixation of advantageous mutations, while deleterious or neutral mutations are disregarded (32–34).
Here, I demonstrate on the basis of a simple and appropriate deterministic model of within-host pathogen evolution how pathogens replicating in large populations with high error rates, such as RNA viruses, can cross fitness valleys. Instead of following the evolution of a pathogen population toward fixation of certain mutations, for example, as is done in SSWM models, I calculate the probability that a virion randomly drawn from the within-host virus population after initial infection with a single genotype will obtain a set of mutations after a given number of replication rounds. This probability, when multiplied by the pathogen population size, gives the expected number of virions with this specific set of mutations. In other words, the probability is directly related to the proportion of viruses in the total within-host population with this set of mutations.
This probability that a virion will have a set of mutations is highly relevant, because increased proportions are likely to correspond to an increased probability of spread of such mutants. When the bottleneck of transmission is narrow, for example, in the case where a single virion is transmitted to the next host, the probability describes the likelihood that infection of the next host will begin with the adapted virus. Alternatively, if the bottleneck is wide, the expected proportion of adapted virus at the start of the infection of the next host can be calculated and used to estimate the chances of further adaptation.
In this report, I calculate the effects of deleterious mutations, fitness valleys, and fitness ridges on within-host pathogen evolution using a straightforward deterministic model (35, 36). Such a deterministic probability calculation is appropriate for studying the dynamics and evolution of large populations with asexual reproduction and a high mutation rate, such as most RNA viruses, because stochastic effects play a limited role. The proportion of the population comprising the adapted mutant is calculated for various valley depths (i.e., the fitness cost of the mutant) and breadths (i.e., the number of deleterious mutations). Finally, I also describe the probability that a fitness ridge will be traversed for various numbers of mutations that need to be acquired in order.
MATERIALS AND METHODS
The within-host population dynamics of virus mutants were calculated as deterministic probabilities on the basis of the methodology described previously (35, 36). In this calculation, the errors made by the virus polymerase are represented by an error rate and introduce mutations, but the approach can equally be used for nonviral pathogens where mutations are introduced through another mechanism. The within-host evolutionary dynamics of the virus population are explored as a function of the fitness of the wild type and the intermediate and adapted mutants.
Calculation of virus populations.
A virus of type j is a virus with a particular set of mutations. The probability of each virus type (Nj) after a replication round is given by the sum of contributions from each type in the previous replication rounds:
| (1) |
where μij is the probability that type i will mutate to type j, and each type contributes exactly its expected value. If the mutation rate (μij) is low, the main contribution to the proportion of the population that is Nj at time t will be from the proportion of the population that was Nj at time (t − 1), and a smaller contribution will be from virus that was type Ni at time (t − 1) and mutated into type Nj. The probability of mutation μij is calculated as follows:
| (2) |
where r is the polymerase error rate. Thus, μij is the product of the probabilities of nonmutation (1 − r) for the set {m = 0}, i.e., positions for which no mutation is required, and of the probability of mutation (r) for the set of positions that need to mutate, {m = 1}.
Accounting for fitness values.
The deleterious and beneficial selection values were incorporated by adjusting the progeny of each virion to express the fitness disadvantage or advantage in each genome replication step prior to the start of the next generation. The starting population (generation 0) consists only of the starting virus. After the first replication round (equation 1), the population of each type (Ni) is multiplied by its relative fitness (fi), and the population is normalized (such that ∑i Ni_adj, where Ni_adj represents the population at the start of the next genome replication step, is equal to 1) through division by the sum of the fitness-weighted prevalence of all types:
| (3) |
where Ni_adj is used as Ni in equation 1 in the multiplication with the mutation matrix. When the effect of deleterious mutations is calculated, fitness f is varied, and a fully deleterious mutant has fitness f of 0, which causes relative increases in the probability of the other virus types in the total virus population.
Unless otherwise noted, the fitness of the wild-type (i.e., starting) virus and the final type with the full set of mutations of interest, the adapted virus, is neutral; that is, f is equal to 1.
Because this model normalizes the virus population via equation 3 and accounts for back-mutations in equation 2, the results are slightly different from those obtained with the shorthand formula introduced in equation 4 in the Results section. For this reason, calculation of the number of routes (see below) is a fast and informative approach to very closely approximate the probability of a certain set of mutations but does not provide results analytically identical to the modeling results.
Stochastic model runs.
In addition to the deterministic modeling results presented above, a set of stochastic discrete-time multitype branching process simulations was run; see also the work of Russell et al. (35). The starting population of a single virion expanded exponentially with a branching factor of 32 (leading to 103 virions produced per infected cell after the two genome replication steps), until the population size exceeded 1010 virions, from which point onwards the branching factor was set equal to 1. For each genome replication step, the expected number of each mutant type was determined by a Poisson-distributed random variable, with the expectation value based on the mutation matrix shown in equation 2, and the number of virions of each mutant type existing before the replication step, as was done for equation 1. This number was then multiplied by the relative fitness of each type and rounded to the nearest integer prior to starting the next genome replication step. I performed 10,000 stochastic runs for each of the 101 settings of fitness of the intermediate mutants with deleterious mutations (between 0 and 1 in steps of 0.01). The intensity of the shade of the pale red and blue colors in Fig. 1 and 4 was calculated on the basis of the log2 value of the number of simulation runs that have the resulting proportion of double mutants for each fitness setting; the average proportion across the 10,000 runs per fitness setting is indicated with the line connecting the circles in Fig. 1 and 4.
FIG 1.

(A) The blue line shows the deterministic probability that any virion will be a double mutant (log10) as a function of the relative fitness of the intermediate single mutants (a relative fitness of 0 means that the single mutants are fully deleterious). The probability is shown after 20 replication rounds in the situation where the starting (wild-type) virus and the adapted (double) mutant have neutral fitness (relative fitness = 1). The pale shades of blue indicate the results of 10,000 stochastic simulations for each of the 101 settings of relative fitness f. The circles indicate the average from the stochastic runs for each fitness setting. (B) The probability that any virion will be a double mutant is split into a mechanism where two mutations were acquired in a single replication round (through doubles) and a mechanism where the two single mutations occurred in distinct replication rounds (through singles).
FIG 4.

(A) The deterministic probability that any virion will be a double mutant (log10) is shown as a function of the relative fitness of the deleterious intermediate single mutant(s). The graph shows the situation when both single mutants are deleterious (fitness valley; see the blue line in Fig. 1) or when only the nonordered single mutant is deleterious (fitness ridge). The probability is shown after 20 replication rounds and for the situation in which the starting (wild-type) virus, ordered single mutant (for the fitness ridge), and double mutant have neutral fitness (f = 1). The pale shades of blue and red indicate the results of 10,000 stochastic simulations for each of the 101 settings of relative fitness f for the fitness valley and fitness ridge, respectively. The circles indicate the average from the stochastic runs for each fitness setting. (B) The probability that a virion will be a double mutant for the fitness ridge (red line) is divided into the contribution toward this probability by the mechanism where two mutations were acquired in a single replication round (through doubles), as two single mutations in distinct replication rounds in order (through ordered singles), and as two single mutations in distinct replication rounds occurring in the incorrect order, where the deleterious single mutation is obtained first and incurs the fitness cost (through deleterious singles).
Determining the route.
I introduce the terminology “through singles” to mean the process by which the two mutations are acquired through separate single mutations occurring in distinct replication rounds and “through doubles” to mean the process by which two mutations are achieved by mutating both sites in a single replication round. I investigated the probability that a double mutant would occur through doubles by setting the value of μij for single mutations to 0 in the mutation matrix. The through singles probability was calculated as the difference between the probability when all routes are allowed and the through doubles probability.
Similarly, to calculate how often the required set of mutations was achieved through a specific order, the fitness of any nonorder mutant was set equal to 0. The difference between the probability calculated when any order is allowed and the probability calculated when only a specific order is available determines the probability of nonorder mutation routes.
The fraction of available routes is calculated as the number of available routes given the constraints divided by the number of original routes.
Parameter choice.
The mutation rate is parameterized by the current best estimate for the influenza virus polymerase error rate (r = 1 × 10⁻⁵ mutations per site per genome replication [37, 38]) and can trivially be adjusted for other mutation rates. Indeed, all results in this report are not specific to influenza virus or viruses in general but apply to all large populations where mutations occur.
A “replication round” in this report refers to any step in which RNA is synthesized, because in each round of replication, polymerase errors can be introduced. For influenza viruses, where viral RNA (vRNA) is replicated into cRNA and then cRNA is copied into vRNA, there are (at least) two replication rounds per cell cycle. Results are shown after 20 viral replication rounds, which corresponds to 5 days of influenza virus infection (where each replication round lasts about 6 h and virions exit the cell after 12 h), but again, the number of replication rounds can be varied in the equations presented above.
RESULTS
Adaptation depends on the fitness of the intermediate mutations.
When all mutations are neutral, a simple probabilistic calculation of mutation accumulation closely approximates the probability that any virion randomly drawn from the within-host virus population in an individual initially infected with a single genotype would have mutated the m sites of interest over time, p(m, t), where t is the number of replication rounds:
| (4) |
This equation multiplies the probability that m mutations will be obtained (based on the polymerase error rate r), rm, by the number of combinatorial options available to acquire these m mutations over t generations or replication rounds (tm); see also the work of Russell et al. (35) and Gokhale et al. (39).
The probability that a given virion will have mutated 2 sites after 20 replication rounds with a polymerase error rate (r) of 1 × 10⁻⁵ is approximated by equation 4 to be 4 × 10⁻⁸. Naturally, this probability of observation of mutations at both sites will be less if either of the individual mutations is deleterious. If both individual mutations are deleterious, the pathogen will have to get across a fitness valley. The fitness of each mutant with a single deleterious mutation determines the likelihood that the virion will cross this fitness valley. A fully deleterious mutation has a relative fitness of 0, which means that no progeny is made from these virions at all, while for a relative fitness of 0.5, half as much progeny descends from these virions compared to the amount that descends from virions with a relative fitness of 1.
Figure 1A explores how the probability that a pathogen will cross a fitness valley depends on the deleterious effect of the intermediate mutations. In this scenario, each individual mutation is equally deleterious and the wild-type (starting) virus and the virus with the two required mutations (the adapted virus) have neutral fitness. The blue line in Fig. 1A shows the deterministic probability that a virion will be a double mutant as a function of the fitness of the intermediate mutants. In the scenario of neutral fitness without any fitness valley, where the fitness of each intermediate mutant is 1, the probability that a virion will be a double mutant after 20 replication rounds is, as approximated above, 4 × 10⁻⁸. As the relative fitness of each intermediate mutant decreases toward 0 (fully deleterious), the probability that any random virion in the virus mixture will be a double mutant decreases to 2 × 10⁻⁹. Note that, even though both intermediate mutants are fully deleterious, the probability that a virion will be a double mutant is only 20-fold lower than that without the fully deleterious fitness valley. The pale region in Fig. 1A is composed of the results of 10,000 stochastic model simulations for each of the 101 different settings of fitness f. The average of these runs, indicated by the connected circles, is somewhat lower than that from the deterministic calculations for intermediate values of deleterious fitness. These stochastic simulations highlight that even though stochastic effects may play a role, double mutations do occur regularly, even when the intermediate mutants are fully deleterious.
Such double mutants can arise when both mutations are acquired simultaneously in a single replication round, which is the “through doubles” mechanism. The purple line in Fig. 1B shows how much this mechanism of acquiring both mutations at once contributes toward the likelihood that a virion will be a double mutant. Note that this probability is not affected by the relative fitness: because the deleterious intermediates were never formed when two mutations were obtained at once, the virions avoid having to incur the designated fitness cost. The fitness valley is not crossed, rather, the virus jumps over it. The cyan line in Fig. 1B describes the alternative “through singles” mechanism, where the two single mutations were obtained in distinct replication rounds, which is the situation in which the virions did incur the deleterious cost of the intermediate and actually crossed through the valley. In Fig. 1B, it can be seen that this contribution depends strongly on the fitness of the intermediate single mutants. If the fitness of the intermediate mutants is neutral or the intermediate mutants have a high relative fitness, the through singles mechanism is the main contributor toward the probability that a double mutation will be acquired (right-hand side of Fig. 1B). However, when the intermediate single mutants are highly deleterious, the main contributor to the probability that a virion will be a double mutant is the through doubles mechanism.
Returning to Fig. 1A, it appears that the through doubles mechanism is less sensitive to stochastic variations than the through singles mechanism, and the deviation between the results of the deterministic model and the stochastic results is the largest for intermediate values of deleterious fitness. Here, the nonnegligible deleterious cost causes the stochastic loss of single mutants before the second mutation occurs. Such stochastic losses are less prominent for fit intermediates (f = 1) or identical or similar to the losses calculated in the deterministic model for highly deleterious intermediates.
An intuitive understanding: counting the number of routes.
Although both the through doubles and through singles mechanisms in Fig. 1 require two polymerase errors, the probability of which is r2, the relative contribution of through singles to two mutations is larger than that of through doubles at f equal to 1. This phenomenon can be understood by considering the number of routes. The through doubles route can happen once in each replication round t and, thus, in t different ways (here, 20). However, to get two single mutations, there can be, e.g., single mutations in two subsequent rounds (for which there are 19 × 2 options [the factor of 2 accounts for which mutation is first]) or single mutations in two replication rounds separated by a replication round without mutation (for which there are 18 × 2 options) and so on until there is one single mutation in round 1 and one in round 20 (for which there are only 2 options). The sum of these possibilities is 380 routes, which, when combined with the 20 routes of through doubles, corresponds to 202 ways to obtain two mutations in 20 replication rounds, i.e., the factor tm in equation 4. Although the term tm is nothing more than a combinatorial factor, it was found that explicit analysis of the number of routes represented by this term is useful for reasoning about the expected effects of various fitness valley shapes.
If the single mutations are fully deleterious, the effective number of routes to obtain a double mutant through single mutants is 0, because a double mutant can never arise from a single mutant if single mutants do not have progeny. In this situation, only the through doubles mechanism is possible, and thus, 20 out of the original 400 routes remain, causing a reduction in the probability of a double mutant by a factor 0.05 (the probability decreased from 4 × 10⁻⁸ to 2 × 10⁻⁹).
A general calculation of the effective number of routes to obtain a double mutant via the through singles mechanism for any value of relative fitness f of the single mutants can be given as well: if single mutations happen in successive replication rounds (delay d = 1), the fitness cost is incurred once; if they are separated by one replication round (d = 2), the fitness cost is incurred twice, while if the single mutations are 19 generations apart (d = 19), the fitness cost f is incurred 19 times. In total, the effective contribution to the number of routes through singles weighted by the incurred deleterious cost is given by
| (5) |
where t is the number of replication rounds, as before, and delay d is the time lapse in replication rounds between the two single mutations (for 20 replication rounds, the maximum delay is 19). The factor of 2 reflects the fact that the single mutations can be acquired in two different orders; the term (t − d) represents the number of options for any given delay (19 for a d of 1, 18 for a d of 2, etc.), while fd is the penalty term for the fitness cost incurred over d rounds of replication.
Figure 2 illustrates how the number of effective routes is composed of the contribution of the through doubles mechanism (in gray) and the different single-single mutation routes. If the relative fitness of the intermediate mutants is 0, the through doubles mechanism is the only contributor to the number of routes, as was seen in Fig. 1. Again, the effective number of routes for the through doubles mechanism is independent of the fitness of the deleterious single mutants, as any deleterious fitness cost is not incurred. Figure 2 also demonstrates that the effective number of routes for two single mutations separated by many replication rounds (e.g., d = 19, in pink) is substantially smaller than the effective number of routes for two subsequent single mutations (d = 1, in red). The reason for this is 2-fold: first, if there are 20 replication rounds, there are 19 × 2 routes to generate two single mutations 1 generation apart, while there are only 1 × 2 routes to obtain two single mutations 19 generations apart. Second, any deleterious effect of the single mutants is incurred for more replication rounds if the delay between the two single mutations is longer, and thus, the contribution of these single-single mutation routes with longer delays decreases even more as the intermediate mutants become more deleterious.
FIG 2.
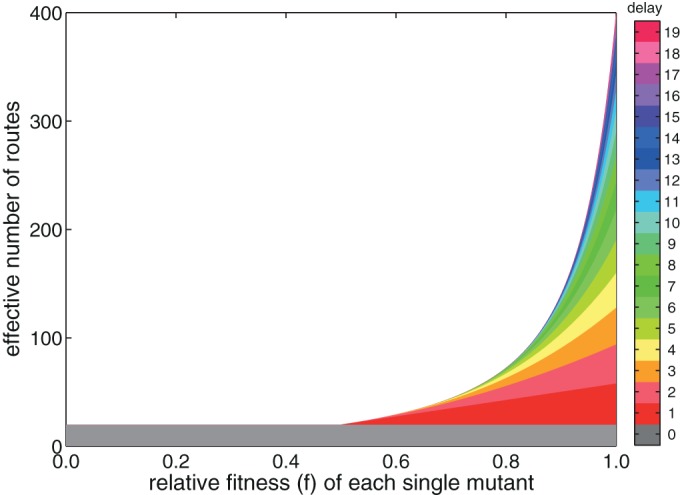
The effective number of routes to a double mutant is shown as a function of the relative fitness of the intermediate single mutants (a relative fitness f of 0 means that the single mutants are fully deleterious). The results are shown after 20 replication rounds in the situation where the starting (wild-type) virus and the adapted (double) mutant have neutral fitness (f = 1). The colors illustrate the relative contributions of a double mutation at once (gray, delay d = 0) and the single-single mutation routes with an increasing delay d of 1 until 19 replication rounds between the mutation events, represented by the gradient shown in the color bar.
Table 1, listing the results for when two to seven mutations are required, shows that the total number of routes (tm) increases as more mutations are required. It also shows the fraction of routes remaining when all the intermediate mutants are fully deleterious. For example, in the case where five mutations are required, all individual and combined intermediate mutations (and, thus, all single, double, triple, and quadruple mutations) are deleterious. Because all intermediate mutants are fully deleterious, all mutations have to be acquired at once, for which there are t options, so t out of tm routes remain. Although there were initially many routes through which to acquire 5 mutations (205), only 20 remain.
TABLE 1.
Number of available routes if all intermediate mutants are viable and the fraction of routes availablea
| No. of mutations required | No. of allowed routes | Total no. of routes | Fraction available |
|---|---|---|---|
| 2 | 20 | 400 | 5.0 × 10⁻² |
| 3 | 20 | 8 × 10³ | 2.5 × 10⁻³ |
| 4 | 20 | 1.6 × 10⁵ | 1.3 × 10⁻⁴ |
| 5 | 20 | 3.2 × 10⁶ | 6.3 × 10⁻⁶ |
| 6 | 20 | 6.4 × 10⁷ | 3.1 × 10⁻⁷ |
| 7 | 20 | 1.28 × 10⁹ | 1.6 × 10⁻⁸ |
The fraction of routes available was calculated as the number of allowed routes/total number of routes. The results are shown for two to seven mutations required for 20 replication rounds. The fitness of the starting (wild-type) virus and the adapted (double) mutant is neutral (f = 1), and all possible intermediate mutants are fully deleterious (f = 0).
When the fraction of available routes for the situation where 5 mutations are required, 6.3 × 10⁻⁶, is compared with the fraction where 2 mutations are required, 5.0 × 10⁻², it is clear that the fraction of the available number of routes decreases greatly as the number of intermediate deleterious mutations increases. Note that in addition to a larger number of deleterious intermediate mutants slowing down the viral adaptation, there is also the increased difficulty of acquiring more mutations in the first place (which is given by rm).
When a set of mutations, only some of which are deleterious, is required, the ratio of the effective number of routes to the total number of routes when that subset of mutations was not deleterious is the same as the fraction of routes available for the number of deleterious mutations. As an example, consider the situation where 5 mutations are required and 2 of the mutations need to be acquired as a double. When none of the 5 mutations are deleterious, there are 205 routes (tm). When the 2 mutations are individually fully deleterious, the second mutation of the double pair needs to occur simultaneously with the first mutation of the pair. As a result, the timing of mutation, for which there are 20 options if there are 20 replication rounds, needs to be established for only 4 mutations, as the timing of the last mutation needs to be identical to the timing of the other mutation in the pair. Hence, when 2 of the 5 mutations need to be acquired as a double, there are 204 routes left, and the fraction 204/205 is 0.05; see the results for 2 mutations required in Table 1.
The effect of deleterious intermediates is outweighed by the fitness advantage of adaptation.
In the previous calculations, I studied situations where the fully adapted mutant had neutral fitness and the number of available routes could directly be used when calculating the probability that a virion will be a fully adapted mutant. Next, I investigated whether the deleterious cost of intermediate mutants can be outweighed by the fitness gain that would be obtained upon achieving the full set of mutations, for example, as a result of obtaining a certain beneficial phenotype, such as antigenic escape or increased replication. In Fig. 3, the probability that any virion will be a double mutant after 20 replication rounds is indicated by color as a function of the relative fitness advantage (f) of the double mutant (which varied from 1 to 4) and the relative fitness of the deleterious single mutants (which varied from 0 to 1).
FIG 3.

The probability that any virion will be a double mutant (log10) is shown in color as a function of the relative fitness of the deleterious intermediate single mutants (x axis) and the relative fitness of the double, i.e., host-adapted, mutant (y axis). The probability is shown after 20 replication rounds, and the starting (wild-type) virus has neutral fitness (f = 1).
Figure 3 demonstrates that the probability that a random virion will obtain 2 mutations after 20 replication rounds varies relatively little with the fitness of the deleterious intermediates (along the x axis); for example, the maximum change in the scenario with neutral fitness (Fig. 1) was 20-fold, which corresponds to 1.3 units on a log10 axis. In contrast, the fitness gain of the double mutant causes changes across nine orders of magnitude, and this fitness gain therefore appears to be the main determinant of the probability of a double mutant. The mechanism behind these observations is that, in contrast to the deleterious cost, which is often incurred only briefly or is avoided altogether by obtaining both mutations at once, the fitness benefit of the double mutation is incurred in every single replication round once it has arisen; hence, the double mutant exponentially increases its presence in the pathogen population. For a fitness f of 4 of the double mutant, the minimum probability that a virion will be a double mutant across all fitnesses of the single mutants was 0.99998.
Adaptation via fitness ridges: compensating mutations imposing order.
Requiring mutations to occur in a specific order is a special case of deleterious mutations. Imagine the scenario in which two mutations are required, whereby one single mutation (α) compensates for or removes the deleterious effect of the other single mutation (β) (both the single intermediate α and the double mutant αβ have neutral fitness). To understand the effect of such an imposed order on the probability that a certain mutant will be obtained, the number of effective routes calculation is again helpful.
In the scenario where the double mutant and the mutant with mutation α have neutral fitness while mutation of only site β is fully deleterious, the two ways toward the double mutant are either to get both mutations simultaneously or to obtain the nondeleterious, compensating mutation α before mutating site β. As explained above, there are 20 out of 400 routes by which both mutations can be obtained at once, and half of the remaining 380 routes will have had compensating mutation α prior to mutation of site β. In total, 210 out of the 400 routes remain. Even though mutation β was fully deleterious, 52.5% of the routes are still available, thus incurring only a 2-fold reduction in the total proportion of double mutants.
Table 2 shows the number of allowed routes when all mutations need to be obtained in order for situations where 2 to 7 mutations are required. As more order is required, the reduction in the fraction of allowed routes increases: for stringent ordering of 5 mutations, only 1.3% of the routes remain, which is less than the 52.5% for requiring the order of 2 mutations.
TABLE 2.
Number of allowed routes if complete and strict order is required for all mutations, number of available routes if all intermediate mutants are viable, and fraction of routes available when two to seven mutations are requireda
| No. of mutations required | No. of allowed routes | Total no. of routes | Fraction available |
|---|---|---|---|
| 2 | 210 | 400 | 0.525 |
| 3 | 1,540 | 8 × 10³ | 0.193 |
| 4 | 8,855 | 1.6 × 10⁵ | 0.055 |
| 5 | 42,504 | 3.2 × 10⁶ | 0.013 |
| 6 | 177,100 | 6.4 × 10⁷ | 0.003 |
| 7 | 657,800 | 1.28 × 10⁹ | 5.14 × 10⁻⁴ |
As an example, for four mutations required, this would mean that mutation A has to occur prior to or simultaneously with mutation B, mutation B has to occur prior to or simultaneously with mutation C, and mutation C has to occur prior to or simultaneously with mutation D. The results are shown for 20 replication rounds in a situation in which the fitness of the starting (wild-type) virus and each ordered mutant are neutral (f = 1) and all possible nonordered intermediate mutants are fully deleterious (f = 0).
Because the imposition of order does not necessarily require multiple mutations to occur at once, the fraction of available routes is substantially larger in the situation where order is required than in the situation where all intermediate mutants are deleterious. For example, when 5 mutations are required, 1.3% of the routes remain if specific ordering of these 5 mutations is required, whereas only 0.00063% of the routes remain when all intermediate mutants are deleterious (Table 1). Thus, using available fitness ridges is always easier and is often considerably easier than jumping across or crossing a fitness valley.
The red line in Fig. 4A also shows that the effect of requiring order on the probability that a virion will obtain two mutations is relatively small, even if the nonordered single mutation is fully deleterious (compare the results for f equal to 0 and f equal to 1), especially compared to the situation where both single mutations are deleterious (blue line). The pale region is composed of 10,000 stochastic model simulations for the fitness ridge, in red, and fitness valley, in blue. The average of the stochastic runs, shown as circles, again indicates how traversing a fitness ridge is substantially more likely than jumping or crossing a fitness valley. Moreover, stochastic effects play virtually no role in the outcome for a virion that can travel via a fitness ridge, as the results are very similar to those of the deterministic model.
Figure 4B shows the contribution of the three different mechanisms that could lead to a double mutant. First, the virus could follow the imposed order and travel via two subsequent mutations along the fitness ridge. Second, the virus could simultaneously mutate both sites and jump across the surrounding fitness valley. Neither of these mechanisms violates the imposed order, and their contributions in Fig. 4B are independent of the fitness of the deleterious single mutant. Third, the virus could obtain the nonordered single mutation first, and incur the deleterious cost for a certain time. The contribution of the latter mechanism depends on the fitness of the nonordered deleterious single mutant and becomes 0 when f is equal to 0. As f decreases, the ridge in the fitness valley becomes the main mechanism toward obtaining the set of mutations. In general, following the imposed order and traveling via the fitness ridge become more attractive as the fitness valley deepens and widens, as nonordered intermediates become even less viable and obtaining simultaneous mutations becomes even less likely.
DISCUSSION
Using probabilistic calculations on within-host genetic evolution, I found that the effect of a fitness valley on adaptation is much smaller than might be expected and that the effect of requiring a specific order for mutations to occur is even smaller. In coinfected individuals, mechanisms such as reassortment (if the mutations of interest are on separate genes) and recombination—processes that are not currently included in the model—additionally affect the ability of viruses to overcome fitness valleys. Instead, I calculated, based on the within-host evolution of a single starting virus genotype infecting an individual, the probability that any virion will get a set of host adaptation mutations. This probability is directly related to the expected proportion of adapted mutants in the total population. The equations and calculations presented in this work can be used in any situation with fitness valleys and ridges where the deterministic assumptions are fulfilled and the population reproduces asexually. As a result, this method can aid the study of the effects of deleterious mutations in a wide range of pathogens, including, for example, Mycobacterium tuberculosis and HIV (5, 40, 41).
The methodology of counting the number of routes is a straightforward approach to calculate the effect of deleterious intermediate mutations and understand the ways in which pathogen populations traverse fitness valleys and ridges. For example, in the situation where a virus requires two mutations in which each is individually fully deleterious, the evolution is not halted, as this trap is avoided by acquiring multiple mutations at once. In addition, if viruses need to follow a specific order of mutation, the out-of-order intermediate mutants can be described to be fully deleterious. If only a few mutations need to be acquired in order, the influence on the adaptation of the virus is minimal, because the compensating mutations will occur beforehand without much difficulty: many routes are still available. Indeed, a key finding of this research is that the fitness disadvantages of intermediate mutations sometimes have a great effect on the proportion of adapted mutant, but only when a large number of intermediate mutations are deleterious and their fitness cost is large.
Although some models have recognized the importance of deleterious intermediates and the crossing of fitness valleys to the overall adaptive evolution of pathogens (27, 29, 42, 43) and the possibility that multiple simultaneous mutations can overcome such fitness valleys (44), various other models assume a strong selection-weak mutation paradigm (32–34, 45), ignoring any adaptive trajectories that require the crossing of a fitness valley. Such assumptions might be appropriate for small population sizes or pathogens with low mutation rates (5, 30). However, for a pathogen with a large population size and a high mutation rate, these SSWM assumptions are violated. For influenza virus, for example, the mutation rate is about 1 mutation per 105 nucleotides per round of genome replication (r = 10−5) (37, 38) and the population size (P) easily exceeds 1010 virions in a single host; hence, the SSWM conditions 4rP ≪ 1 or rP ≪ 1/ln(Ps), where s is the fitness increase, are not fulfilled (30, 46).
It should be noted, though, that the assumptions of the deterministic approximation are violated in parts of Tables 1 and 2 (which showed the numbers of routes for scenarios where up to 7 mutations are required). When the inverse of the error rate to the power of the number of mutations required (1/rm) is larger than or comparable to the population size, stochastic variations may become relevant. This was seen in Fig. 1A, where for a population size of about 1010 the two mutations were not acquired as readily as the deterministic model would have suggested. The smaller that the population size is in comparison to (1/rm), the higher the likelihood that stochastic effects decrease the expected proportion observed in the pathogen population. Especially when large numbers of mutations are required, the expected number of times that the adapted mutant occurs will be small, if not 0, when taking account of the population size. Moreover, the stochastic death of rare intermediate or fully adapted mutants will further affect the observed proportions. In a single host, one can multiply the effective virus population size, say, 1010, by the probability of interest, e.g., 6.65 × 10⁻⁷ for the probability that a random virion will be a double mutant when the intermediate single mutants are fully deleterious, the starting mutant has neutral fitness, and the double mutant has a fitness f of 1.5, to get the expected number of virions with the mutations of interest, which here would be 6,650. In the context of transmission, where small populations consisting of just a few virions are frequently estimated to start new infections, e.g., for influenza virus, HIV, and hepatitis C virus (47–50), the probability that any virion will be a mutant of interest is informative for epidemiological studies and risk assessment. In the biologically implausible case (but just to clarify) that each virion has the same chance of being transmitted and starting the next infection, if only a single virion starts the next infection, the chance that the next host will be infected with only the adapted virus is identical to the proportion of this adapted virus in the donor host.
Interestingly, evolutionary models have also been used to improve the understanding of the developmental stages and processes in cancer and to increase the efficacy of treatment regimes (51). In the evolution of a cancerous cell, there is often a fitness valley to be crossed before the cell is able to progress to expansive, uncontrolled growth (51). As with many other evolutionary models, models for cancer evolution are focused on population-level adaptation. The cancer literature describes two main mechanisms for the population-level crossing of the fitness valley: sequential fixation, whereby the full cancerous cell population acquires one mutation and only after fixation of the first mutation does the second mutation become fixed, and stochastic tunneling, whereby the second mutation establishes prior to fixation of the first mutation (52, 53). Stochastic tunneling describes the probability of fixation on a population level and allows sequential but not necessarily simultaneous mutations; in contrast, the deterministic calculations presented above describe the probability that multiple mutations will simultaneously be obtained by any single unit (a cell, pathogen, or virion) and can be converted to an expected proportion in the population.
An advantage of the deterministic calculations used here is that they can easily be adjusted to encompass more complicated schemes of required mutations and associated fitnesses. This approach is, for example, not limited to the investigation of effects of deleterious intermediates but can also be used when individual mutations are neutral or beneficial and the combined mutation is synergistic, for example, mutations at positions 138 and 229 in nonstructural protein 1 (NS1) (54) and 147, 339, and 588 in PB2 (55) of influenza A/H5N1 virus affecting virulence.
The implementation can easily be changed to model other situations, for example, (i) where a mutation has a fitness effect when it occurs in the vRNA but not when it occurs in the cRNA, as those molecules are not transcribed into mRNA and translated into a protein, or (ii) to encompass the delayed phenotypes of mutations (56, 57), whereby deleterious or advantageous fitness effects are not fully observed, as the respective proteins are generated in a meaningful amount only at a later time. Such mechanisms might alter the likelihood that deleterious and adaptive mutations will occur, for example, by a deleterious mutation arising as a nondeleterious mutation in the cRNA and the compensatory mutation arising in the next replication round, such that deleterious vRNA is never formed and both mutations are effectively neutral.
In the stochastic model, the branching factor governs population growth, and as a result of the founder effect, this leads to mutations that arise earlier in time, achieving higher proportions. This effect can be seen as banded simulation runs, for example, in Fig. 4A, where the top band shows that there are fewer instances (a lower red intensity) but higher proportions of double mutants for mutants arising early. Again, the implementation of this model can be adjusted such that the branching factor varies in both steps of replication to match the specific parameters for the virus of interest.
The calculations enable estimation of both the likelihood that fitness valleys will be crossed and the probability that a narrow fitness ridge will be traversed. The work on assessing the effect of fitness ridges and required order presented here is relevant, for example, in modeling antibiotic resistance (26) and the pyrimethamine resistance of the malaria parasite (58). The equations can easily incorporate variable mutation rates (59), which may be useful to investigate different polymerase error rates of influenza virus (60) and to account for the varying replication fidelity of HIV reverse transcriptase at different positions in the genome (61). This feature is also important in the evolutionary modeling of cancer, where disease progression often involves the acquisition of decreased genetic stability and, thus, an altered mutation rate (62).
Counting the number of routes is also a method that could be applied to determine the multiplicity of drug therapy, as the acquisition of drug-resistant mutations might be avoided by a treatment regime shaping the fitness valley so that it is deep and wide enough to prevent the pathogen from crossing, an approach that has been described with combination therapy, for example, in the treatment of influenza, tuberculosis, and HIV infection (61, 63–65). In the context of drug therapy, Ribeiro and Bonhoeffer already noted that for totally defective intermediate HIV mutants, all higher-order strains have to be produced directly from the wild type; i.e., only routes where all mutations are acquired at once are allowed (66). They also described that for smaller selective disadvantages, a mutant with k + 1 mutations is most likely produced from a k point mutant, i.e., a qualitative phrasing of the quantitation presented here of the contribution to the number of routes from obtaining two subsequent mutations for less deleterious intermediates (66).
The introduction of fitness valleys can also be exploited as a mitigation strategy for infectious diseases. One could, for example, design vaccines that require a pathogen to obtain destabilizing mutations to enable immune escape. Models of pathogen evolution can help to establish whether such approaches will completely stall adaptation of the pathogen or with what likelihood the designed fitness valleys would be crossed. Moreover, such approaches could also be used to explore alternative routes as a result of epistatic interactions that might allow deleterious mutations to occur if they are acquired in the right order (15, 17, 20).
The successful and efficient invasion of zoonoses into the human population is often thought to be constrained by the existence of deleterious mutations on the path to adaptation. Therefore, calculations on the effects of fitness valleys are of critical importance in assessments of the pandemic risk of emerging pathogens (8, 33, 35, 44, 67, 68) and, in addition, to inform the cost-benefit analyses of gain-of-function experiments and dual-use research of concern.
In summary, the ability to calculate the effects of deleterious mutations and mutation order and to understand the results with the description of the number of available routes helps to assess the expected impact of fitness valleys and ridges on pathogen evolution, with such findings being applicable in drug resistance, immune escape, and zoonotic risk assessments.
ACKNOWLEDGMENTS
I declare no conflict of interest.
I acknowledge André Brown and Colin Russell for their input on previous designs of the model, Sander Herfst and Gabriele Neumann for providing examples of deleterious mutations, and Ana Mosterín-Höpping, Leah Katzelnick, Ramona Mögling, David Pattinson, and Derek Smith for careful reading of previous manuscript versions.
This work was supported by the award of a fellowship in biomedical informatics from the Medical Research Council of the United Kingdom (MR/K021885/1) and a junior research fellowship from Homerton College Cambridge to J.M.F. and the award of HHSN272201400008C (NIAID Centres of Excellence for Influenza Research and Surveillance) to the Center for Pathogen Evolution.
REFERENCES
- 1.Whitlock MC, Phillips PC, Moore FB-G, Tonsor SJ. 1995. Multiple fitness peaks and epistasis. Annu Rev Ecol Syst 26:601–629. doi: 10.1146/annurev.es.26.110195.003125. [DOI] [Google Scholar]
- 2.Maisnier-Patin S, Andersson DI. 2004. Adaptation to the deleterious effects of antimicrobial drug resistance mutations by compensatory evolution. Res Microbiol 155:360–369. doi: 10.1016/j.resmic.2004.01.019. [DOI] [PubMed] [Google Scholar]
- 3.Wilke CO, Lenski RE, Adami C. 2003. Compensatory mutations cause excess of antagonistic epistasis in RNA secondary structure folding. BMC Evol Biol 3:3. doi: 10.1186/1471-2148-3-3. [DOI] [PMC free article] [PubMed] [Google Scholar]
- 4.Poelwijk FJ, Kiviet DJ, Weinreich DM, Tans SJ. 2007. Empirical fitness landscapes reveal accessible evolutionary paths. Nature 445:383–386. doi: 10.1038/nature05451. [DOI] [PubMed] [Google Scholar]
- 5.da Silva J, Coetzer M, Nedellec R, Pastore C, Mosier DE. 2010. Fitness epistasis and constraints on adaptation in a human immunodeficiency virus type 1 protein region. Genetics 185:293–303. doi: 10.1534/genetics.109.112458. [DOI] [PMC free article] [PubMed] [Google Scholar]
- 6.de Visser JAGM, Krug J. 2014. Empirical fitness landscapes and the predictability of evolution. Nat Rev Genet 15:480–490. doi: 10.1038/nrg3744. [DOI] [PubMed] [Google Scholar]
- 7.Paulson JC, de Vries RP. 2013. H5N1 receptor specificity as a factor in pandemic risk. Virus Res 178:99–113. doi: 10.1016/j.virusres.2013.02.015. [DOI] [PMC free article] [PubMed] [Google Scholar]
- 8.Kuiken T, Holmes EC, McCauley J, Rimmelzwaan GF, Williams CS, Grenfell BT. 2006. Host species barriers to influenza virus infections. Science 312:394–397. doi: 10.1126/science.1122818. [DOI] [PubMed] [Google Scholar]
- 9.Webby R, Hoffmann E, Webster R. 2004. Molecular constraints to interspecies transmission of viral pathogens. Nat Med 10:S77–S81. doi: 10.1038/nm1151. [DOI] [PMC free article] [PubMed] [Google Scholar]
- 10.Imai M, Watanabe T, Hatta M, Das SC, Ozawa M, Shinya K, Zhong G, Hanson A, Katsura H, Watanabe S, Li C, Kawakami E, Yamada S, Kiso M, Suzuki Y, Maher EA, Neumann G, Kawaoka Y. 2012. Experimental adaptation of an influenza H5 HA confers respiratory droplet transmission to a reassortant H5 HA/H1N1 virus in ferrets. Nature 486:420–428. doi: 10.1038/nature10831. [DOI] [PMC free article] [PubMed] [Google Scholar]
- 11.Herfst S, Schrauwen EJA, Linster M, Chutinimitkul S, de Wit E, Munster VJ, Sorrell EM, Bestebroer TM, Burke DF, Smith DJ, Rimmelzwaan GF, Osterhaus ADME, Fouchier RAM. 2012. Airborne transmission of influenza A/H5N1 virus between ferrets. Science 336:1534–1541. doi: 10.1126/science.1213362. [DOI] [PMC free article] [PubMed] [Google Scholar]
- 12.Linster M, van Boheemen S, de Graaf M, Schrauwen EJA, Lexmond P, Mänz B, Bestebroer TM, Baumann J, van Riel D, Rimmelzwaan GF, Osterhaus ADME, Matrosovich M, Fouchier RAM, Herfst S. 2014. Identification, characterization, and natural selection of mutations driving airborne transmission of A/H5N1 virus. Cell 157:329–339. doi: 10.1016/j.cell.2014.02.040. [DOI] [PMC free article] [PubMed] [Google Scholar]
- 13.Kryazhimskiy S, Dushoff J, Bazykin GA, Plotkin JB. 2011. Prevalence of epistasis in the evolution of influenza A surface proteins. PLoS Genet 7:e1001301. doi: 10.1371/journal.pgen.1001301. [DOI] [PMC free article] [PubMed] [Google Scholar]
- 14.Das SR, Hensley SE, David A, Schmidt L, Gibbs JS, Puigbò P, Ince WL, Bennink JR, Yewdell JW. 2011. Fitness costs limit influenza A virus hemagglutinin glycosylation as an immune evasion strategy. Proc Natl Acad Sci U S A 108:E1417–E1422. doi: 10.1073/pnas.1108754108. [DOI] [PMC free article] [PubMed] [Google Scholar]
- 15.Myers JL, Wetzel KS, Linderman SL, Li Y, Sullivan CB, Hensley SE. 2013. Compensatory hemagglutinin mutations alter antigenic properties of influenza viruses. J Virol 87:11168–11172. doi: 10.1128/JVI.01414-13. [DOI] [PMC free article] [PubMed] [Google Scholar]
- 16.Hensley SE, Das SR, Gibbs JS, Bailey AL, Schmidt LM, Bennink JR, Yewdell JW. 2011. Influenza A virus hemagglutinin antibody escape promotes neuraminidase antigenic variation and drug resistance. PLoS One 6:e15190. doi: 10.1371/journal.pone.0015190. [DOI] [PMC free article] [PubMed] [Google Scholar]
- 17.Gong LI, Suchard MA, Bloom JD. 2013. Stability-mediated epistasis constrains the evolution of an influenza protein. eLife 2:e00631. doi: 10.7554/eLife.00631. [DOI] [PMC free article] [PubMed] [Google Scholar]
- 18.Duan S, Govorkova EA, Bahl J, Zaraket H, Baranovich T, Seiler P, Prevost K, Webster RG, Webby RJ. 2014. Epistatic interactions between neuraminidase mutations facilitated the emergence of the oseltamivir-resistant H1N1 influenza viruses. Nat Commun 5:5029. doi: 10.1038/ncomms6029. [DOI] [PMC free article] [PubMed] [Google Scholar]
- 19.Bloom JD, Gong LI, Baltimore D. 2010. Permissive secondary mutations enable the evolution of influenza oseltamivir resistance. Science 328:1272–1275. doi: 10.1126/science.1187816. [DOI] [PMC free article] [PubMed] [Google Scholar]
- 20.Butler J, Hooper KA, Petrie S, Lee R, Maurer-Stroh S, Reh L, Guarnaccia T, Baas C, Xue L, Vitesnik S, Leang S-K, McVernon J, Kelso A, Barr IG, McCaw JM, Bloom JD, Hurt AC. 2014. Estimating the fitness advantage conferred by permissive neuraminidase mutations in recent oseltamivir-resistant A(H1N1)pdm09 influenza viruses. PLoS Pathog 10:e1004065. doi: 10.1371/journal.ppat.1004065. [DOI] [PMC free article] [PubMed] [Google Scholar]
- 21.Simon P, Holder BP, Bouhy X, Abed Y, Beauchemin CAA, Boivin G. 2011. The I222V neuraminidase mutation has a compensatory role in replication of an oseltamivir-resistant influenza virus A/H3N2 E119V mutant. J Clin Microbiol 49:715–717. doi: 10.1128/JCM.01732-10. [DOI] [PMC free article] [PubMed] [Google Scholar]
- 22.Smith JM. 1970. Natural selection and the concept of a protein space. Nature 225:563–564. doi: 10.1038/225563a0. [DOI] [PubMed] [Google Scholar]
- 23.Orr HA. 2005. The genetic theory of adaptation: a brief history. Nat Rev Genet 6:119–127. doi: 10.1038/nrg1523. [DOI] [PubMed] [Google Scholar]
- 24.Romero PA, Arnold FH. 2009. Exploring protein fitness landscapes by directed evolution. Nat Rev Mol Cell Biol 10:866–876. doi: 10.1038/nrm2805. [DOI] [PMC free article] [PubMed] [Google Scholar]
- 25.Orr HA. 1998. The population genetics of adaptation: the distribution of factors fixed during adaptive evolution. Evolution 52:935–949. doi: 10.2307/2411226. [DOI] [PubMed] [Google Scholar]
- 26.Weinreich DM, Delaney NF, DePristo MA, Hartl DL. 2006. Darwinian evolution can follow only very few mutational paths to fitter proteins. Science 312:111–114. doi: 10.1126/science.1123539. [DOI] [PubMed] [Google Scholar]
- 27.Covert AW, Lenski RE, Wilke CO, Ofria C. 2013. Experiments on the role of deleterious mutations as stepping stones in adaptive evolution. Proc Natl Acad Sci U S A 110:E3171–E3178. doi: 10.1073/pnas.1313424110. [DOI] [PMC free article] [PubMed] [Google Scholar]
- 28.Gerrish PJ, Lenski RE. 1998. The fate of competing beneficial mutations in an asexual population. Genetica 102-103:127–144. [PubMed] [Google Scholar]
- 29.Cowperthwaite MC, Bull JJ, Meyers LA. 2006. From bad to good: fitness reversals and the ascent of deleterious mutations. PLoS Comput Biol 2:e141. doi: 10.1371/journal.pcbi.0020141. [DOI] [PMC free article] [PubMed] [Google Scholar]
- 30.Gillespie JH. 1983. Some properties of finite populations experiencing strong selection and weak mutation. Am Nat 121:691–708. doi: 10.1086/284095. [DOI] [Google Scholar]
- 31.Dean AM, Thornton JW. 2007. Mechanistic approaches to the study of evolution: the functional synthesis. Nat Rev Genet 8:675–688. doi: 10.1038/nrg2160. [DOI] [PMC free article] [PubMed] [Google Scholar]
- 32.Franke J, Klözer A, de Visser JAGM, Krug J. 2011. Evolutionary accessibility of mutational pathways. PLoS Comput Biol 7:e1002134. doi: 10.1371/journal.pcbi.1002134. [DOI] [PMC free article] [PubMed] [Google Scholar]
- 33.Park M, Loverdo C, Schreiber SJ, Lloyd-Smith JO. 2013. Multiple scales of selection influence the evolutionary emergence of novel pathogens. Philos Trans R Soc Lond B Biol Sci 368:20120333. doi: 10.1098/rstb.2012.0333. [DOI] [PMC free article] [PubMed] [Google Scholar]
- 34.Weinreich DM, Watson RA, Chao L. 2005. Perspective: sign epistasis and genetic constraint on evolutionary trajectories. Evolution 59:1165–1174. doi: 10.1554/04-272. [DOI] [PubMed] [Google Scholar]
- 35.Russell CA, Fonville JM, Brown AEX, Burke DF, Smith DL, James SL, Herfst S, van Boheemen S, Linster M, Schrauwen EJ, Katzelnick L, Mosterín A, Kuiken T, Maher E, Neumann G, Osterhaus ADME, Kawaoka Y, Fouchier RAM, Smith DJ. 2012. The potential for respiratory droplet-transmissible A/H5N1 influenza virus to evolve in a mammalian host. Science 336:1541–1547. doi: 10.1126/science.1222526. [DOI] [PMC free article] [PubMed] [Google Scholar]
- 36.Fonville JM, Burke DF, Lewis NS, Katzelnick LC, Russell CA. 2013. Quantifying the fitness advantage of polymerase substitutions in influenza A/H7N9 viruses during adaptation to humans. PLoS One 8:e76047. doi: 10.1371/journal.pone.0076047. [DOI] [PMC free article] [PubMed] [Google Scholar]
- 37.Sanjuán R, Nebot MR, Chirico N, Mansky LM, Belshaw R. 2010. Viral mutation rates. J Virol 84:9733–9748. doi: 10.1128/JVI.00694-10. [DOI] [PMC free article] [PubMed] [Google Scholar]
- 38.Drake JW. 1993. Rates of spontaneous mutation among RNA viruses. Proc Natl Acad Sci U S A 90:4171–4175. doi: 10.1073/pnas.90.9.4171. [DOI] [PMC free article] [PubMed] [Google Scholar]
- 39.Gokhale CS, Iwasa Y, Nowak MA, Traulsen A. 2009. The pace of evolution across fitness valleys. J Theor Biol 259:613–620. doi: 10.1016/j.jtbi.2009.04.011. [DOI] [PMC free article] [PubMed] [Google Scholar]
- 40.Gagneux S, Long CD, Small PM, Van T, Schoolnik GK, Bohannan BJM. 2006. The competitive cost of antibiotic resistance in Mycobacterium tuberculosis. Science 312:1944–1946. doi: 10.1126/science.1124410. [DOI] [PubMed] [Google Scholar]
- 41.Coffin JM. 1995. HIV population dynamics in vivo: implications for genetic variation, pathogenesis, and therapy. Science 267:483–489. doi: 10.1126/science.7824947. [DOI] [PubMed] [Google Scholar]
- 42.Weissman DB, Desai MM, Fisher DS, Feldman MW. 2009. The rate at which asexual populations cross fitness valleys. Theor Popul Biol 75:286–300. doi: 10.1016/j.tpb.2009.02.006. [DOI] [PMC free article] [PubMed] [Google Scholar]
- 43.Loverdo C, Lloyd-Smith JO. 2013. Evolutionary invasion and escape in the presence of deleterious mutations. PLoS One 8:e68179. doi: 10.1371/journal.pone.0068179. [DOI] [PMC free article] [PubMed] [Google Scholar]
- 44.Alexander HK, Day T. 2010. Risk factors for the evolutionary emergence of pathogens. J R Soc Interface 7:1455–1474. doi: 10.1098/rsif.2010.0123. [DOI] [PMC free article] [PubMed] [Google Scholar]
- 45.Weinreich DM, Chao L. 2005. Rapid evolutionary escape by large populations from local fitness peaks is likely in nature. Evolution 59:1175–1182. doi: 10.1554/04-392. [DOI] [PubMed] [Google Scholar]
- 46.Desai MM, Fisher DS. 2007. Beneficial mutation-selection balance and the effect of linkage on positive selection. Genetics 176:1759–1798. doi: 10.1534/genetics.106.067678. [DOI] [PMC free article] [PubMed] [Google Scholar]
- 47.Varble A, Albrecht RA, Backes S, Crumiller M, Bouvier NM, Sachs D, Garcia-Sastre A, tenOever BR. 2014. Influenza A virus transmission bottlenecks are defined by infection route and recipient host. Cell Host Microbe 16:691–700. doi: 10.1016/j.chom.2014.09.020. [DOI] [PMC free article] [PubMed] [Google Scholar]
- 48.Wilker PR, Dinis JM, Starrett G, Imai M, Hatta M, Nelson CW, O'Connor DH, Hughes AL, Neumann G, Kawaoka Y, Friedrich TC. 2013. Selection on haemagglutinin imposes a bottleneck during mammalian transmission of reassortant H5N1 influenza viruses. Nat Commun 4:2636. doi: 10.1038/ncomms3636. [DOI] [PMC free article] [PubMed] [Google Scholar]
- 49.Wang GP, Sherrill-Mix SA, Chang K-M, Quince C, Bushman FD. 2010. Hepatitis C virus transmission bottlenecks analyzed by deep sequencing. J Virol 84:6218–6228. doi: 10.1128/JVI.02271-09. [DOI] [PMC free article] [PubMed] [Google Scholar]
- 50.Keele BF, Giorgi EE, Salazar-Gonzalez JF, Decker JM, Pham KT, Salazar MG, Sun C, Grayson T, Wang S, Li H, Wei X, Jiang C, Kirchherr JL, Gao F, Anderson JA, Ping L-H, Swanstrom R, Tomaras GD, Blattner WA, Goepfert PA, Kilby JM, Saag MS, Delwart EL, Busch MP, Cohen MS, Montefiori DC, Haynes BF, Gaschen B, Athreya GS, Lee HY, Wood N, Seoighe C, Perelson AS, Bhattacharya T, Korber BT, Hahn BH, Shaw GM. 2008. Identification and characterization of transmitted and early founder virus envelopes in primary HIV-1 infection. Proc Natl Acad Sci U S A 105:7552–7557. doi: 10.1073/pnas.0802203105. [DOI] [PMC free article] [PubMed] [Google Scholar]
- 51.Merlo LMF, Pepper JW, Reid BJ, Maley CC. 2006. Cancer as an evolutionary and ecological process. Nat Rev Cancer 6:924–935. doi: 10.1038/nrc2013. [DOI] [PubMed] [Google Scholar]
- 52.Iwasa Y, Michor F, Nowak MA. 2004. Stochastic tunnels in evolutionary dynamics. Genetics 166:1571–1579. doi: 10.1534/genetics.166.3.1571. [DOI] [PMC free article] [PubMed] [Google Scholar]
- 53.Komarova NL, Sengupta A, Nowak MA. 2003. Mutation-selection networks of cancer initiation: tumor suppressor genes and chromosomal instability. J Theor Biol 223:433–450. doi: 10.1016/S0022-5193(03)00120-6. [DOI] [PubMed] [Google Scholar]
- 54.Fan S, Macken CA, Li C, Ozawa M, Goto H, Iswahyudi NFN, Nidom CA, Chen H, Neumann G, Kawaoka Y. 2013. Synergistic effect of the PDZ and p85β-binding domains of the NS1 protein on virulence of an avian H5N1 influenza A virus. J Virol 87:4861–4871. doi: 10.1128/JVI.02608-12. [DOI] [PMC free article] [PubMed] [Google Scholar]
- 55.Fan S, Hatta M, Kim JH, Halfmann P, Imai M, Macken CA, Le MQ, Nguyen T, Neumann G, Kawaoka Y. 2014. Novel residues in avian influenza virus PB2 protein affect virulence in mammalian hosts. Nat Commun 5:5021. doi: 10.1038/ncomms6021. [DOI] [PMC free article] [PubMed] [Google Scholar]
- 56.Valcárcel J, Ortín J. 1989. Phenotypic hiding: the carryover of mutations in RNA viruses as shown by detection of mar mutants in influenza virus. J Virol 63:4107–4109. [DOI] [PMC free article] [PubMed] [Google Scholar]
- 57.Wilke CO, Novella IS. 2003. Phenotypic mixing and hiding may contribute to memory in viral quasispecies. BMC Microbiol 3:11. doi: 10.1186/1471-2180-3-11. [DOI] [PMC free article] [PubMed] [Google Scholar]
- 58.Lozovsky ER, Chookajorn T, Brown KM, Imwong M, Shaw PJ, Kamchonwongpaisan S, Neafsey DE, Weinreich DM, Hartl DL. 2009. Stepwise acquisition of pyrimethamine resistance in the malaria parasite. Proc Natl Acad Sci U S A 106:12025–12030. doi: 10.1073/pnas.0905922106. [DOI] [PMC free article] [PubMed] [Google Scholar]
- 59.Mansky LM, Cunningham KS. 2000. Virus mutators and antimutators: roles in evolution, pathogenesis and emergence. Trends Genet 16:512–517. doi: 10.1016/S0168-9525(00)02125-9. [DOI] [PubMed] [Google Scholar]
- 60.Suárez P, Valcárcel J, Ortín J. 1992. Heterogeneity of the mutation rates of influenza A viruses: isolation of mutator mutants. J Virol 66:2491–2494. [DOI] [PMC free article] [PubMed] [Google Scholar]
- 61.Ribeiro RM, Bonhoeffer S, Nowak MA. 1998. The frequency of resistant mutant virus before antiviral therapy. AIDS 12:461–465. doi: 10.1097/00002030-199805000-00006. [DOI] [PubMed] [Google Scholar]
- 62.Loeb LA. 1991. Mutator phenotype may be required for multistage carcinogenesis. Cancer Res 51:3075–3079. [PubMed] [Google Scholar]
- 63.Schrag SJ, Perrot V, Levin BR. 1997. Adaptation to the fitness costs of antibiotic resistance in Escherichia coli. Proc Biol Sci 264:1287–1291. doi: 10.1098/rspb.1997.0178. [DOI] [PMC free article] [PubMed] [Google Scholar]
- 64.Perelson AS, Rong L, Hayden FG. 2012. Combination antiviral therapy for influenza: predictions from modeling of human infections. J Infect Dis 205:1642–1645. doi: 10.1093/infdis/jis265. [DOI] [PMC free article] [PubMed] [Google Scholar]
- 65.Müller B, Borrell S, Rose G, Gagneux S. 2013. The heterogeneous evolution of multidrug-resistant Mycobacterium tuberculosis. Trends Genet 29:160–169. doi: 10.1016/j.tig.2012.11.005. [DOI] [PMC free article] [PubMed] [Google Scholar]
- 66.Ribeiro RM, Bonhoeffer S. 1999. A stochastic model for primary HIV infection: optimal timing of therapy. AIDS 13:351–357. doi: 10.1097/00002030-199902250-00007. [DOI] [PubMed] [Google Scholar]
- 67.Pepin KM, Lass S, Pulliam JRC, Read AF, Lloyd-Smith JO. 2010. Identifying genetic markers of adaptation for surveillance of viral host jumps. Nat Rev Microbiol 8:802–813. doi: 10.1038/nrmicro2440. [DOI] [PMC free article] [PubMed] [Google Scholar]
- 68.Holmes EC. 2013. What can we predict about viral evolution and emergence? Curr Opin Virol 3:180–184. doi: 10.1016/j.coviro.2012.12.003. [DOI] [PMC free article] [PubMed] [Google Scholar]