

Abstract
To define the components of the metabolic syndrome that contribute to diabetic polyneuropathy (DPN) in type 2 diabetes mellitus (T2DM), we treated the BKS db/db mouse, an established murine model of T2DM and the metabolic syndrome, with the thiazolidinedione class drug pioglitazone. Pioglitazone treatment of BKS db/db mice produced a significant weight gain, restored glycemic control, and normalized measures of serum oxidative stress and triglycerides but had no effect on LDLs or total cholesterol. Moreover, although pioglitazone treatment normalized renal function, it had no effect on measures of large myelinated nerve fibers, specifically sural or sciatic nerve conduction velocities, but significantly improved measures of small unmyelinated nerve fiber architecture and function. Analyses of gene expression arrays of large myelinated sciatic nerves from pioglitazone-treated animals revealed an unanticipated increase in genes related to adipogenesis, adipokine signaling, and lipoprotein signaling, which likely contributed to the blunted therapeutic response. Similar analyses of dorsal root ganglion neurons revealed a salutary effect of pioglitazone on pathways related to defense and cytokine production. These data suggest differential susceptibility of small and large nerve fibers to specific metabolic impairments associated with T2DM and provide the basis for discussion of new treatment paradigms for individuals with T2DM and DPN.
Introduction
Nearly 387 million people have diabetes worldwide, and the epidemic continues to rise at an alarming rate (1). Type 2 diabetes mellitus (T2DM) accounts for 95% of diagnosed diabetes (2), and its complications, including heart disease and stroke, result in significant morbidity and mortality, representing the first and fourth most common causes of death, respectively, in the U.S. (3). The best predictor of T2DM macrovascular complications is the preceding presence of microvascular complications, particularly diabetic polyneuropathy (DPN) and diabetic nephropathy (DN). Although the exact etiology of DPN and DN remain a source of intensive investigation, it is generally believed that hyperglycemia underlies both complications and that glycemic control is the cornerstone treatment for DPN and DN, preventing ulcers, lower-limb amputations, and renal failure (4,5).
We completed a Cochrane review of all available evidence on the role of glycemic control in DPN and discovered that glucose control positively affects DPN in patients with type 1 diabetes mellitus (T1DM) but has little beneficial effect on DPN in patients with T2DM (6), thus supporting the emerging concept that DPN in T2DM is due to the metabolic syndrome and not hyperglycemia alone. Contrasting with DPN, glucose control ameliorates renal injury in T2DM rodents (7), suggesting that glucotoxicity is more important in the pathogenesis of DN in T2DM and complications-specific pathological mechanisms. The metabolic syndrome is present when a patient has at least three of the following five metabolic features: central obesity, hypertension, hyperglycemia, hypertriglyceridemia, and low levels of HDL cholesterol. Although nearly all individuals with T2DM have the metabolic syndrome (8), the combination of features underlying the onset and progression of DPN in T2DM remains unknown. This knowledge is critical if we are to make meaningful inroads into treatment of this common and disabling disorder.
To gain insight into which components of the metabolic syndrome contribute to DPN in T2DM, we turned to the BKS db/db mouse, an established T2DM murine model. The leptin receptor mutation in BKS db/db mice produces robust T2DM and metabolic syndrome features that parallel the human disorder, including hyperglycemia, hyperinsulinemia, hypertriglyceridemia, insulin resistance, and obesity (9,10). At 8 weeks of age, these mice develop painful allodynia, a common early sign of human DPN, and as in man, the disease progresses to frank nerve fiber loss with concomitant sensory loss and abnormal electrophysiology by 16 weeks of age (11). The animals also develop DN, with the expected pathological glomerular hypertrophy, capillary basement membrane thickening, and podocyte loss as well as decreased renal function as quantitated by lower albumin-to-creatinine ratios (ACRs) (12,13).
In the current study, we treated BKS db/db mice with the thiazolidinedione (TZD) pioglitazone. Pioglitazone stimulates the nuclear receptor peroxisome proliferator–activated receptor (PPAR)-γ and to a lesser degree PPAR-α. When activated by pioglitazone, these genes regulate the expression of insulin-sensitive genes that improve glycemia, decrease triglyceride levels, and increase HDL cholesterol in patients with T2DM. In the current study, pioglitazone treatment of BKS db/db mice for 11 weeks restored glycemic control, normalized measures of serum oxidative stress and triglycerides, and caused significant weight gain with no effect on LDL or total cholesterol. This improved metabolic control normalized renal function but had no effect on nerve conduction velocities (NCVs), measurements of large myelinated fiber function. In contrast, measures of small unmyelinated nerve fiber architecture and function reflected by intraepidermal nerve fiber density (IENFD) and thermal latency testing were significantly improved. Analyses of gene expression arrays of large myelinated sciatic nerves (SCNs) and dorsal root ganglia (DRGs) identified differential pathway regulation by both T2DM and pioglitazone treatment. These results suggest that small and large nerve fibers are differentially impaired by components of the metabolic syndrome.
Research Design and Methods
Animals
Male BKS db/+ and db/db mice (BKS.Cg-m +/+ Leprdb/J, stock number 000642; The Jackson Laboratory, Bar Harbor, ME) were fed a standard diet (5LOD, 13.4% kcal fat; Research Diets, New Brunswick, NJ) with or without 15 mg/kg pioglitazone (112.5 mg pioglitazone/kg chow for a final dose of 15 mg/kg to the mouse) starting at 5 weeks of age and maintained through 16 weeks of age, totaling 11 weeks of pioglitazone treatment. Animals were maintained in a pathogen-free environment and cared for by the University of Michigan (U-M) Unit for Laboratory Animal Medicine. All protocols were approved by the U-M University Committee on Use and Care of Animals and followed the Diabetes Complications Consortium guidelines (www.diacomp.org/shared/protocols.aspx).
Metabolic Phenotyping
Body weights were measured weekly, as was fasting blood glucose (FBG) using an AlphaTRAK glucometer (Abbott Laboratories, Abbott Park, IL). Glycosylated hemoglobin (GHb) level was measured by the Chemistry Core at the Michigan Diabetes Research and Training Center. The National Mouse Metabolic Phenotyping Center (Vanderbilt University, Nashville, TN) completed plasma insulin measurements and fast-protein liquid chromatography (FPLC) analysis for cholesterol and triglycerides. Plasma hydroxyoctadecadienoic acids (HODEs) were quantified by reverse-phase C-18 high-performance liquid chromatography (JASCO, Essex, U.K.) using a Beckman ODS Ultrasphere C18 Column (Beckman Coulter, Inc., Fullerton, CA) to analyze triphenylphosphine-reduced lipid extracts after base hydrolysis. Analyses of the dansylated derivatives of tyrosine and O,O′-dityrosine were also completed by reverse-phase high-performance liquid chromatography as previously described (14) and quantified using authentic O,O′-dityrosine and tyrosine standard curves.
DPN and DN Phenotyping
At 16 weeks of age, all animals were phenotyped for DPN and DN according to the Diabetes Complications Consortium guidelines (15,16). Briefly, large nerve fiber involvement was assessed through NCV measurements, and small nerve fiber involvement was assessed through IENFD and thermal latency measurements as previously described (10,17). Periodic acid Schiff (PAS) staining was performed on 3-μm-thick fixed kidneys to determine mesangial area as previously described (18,19). Urinary albumin levels, ACRs, glomerular area, and glomerular PAS-positive area were measured using published protocols (18,19).
Affymetrix Microarray Analyses
Total RNA was isolated from SCNs and DRGs from db/+ (n = 6), db/db (n = 6), db/+ with pioglitazone (db/+ PIO) (n = 6), and db/db with pioglitazone (db/db PIO) (n = 6) mice using the RNeasy Mini Kit (QIAGEN, Valencia, CA). RNA integrity was assessed using the 2100 Bioanalyzer (Agilent Technologies, Santa Clara, CA). Samples meeting RNA quality criteria were analyzed by microarray as previously described (20). Briefly, total RNA (75 ng) was amplified and biotin labeled using the Ovation Biotin-RNA Amplification System (NuGEN Technologies Inc., San Carlos, CA) per the manufacturer’s protocol. Amplification and hybridization were performed by the U-M Comprehensive Cancer Center Affymetrix and Microarray Core Facility using the Affymetrix GeneChip Mouse Genome 430 2.0 Array.
Microarray Data Analysis and Validation
Microarray data were analyzed using our locally established microarray analysis pipelines (20,21). Briefly, microarray files were Robust Multi-array Average normalized using the BrainArray Custom Chip Definition File version 15 (22). Quality was assessed using the affyAnalysisQC R package (http://arrayanalysis.org) with Bioconductor (www.bioconductor.org). Differentially expressed genes (DEGs) were determined using the intensity-based moderated T-statistic (IBMT) test (23) with a false discovery rate (FDR) cutoff <0.05. DEGs were obtained by pairwise comparisons either between genotypes (db/+ vs. db/db) or between treatment groups (untreated vs. pioglitazone treatment) for each genotype. The DEG sets were then compared against each other to identify overlapping and unique gene expression changes. Analyses focused on the db/+ versus db/db and db/db versus db/db PIO DEG sets to identify genes that were affected by T2DM and/or pioglitazone treatment.
To identify and compare the overrepresented biological functions among DEG sets, Gene Set Enrichment Analysis was performed using a locally implemented version of the Database for Annotation, Visualization and Integrated Discovery (DAVID) (http://david.abcc.ncifcrf.gov) (24). Gene Ontology (GO) terms and Kyoto Encyclopedia of Genes and Genomes (KEGG) pathways were selected as the functional terms, and those with a Benjamini-Hochberg corrected P < 0.05 were selected as significantly overrepresented biological functions in each DEG set. A heat map was generated using the top 10 overrepresented biological functions in each DEG set, with clustering based on significance values (log-transformed Benjamini-Hochberg corrected P values), to visually represent overall similarity and differences between DEG sets.
For technical array data validation, four DEGs (Ucp1, Acca1b, Cidea, Ppargc1a) from DRGs among those with the highest fold change were evaluated by real-time RT-PCR (RT-qPCR) as previously described (20). Tyrosine 3-monooxygenase/tryptophan 5-monooxygenase activation protein (Ywhaz) was used as the endogenous reference gene. Primers were selected using PrimerBank (http://pga.mgh.harvard.edu/primerbank) and purchased from Integrated DNA Technologies (Coralville, IA) (Supplementary Table 1).
Statistical Analysis
Statistically significant differences in phenotypic measurements between groups were determined using Prism 6 software (GraphPad Software, La Jolla, CA) and the two-tailed t test. Values are reported as the mean ± SEM.
Results
Diabetes, Oxidative Stress, and Dyslipidemia
BKS db/db mice were significantly heavier than db/+ controls, and pioglitazone treatment increased db/+ and db/db body weights by 19% and 83%, respectively, making db/db PIO animals morbidly obese (Fig. 1A and Supplementary Fig. 1). FBG and %GHb (mmol/mol) were significantly elevated in db/db compared with db/+ animals, whereas pioglitazone treatment normalized both parameters to db/+ control levels (Fig. 1B and C; see Supplementary Fig. 2 for GHb [mmol/mol]). Plasma insulin, however, was elevated in both untreated and pioglitazone-treated db/db animals (Fig. 1D). Conversely, plasma HODE and nitrotyrosine levels were significantly increased in db/db animals and normalized to control levels by pioglitazone treatment (Fig. 1E and F).
Figure 1.
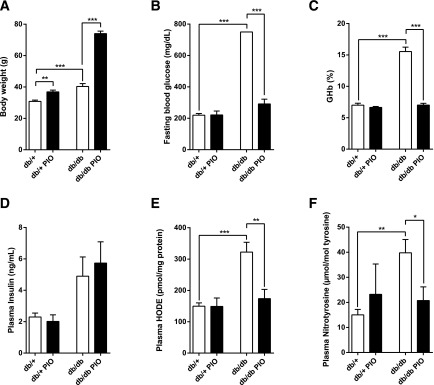
Effects of pioglitazone on body weight and multiple physiological parameters in plasma. After 11 weeks of pioglitazone treatment, body weight (A), FBG (B), %GHb (C), plasma insulin (D), plasma HODE (E), and plasma nitrotyrosine (F) were assessed. In all panels, n = 6. *P < 0.05, **P < 0.01, ***P < 0.001.
Lipid analyses revealed a 5- and 12-fold elevation in total plasma triglycerides and VLDL triglycerides, respectively, in db/db relative to db/+ mice; both parameters were normalized by pioglitazone treatment (Fig. 2A and B). In contrast, there was no statistically significant difference in total plasma cholesterol across experimental groups, regardless of treatment (Fig. 2C); however, FPLC analysis of pooled plasma samples revealed an apparent increase in the LDL fraction of pioglitazone-treated db/db mice compared with untreated db/db mice (Fig. 2D).
Figure 2.

Effects of pioglitazone on plasma triglyceride and cholesterol profiles. After 11 weeks of pioglitazone treatment, total fasting triglycerides (A), plasma triglyceride profiles (B), total fasting cholesterol (C), and plasma cholesterol profiles (D) were assessed. Fasting plasma samples were pooled for each lipid profiling group and fractionated by FPLC. Total triglyceride and total cholesterol profiles were measured in each fraction. In all panels, n = 6. *P < 0.05, **P < 0.01.
DPN Phenotyping
Sural and sciatic NCVs, measures of large fiber function, were decreased in db/db relative to db/+ mice, with no treatment effect on either measurement (Fig. 3A and B). Hindpaw withdrawal latency, a behavioral assessment of thermal sensation that represents small fiber function, was significantly increased in db/db compared with db/+ animals and was normalized by pioglitazone treatment (Fig. 3C). IENFD, a measure of small fiber architecture, was significantly decreased in db/db compared with db/+ animals and was significantly improved by pioglitazone treatment (Fig. 3D and E).
Figure 3.

Effects of pioglitazone on multiple neuropathic parameters. After 11 weeks of pioglitazone treatment, sural NCV (A), sciatic NCV (B), hindpaw latency (C), and IENFD (D) were assessed. Representative images of the effect of pioglitazone treatment on IENFD in db/db mice (E). In all panels, n = 6. *P < 0.05, ***P < 0.001.
DN Phenotyping
Quantitation of renal function by measuring 24-h urinary albumin secretion and ACR revealed a 300- and 1,000-fold increase, respectively, in db/db mice (Supplementary Fig. 3A and B), and pioglitazone treatment normalized both functional measurements to control db/+ levels. In parallel, mesangial matrix accumulation, as measured by the mesangial index, was significantly increased in db/db animals and normalized with pioglitazone treatment (Supplementary Fig. 3C). Morphological changes in glomeruli were also observed in the db/db mice and were rescued by pioglitazone treatment (Supplementary Fig. 4A). Likewise, glomerular area and glomerular PAS-positive area (Supplementary Fig. 4B and C) were significantly increased in db/db animals and normalized with pioglitazone treatment.
DRG and SCN Transcriptomic Profiling
To better understand the differential effect of pioglitazone treatment on small and large nerve fibers, we performed microarray analyses on DRGs and SCNs from the four experimental groups. We identified DEGs, and RT-qPCR of selected DEGs in DRGs reflected comparable profiles to microarray data (Supplementary Table 2), thus validating the microarray findings.
DRGs
In DRGs, 2,082 genes showed significant differential expression between the db/+ and db/db groups (FDR <0.05), whereas pioglitazone treatment significantly changed the expression of 1,811 and 24 genes in the db/db and db/+ animals, respectively (Fig. 4A). The most highly enriched biological functions among these four DEG sets are shown in Fig. 4B, and the overlap among these sets is summarized in Supplementary Table 3. Further analysis of the db/+ versus db/db and db/db versus db/db PIO DEG sets to examine the effects of pioglitazone treatment on DPNs (Fig. 4A) also demonstrated that of 1,811 genes affected by pioglitazone, 1,356 were not affected by T2DM (Fig. 4C). In addition, of the 2,082 DEGs regulated by diabetes, 455 genes (22%) were also significantly regulated by pioglitazone treatment, whereas the remaining 1,627 genes were not changed by pioglitazone treatment (Fig. 4C).
Figure 4.
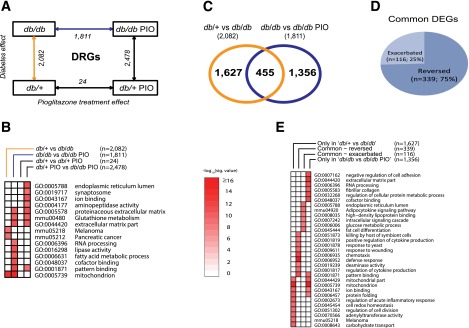
Assessment of differential gene expression in DRGs. RNA samples obtained from mouse DRGs were analyzed for differential gene expression using Affymetrix GeneChip microarrays. A: A comparison scheme between DEG sets (IBMT FDR <5% as the significance cutoff). The number of DEGs at each comparison is noted under the arrows. B: To examine the biological functions enriched among the DEG sets in A (four complete DEG sets), a functional enrichment analysis using DAVID was performed. The top 10 significant functional terms within each DEG set are represented in a heat map with a −log10(Benjamini-Hochberg corrected P value) color gradient. C: A Venn diagram illustrates the overlap between the db/+ vs. db/db DEG set, representing the T2DM effect (orange line in A), and the db/db vs. db/db PIO DEG set, representing the pioglitazone treatment effect in the context of diabetes (blue line in A). D: A pie chart further divides the common 455 genes from C into two groups depending on the directionality of the gene expression change by pioglitazone treatment, including reversed DEGs (n = 339), whose dysregulated gene expression by T2DM was reversed by pioglitazone treatment, and exacerbated DEGs (n = 116), whose dysregulated gene expression by T2DM was further enhanced by the treatment. E: A functional enrichment analysis was performed on the four DEG sets shown in B and C (only in db/+ vs. db/db [n = 1,627]; common – exacerbated [n = 116]; common – reversed [n = 339]; only in db/db vs. db/db PIO [n = 1,356]). Nominal P value was used as the significance value. mmu, mus musculus; sig., significant.
As illustrated in Fig. 4D, expression levels of 75% (339 of 455) of the common DEGs were reversed by pioglitazone treatment (e.g., if diabetes increased expression, pioglitazone treatment decreased expression or vice versa). For the remaining 116 genes, pioglitazone treatment exacerbated gene expression in the same direction (Fig. 4D). The 20 most upregulated and 20 most downregulated genes in the four DEG subsets presented in Fig. 4C and D (339 reversed genes, 116 exacerbated genes, 1,627 genes unchanged by treatment, and 1,356 genes changed only by pioglitazone treatment) are listed in Supplementary Tables 4–7, respectively.
We then identified the overrepresented biological functions of the four DEG subsets by functional enrichment analysis (Fig. 4E). Focusing on those enriched among the 455 DEGs regulated by diabetes and altered by pioglitazone treatment, we determined that pioglitazone treatment exacerbated DEGs belonging to several functional enrichment groups, spanning fat cell differentiation, adipocytokine signaling, and HDL binding, with genes including adiponectin (Adipoq), leptin (Lep), Cd36 antigen (Cd36), and GPI-anchored HDL-binding protein 1 (Gpihbp1) (Supplementary Table 5). DEGs regulated by T2DM and reversed by pioglitazone treatment were highly enriched in functions related to defense response and regulation of cytokine production (Fig. 4E).
SCNs
In SCNs, 1,066 genes showed significant differential expression between the db/+ and db/db groups, whereas pioglitazone treatment significantly changed the expression of 4,537 and 1,182 genes in db/db and db/+ animals, respectively (Fig. 5A). The most highly enriched biological functions among the four DEG sets are shown in Fig. 5B, with the overlap among these sets summarized in Supplementary Table 8. As in DRGs, further analysis of the db/+ versus db/db and db/db versus db/db PIO DEG sets to examine the effect of pioglitazone treatment demonstrated that of the 1,066 DEGs between db/+ and db/db, 484 genes (45%) were also identified as DEGs between db/db and db/db PIO, whereas the remaining 582 genes were not affected by pioglitazone (Fig. 5C). Furthermore, 67% (323 of 484) of the common DEGs were reversed by pioglitazone treatment, whereas the expression of 161 DEGs was exacerbated by pioglitazone treatment (Fig. 5D). The 20 most upregulated and 20 most downregulated genes in these four SCN DEG sets are listed in Supplementary Tables 9–12.
Figure 5.
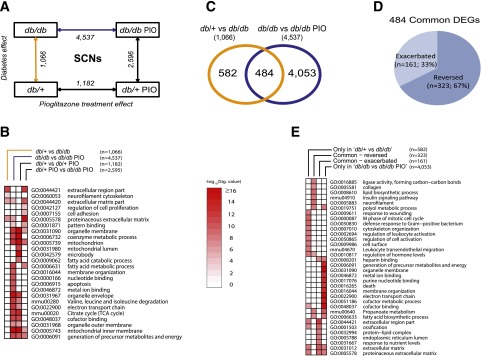
Assessment of differential gene expression in SCNs. RNA samples obtained from mouse SCNs were analyzed for differential gene expression using Affymetrix GeneChip microarrays. A: A comparison scheme between DEG sets (IBMT FDR <5% as the significance cutoff). The numbers of DEGs at each comparison are noted under the arrows. B: To examine the biological functions enriched among the DEG sets in A (four complete DEG sets), a functional enrichment analysis using DAVID was performed. The top 10 significant functional terms within each DEG set are represented in a heat map with a −log10(Benjamini-Hochberg corrected P value) color gradient. C: A Venn diagram illustrates the overlap between the db/+ vs. db/db DEG set, representing the T2DM effect (orange line in A), and the db/db vs. db/db PIO DEG set, representing the pioglitazone treatment effect in the context of T2DM (blue line in A). D: A pie chart further divides the common 484 genes from C into two groups depending on the directionality of the gene expression change by pioglitazone treatment, including reversed DEGs (n = 323), whose dysregulated gene expression by T2DM was reversed by pioglitazone treatment, and exacerbated DEGs (n = 161), whose dysregulated gene expression by T2DM was further enhanced by the treatment. E: A functional enrichment analysis was performed on the four DEG sets shown in B and C (only in db/+ vs. db/db [n = 582]; common – exacerbated [n = 161]; common – reversed [n = 323]; only in db/db vs. db/db PIO [n = 4,053]). Nominal P value was used as the significance value. mmu, mus musculus; Sig., significant; TCA, tricarboxylic acid.
Functional enrichment analysis identified the overrepresented biological functions of the four DEG sets, including the 323 reversed genes, 161 exacerbated genes, 582 genes unchanged by treatment, and 4,053 genes dysregulated only by pioglitazone treatment (Fig. 5E). Specifically, pioglitazone treatment exacerbated DEGs belonging to several functional enrichment groups, spanning protein-lipid complex, endoplasmic reticulum, and response to nutrient levels, with genes including apolipoprotein C-IV (Apoc4), apolipoprotein C-II (Apoc2), and Gpihbp1 (Supplementary Table 11). Alternatively, DEGs regulated by T2DM and reversed by pioglitazone treatment were highly enriched in functions related to collagen, lipid biosynthesis, insulin signaling, neurofilament, and polyol pathway (Fig. 5E).
Discussion
Large-scale clinical trials confirm that glucose control alone has little impact on DPN in individuals with T2DM (6), and recent clinical studies suggest that DPN in T2DM is more likely secondary to a constellation of metabolic imbalances that define the metabolic syndrome (25). In contrast, glucotoxicity appears to be more important in the pathogenesis of DN, regardless of diabetes type (7). Thus, the goal of the current study was to confirm that DN is positively affected by glycemic control in T2DM and to define the components of the metabolic syndrome responsible for DPN in a murine model of T2DM. This identification provides not only a first step in identifying modifiable risk factors but also a window into understanding the pathogenesis of DPN.
We chose to study the well-characterized db/db mouse, which by 6 weeks of age is hyperglycemic with hyperphagia and evidence of dyslipidemia. We (9,10) and others (1,26) have also reported that these mice exhibit microvascular complications associated with diabetes, including DPN, manifested as early-onset small (11) and later-onset large fiber neuropathy (9,10) as well as DN (27), retinopathy, and cardiomyopathy. Moreover, with age, these mice become obese with T2DM and severe dyslipidemia (28). In the current study, we treated db/db mice with pioglitazone, a commonly used TZD in man, with the goal of controlling certain, but not all, aspects of the metabolic syndrome. We show that 11 weeks of pioglitazone treatment, given from 5 to 16 weeks of age, results in morbid obesity in diabetic animals, but despite this significant weight gain, pioglitazone treatment normalized glycemic control (FBG and %GHb) and circulating triglycerides, but not insulin or cholesterol levels, to those of nondiabetic animals. These data agree with other studies demonstrating that weight gain is a significant adverse effect of various TZDs, including pioglitazone, rosiglitazone, and other PPAR agonists (29,30).
Examination of DN in db/db mice following pioglitazone treatment revealed that renal function and architecture are normalized with treatment. These results agree with data from multiple laboratories showing that pioglitazone ameliorates renal injury in T2DM rodents (reviewed in Ko et al. [7]). Similarly, we also reported that the TZD rosiglitazone ameliorates murine DN in T1DM, reduces renal and plasma markers of oxidative injury, and reverses urinary metabolite abnormalities (18).
In contrast to the beneficial effects of pioglitazone on DN, pioglitazone did not completely normalize DPN. We found that only small fiber neuropathy, assessed through IENFD and thermal latency measurements, was normalized with pioglitazone treatment in db/db animals, with no beneficial effects on large fiber function (NCVs). These results are especially interesting in light of the fact that pioglitazone normalized serum %GHb, total triglycerides, and VLDL triglycerides but had no effect on plasma cholesterol levels while promoting gross obesity. Collectively, these data suggest that small fiber neuropathy may be linked to systemic glycemic control and triglycerides, whereas large fiber neuropathy may be linked to systemic cholesterol and gross obesity. Others have reported beneficial effects of TZDs on DPN in T1DM mouse models, but results vary in T2DM rodent models. Yamagishi et al. (31) reported that pioglitazone is beneficial for DPN in streptozotocin-induced T1DM Wistar rats, improving both sciatic and sural NCVs. Troglitazone also improves tibial motor NCVs in streptozotocin-induced T1DM rats as well as morphometric measures of myelinated nerve fiber area and axon/myelin ratios (32). Alternatively, other groups reported results in T2DM rodents similar to our own, where TZD treatment normalizes glycemia but has little effect on measures of large fiber function (33,34). Similarly, both groups also reported that TZD treatment has no effect on elevated serum cholesterol levels and promotes animal obesity (33,34). The current data showing that TZD treatment restores small fiber function as measured by thermal latencies and IENFD have also been reported in neuropathic rodent models (35,36). Thus, in the absence of a beneficial effect on large fiber function, it appears that there would be no role for TZD treatments for DPN in man; however, TZD murine treatment paradigms have informed us of both the disease mechanisms and the differential susceptibility of fiber types to metabolic derangements.
As such, transcriptomic profiling of DRGs and SCNs in the current study to assess alterations associated with pioglitazone treatment offers important insight into the mechanisms underlying DPN in T2DM. Although the efficacy of pioglitazone treatment was limited to small fiber measures of DPN, pioglitazone reversed the diabetes-induced changes in 323 genes in SCNs, including genes related to collagen, lipid biosynthesis, insulin signaling, neurofilament, and the polyol pathway, suggesting the importance of SCN structure and energy homeostasis in small fiber neuropathy. Additionally, the 339 genes reversed by pioglitazone treatment in diabetic DRGs implicate local immune dysregulation in small fiber neuropathy. Previously, we reported that the PPAR signaling pathway is dysregulated in the SCNs of 24-week-old db/db mice with advanced DPN (20). Indeed, PPAR-γ itself is upregulated in db/db SCNs at 24 weeks (20), suggesting that PPAR-γ agonism through pioglitazone treatment in the current study may stimulate an already upregulated pathway in the db/db nerve, an observation that may contribute to the lack of effect of pioglitazone on large fiber DPN.
Alternatively, pathways exacerbated by pioglitazone treatment in SCNs and DRGs include protein-lipid complex and HDL binding, with the top upregulated genes being Gpihbp1 in both DRGs and SCNs, Apoc4 and Apoc2 in SCNs, and Cd36 in DRGs. Of note, HDL is involved in reverse cholesterol transport and has antioxidant and anti-inflammatory properties (37). Furthermore, class C apolipoproteins are expressed on the surface of HDLs in the fasting state (38), and mice in the current study were fasted. CD36 is a class B scavenger receptor that binds a number of ligands, including HDLs (39) and oxidized LDLs (40). Dysfunctional HDL signaling is linked to neuron and glial reactive oxygen species production and apoptosis (41). Moreover, pioglitazone treatment upregulated the oxidized LDL (lectin-like) receptor 1 gene (Olr1/LOX1) in db/db SCNs; we have previously reported oxLDL-mediated DRG neuron injury (17). Collectively, these data suggest a role for dysfunctional lipoprotein signaling and cholesterol in large fiber neuropathy in T2DM.
In addition to the exacerbating effect on diabetic changes in gene expression, pioglitazone treatment also affected >5,000 genes in db/db mice that were not affected by diabetes itself (Figs. 4E and 5E). These genes regulated only by pioglitazone in db/db mice were highly associated with mitochondrion in DRGs and with electron transport chain, generation of precursor metabolites and energy, and death in SCNs. Pioglitazone also increased expression of adipogenin (Adig), resistin (Retn), cell death–inducing DNA fragmentation factor α (DFFA) subunit-like effector A (Cidea), cell death–inducing DFFA-like effector C (Cidec), perilipin 5 (Plin5), and leptin, together suggesting local adipogenesis, with lipid accumulation and adipokine signaling (42). The epineurium contains resident adipocytes (43) that secrete paracrine adipokines (e.g., leptin) to modulate peripheral nerve activity (44). Furthermore, rosiglitazone stimulation of the PPAR-γ pathway upregulates adipocyte Cidea expression and increases lipid deposition (42). We propose that with these findings taken together, pioglitazone treatment enhances epineurial adipocyte lipid storage, likely affecting local lipid and protein trafficking to modulate peripheral nerve function.
The current murine data support local dysregulation of cholesterol-lipoprotein signaling and adipogenesis, with local lipid accumulation exacerbated by pioglitazone treatment. We contend that locally secreted factors from modified epineurial adipocytes negatively affect peripheral nerve function, contributing to the maintained large fiber dysfunction observed with pioglitazone treatment. We propose that the treatment effect on systemic glycemia and hypertriglyceridemia, superimposed on T2DM-mediated local mitochondrial dysfunction, is not sufficient to prevent large fiber nerve damage.
These results together with the accumulating published literature on rodent models of T2DM and DPN parallel observations in several large human clinical trials (reviewed in Callaghan et al. [6]). Collectively, these clinical studies strongly support the concept that hyperglycemia is not the singular metabolic derangement underlying DPN in T2DM in man, similar to the current results in mouse, and that abnormalities in other components of the metabolic syndrome contribute to nervous system damage. Indeed, multiple studies have reported that the incidence of DPN increases with increasing number of abnormal metabolic syndrome components (reviewed in Callaghan and Feldman [45]).
Of note, the current murine data suggest that both elevated cholesterol and obesity may be particularly instrumental in inciting nervous system damage. We contend that dyslipidemia and visceral adiposity in man form a network with insulin resistance, hypertension, and hyperglycemia to injure the peripheral nervous system, particularly myelinated large fibers. These murine data support that this network of metabolic impairments activates detrimental feed-forward cycles of local and systemic oxidative stress and dysregulated energy homeostasis with local mitochondrial dysfunction and inflammation, thus resulting in neural injury and DPN. In further support of this idea are the clinical studies showing that dyslipidemia is strongly correlated with DPN (46) and that lowering cholesterol, not glycemia, is significantly associated with decreasing lower-extremity amputations among patients with diabetes (47).
In summary, we report that glycemic control alone is not sufficient to ameliorate injury to large myelinated fibers in murine models of T2DM and DPN, likely because of the persistence of hypercholesterolemia as well as local neural dysfunctional lipoprotein signaling. These findings along with similar results in several large clinical trials in patients with T2DM and DPN collectively suggest that treatment of the metabolic syndrome as a whole and not just hyperglycemia is required to effectively target DPN in T2DM.
Supplementary Material
Article Information
Acknowledgments. The authors acknowledge the technical expertise of Chelsea Lindblad and Sang Su Oh in conducting animal experiments and Yu Hong for RNA processing, all at U-M. The authors also acknowledge the technical expertise of Hongyu Zhang and Jharna Saha (both at U-M) in performing the diabetic nephropathy phenotyping and analysis. The authors thank the Chemistry Core of the Michigan Diabetes Research and Training Center (930-DK-020572) at U-M for mouse %GHb measurements and Stacey Sakowski Jacoby at U-M for expert editorial advice.
Funding. Funding was provided by the National Institutes of Health (1DP3-DK-094292, 1R-24082841 to M.K., F.C.B., and E.L.F.), JDRF (postdoctoral fellowships to J.H. and L.M.H.), the American Diabetes Association, the Program for Neurology Research and Discovery, and the A. Alfred Taubman Medical Research Institute.
Duality of Interest. No potential conflicts of interest relevant to this article were reported.
Author Contributions. J.H. researched data and contributed to the writing of the manuscript. J.R.D. conducted animal experiments, performed RT-qPCR validation, and contributed to the writing of the manuscript. L.M.H. contributed to the discussion and writing of the manuscript. J.M.H. and C.B. conducted animal experiments. S.P., M.K., and F.C.B. designed the study, contributed to the discussion, and reviewed the manuscript. E.L.F. designed and directed the study and contributed to the discussion and writing of the manuscript. F.C.B. and E.L.F. are the guarantors of this work and, as such, had full access to all the data in the study and take responsibility for the integrity of the data and the accuracy of the data analysis.
Prior Presentation. Parts of this study were presented orally at the 74th Scientific Sessions of the American Diabetes Association, San Francisco, CA, 13–17 June 2014.
Footnotes
This article contains Supplementary Data online at http://diabetes.diabetesjournals.org/lookup/suppl/doi:10.2337/db15-0133/-/DC1.
References
- 1.Robertson DM, Sima AA. Diabetic neuropathy in the mutant mouse [C57BL/ks(db/db)]: a morphometric study. Diabetes 1980;29:60–67 [DOI] [PubMed] [Google Scholar]
- 2.Centers for Disease Control and Prevention National Diabetes Statistics Report: Estimates of Diabetes and Its Burden in the United States, 2014. Atlanta, GA, U.S. Department of Health and Human Services, 2014 [Google Scholar]
- 3.Hoyert DL, Xu J. Deaths: preliminary data for 2011. Natl Vital Stat Rep 2012;61:1–51 [PubMed] [Google Scholar]
- 4.Sahakyan K, Klein BE, Lee KE, Myers CE, Klein R. The 25-year cumulative incidence of lower extremity amputations in people with type 1 diabetes. Diabetes Care 2011;34:649–651 [DOI] [PMC free article] [PubMed] [Google Scholar]
- 5.Wu SC, Driver VR, Wrobel JS, Armstrong DG. Foot ulcers in the diabetic patient, prevention and treatment. Vasc Health Risk Manag 2007;3:65–76 [PMC free article] [PubMed] [Google Scholar]
- 6.Callaghan BC, Little AA, Feldman EL, Hughes RA. Enhanced glucose control for preventing and treating diabetic neuropathy. Cochrane Database Syst Rev 2012;6:CD007543. [DOI] [PMC free article] [PubMed] [Google Scholar]
- 7.Ko GJ, Kang YS, Han SY, et al. Pioglitazone attenuates diabetic nephropathy through an anti-inflammatory mechanism in type 2 diabetic rats. Nephrol Dial Transplant 2008;23:2750–2760 [DOI] [PubMed] [Google Scholar]
- 8.Alberti G, Zimmet P, Shaw J. The IDF Consensus Worldwide Definition of the Metabolic Syndrome. Brussels, Belgium, International Diabetes Federation, 2006 [Google Scholar]
- 9.O’Brien PD, Sakowski SA, Feldman EL. Mouse models of diabetic neuropathy. ILAR J 2014;54:259–272 [DOI] [PMC free article] [PubMed] [Google Scholar]
- 10.Sullivan KA, Hayes JM, Wiggin TD, et al. Mouse models of diabetic neuropathy. Neurobiol Dis 2007;28:276–285 [DOI] [PMC free article] [PubMed] [Google Scholar]
- 11.Cheng HT, Dauch JR, Hayes JM, Hong Y, Feldman EL. Nerve growth factor mediates mechanical allodynia in a mouse model of type 2 diabetes. J Neuropathol Exp Neurol 2009;68:1229–1243 [DOI] [PMC free article] [PubMed] [Google Scholar]
- 12.Tesch GH, Lim AK. Recent insights into diabetic renal injury from the db/db mouse model of type 2 diabetic nephropathy. Am J Physiol Renal Physiol 2011;300:F301–F310 [DOI] [PubMed] [Google Scholar]
- 13.Betz B, Conway BR. Recent advances in animal models of diabetic nephropathy. Nephron Exp Nephrol 2014;126:191–195 [DOI] [PubMed] [Google Scholar]
- 14.Hinder LM, Figueroa-Romero C, Pacut C, et al. Long-chain acyl coenzyme A synthetase 1 overexpression in primary cultured Schwann cells prevents long chain fatty acid-induced oxidative stress and mitochondrial dysfunction. Antioxid Redox Signal 2014;21:588–600 [DOI] [PMC free article] [PubMed] [Google Scholar]
- 15.Biessels GJ, van der Heide LP, Kamal A, Bleys RL, Gispen WH. Ageing and diabetes: implications for brain function. Eur J Pharmacol 2002;441:1–14 [DOI] [PubMed] [Google Scholar]
- 16.Brosius Laboratory (Ed.). Determination of Podocyte Number and Density in Rodent Glomeruli. Bethesda, MD, Animal Models of Diabetic Complications Consortium, 2008 [Google Scholar]
- 17.Vincent AM, Hayes JM, McLean LL, Vivekanandan-Giri A, Pennathur S, Feldman EL. Dyslipidemia-induced neuropathy in mice: the role of oxLDL/LOX-1. Diabetes 2009;58:2376–2385 [DOI] [PMC free article] [PubMed] [Google Scholar]
- 18.Zhang H, Saha J, Byun J, et al. Rosiglitazone reduces renal and plasma markers of oxidative injury and reverses urinary metabolite abnormalities in the amelioration of diabetic nephropathy. Am J Physiol Renal Physiol 2008;295:F1071–F1081 [DOI] [PMC free article] [PubMed] [Google Scholar]
- 19.Sanden SK, Wiggins JE, Goyal M, Riggs LK, Wiggins RC. Evaluation of a thick and thin section method for estimation of podocyte number, glomerular volume, and glomerular volume per podocyte in rat kidney with Wilms’ tumor-1 protein used as a podocyte nuclear marker. J Am Soc Nephrol 2003;14:2484–2493 [DOI] [PubMed] [Google Scholar]
- 20.Pande M, Hur J, Hong Y, et al. Transcriptional profiling of diabetic neuropathy in the BKS db/db mouse: a model of type 2 diabetes. Diabetes 2011;60:1981–1989 [DOI] [PMC free article] [PubMed] [Google Scholar]
- 21.Hur J, Sullivan KA, Pande M, et al. The identification of gene expression profiles associated with progression of human diabetic neuropathy. Brain 2011;134:3222–3235 [DOI] [PMC free article] [PubMed] [Google Scholar]
- 22.Dai M, Wang P, Boyd AD, et al. Evolving gene/transcript definitions significantly alter the interpretation of GeneChip data. Nucleic Acids Res 2005;33:e175. [DOI] [PMC free article] [PubMed] [Google Scholar]
- 23.Sartor MA, Tomlinson CR, Wesselkamper SC, Sivaganesan S, Leikauf GD, Medvedovic M. Intensity-based hierarchical Bayes method improves testing for differentially expressed genes in microarray experiments. BMC Bioinformatics 2006;7:538. [DOI] [PMC free article] [PubMed] [Google Scholar]
- 24.Huang W, Sherman BT, Lempicki RA. Systematic and integrative analysis of large gene lists using DAVID bioinformatics resources. Nat Protoc 2009;4:44–57 [DOI] [PubMed] [Google Scholar]
- 25.Cortez M, Singleton JR, Smith AG. Glucose intolerance, metabolic syndrome, and neuropathy. Handb Clin Neurol 2014;126:109–122 [DOI] [PubMed] [Google Scholar]
- 26.Sima AA, Robertson DM. Peripheral neuropathy in mutant diabetic mouse [C57BL/Ks (db/db)]. Acta Neuropathol 1978;41:85–89 [DOI] [PubMed] [Google Scholar]
- 27.Cohen MP, Clements RS, Hud E, Cohen JA, Ziyadeh FN. Evolution of renal function abnormalities in the db/db mouse that parallels the development of human diabetic nephropathy. Exp Nephrol 1996;4:166–171 [PubMed] [Google Scholar]
- 28.Kobayashi K, Forte TM, Taniguchi S, Ishida BY, Oka K, Chan L. The db/db mouse, a model for diabetic dyslipidemia: molecular characterization and effects of Western diet feeding. Metabolism 2000;49:22–31 [DOI] [PubMed] [Google Scholar]
- 29.Cariou B, Charbonnel B, Staels B. Thiazolidinediones and PPARγ agonists: time for a reassessment. Trends Endocrinol Metab 2012;23:205–215 [DOI] [PubMed] [Google Scholar]
- 30.Zhou L, Liu G, Jia Z, et al. Increased susceptibility of db/db mice to rosiglitazone-induced plasma volume expansion: role of dysregulation of renal water transporters. Am J Physiol Renal Physiol 2013;305:F1491–F1497 [DOI] [PMC free article] [PubMed] [Google Scholar]
- 31.Yamagishi S, Ogasawara S, Mizukami H, et al. Correction of protein kinase C activity and macrophage migration in peripheral nerve by pioglitazone, peroxisome proliferator activated-gamma-ligand, in insulin-deficient diabetic rats. J Neurochem 2008;104:491–499 [DOI] [PubMed] [Google Scholar]
- 32.Qiang X, Satoh J, Sagara M, et al. Inhibitory effect of troglitazone on diabetic neuropathy in streptozotocin-induced diabetic rats. Diabetologia 1998;41:1321–1326 [DOI] [PubMed] [Google Scholar]
- 33.Shibata T, Takeuchi S, Yokota S, Kakimoto K, Yonemori F, Wakitani K. Effects of peroxisome proliferator-activated receptor-alpha and -gamma agonist, JTT-501, on diabetic complications in Zucker diabetic fatty rats. Br J Pharmacol 2000;130:495–504 [DOI] [PMC free article] [PubMed] [Google Scholar]
- 34.Oltman CL, Davidson EP, Coppey LJ, et al. Vascular and neural dysfunction in Zucker diabetic fatty rats: a difficult condition to reverse. Diabetes Obes Metab 2008;10:64–74 [DOI] [PubMed] [Google Scholar]
- 35.Jain V, Jaggi AS, Singh N. Ameliorative potential of rosiglitazone in tibial and sural nerve transection-induced painful neuropathy in rats. Pharmacol Res 2009;59:385–392 [DOI] [PubMed] [Google Scholar]
- 36.Hempe J, Elvert R, Schmidts HL, Kramer W, Herling AW. Appropriateness of the Zucker diabetic fatty rat as a model for diabetic microvascular late complications. Lab Anim 2012;46:32–39 [DOI] [PubMed] [Google Scholar]
- 37.Tabet F, Rye KA. High-density lipoproteins, inflammation and oxidative stress. Clin Sci (Lond) 2009;116:87–98 [DOI] [PubMed] [Google Scholar]
- 38.Mahley RW, Innerarity TL, Rall SC Jr, Weisgraber KH. Plasma lipoproteins: apolipoprotein structure and function. J Lipid Res 1984;25:1277–1294 [PubMed] [Google Scholar]
- 39.Calvo D, Gómez-Coronado D, Suárez Y, Lasunción MA, Vega MA. Human CD36 is a high affinity receptor for the native lipoproteins HDL, LDL, and VLDL. J Lipid Res 1998;39:777–788 [PubMed] [Google Scholar]
- 40.Endemann G, Stanton LW, Madden KS, Bryant CM, White RT, Protter AA. CD36 is a receptor for oxidized low density lipoprotein. J Biol Chem 1993;268:11811–11816 [PubMed] [Google Scholar]
- 41.Keller JN, Hanni KB, Kindy MS. Oxidized high-density lipoprotein induces neuron death. Exp Neurol 2000;161:621–630 [DOI] [PubMed] [Google Scholar]
- 42.Puri V, Ranjit S, Konda S, et al. Cidea is associated with lipid droplets and insulin sensitivity in humans. Proc Natl Acad Sci U S A 2008;105:7833–7838 [DOI] [PMC free article] [PubMed] [Google Scholar]
- 43.Nowicki M, Kosacka J, Serke H, Blüher M, Spanel-Borowski K. Altered sciatic nerve fiber morphology and endoneural microvessels in mouse models relevant for obesity, peripheral diabetic polyneuropathy, and the metabolic syndrome. J Neurosci Res 2012;90:122–131 [DOI] [PubMed] [Google Scholar]
- 44.Murphy KT, Schwartz GJ, Nguyen NL, Mendez JM, Ryu V, Bartness TJ. Leptin-sensitive sensory nerves innervate white fat. Am J Physiol Endocrinol Metab 2013;304:E1338–E1347 [DOI] [PMC free article] [PubMed] [Google Scholar]
- 45.Callaghan B, Feldman E. The metabolic syndrome and neuropathy: therapeutic challenges and opportunities. Ann Neurol 2013;74:397–403 [DOI] [PMC free article] [PubMed] [Google Scholar]
- 46.Vincent AM, Hinder LM, Pop-Busui R, Feldman EL. Hyperlipidemia: a new therapeutic target for diabetic neuropathy. J Peripher Nerv Syst 2009;14:257–267 [DOI] [PMC free article] [PubMed] [Google Scholar]
- 47.Sohn MW, Meadows JL, Oh EH, et al. Statin use and lower extremity amputation risk in nonelderly diabetic patients. J Vasc Surg 2013;58:1578–1585 [DOI] [PMC free article] [PubMed] [Google Scholar]
Associated Data
This section collects any data citations, data availability statements, or supplementary materials included in this article.