

Determining non-liver-related mortality among HCV-infected individuals requires long-term follow-up of a nationally representative sample tested at baseline for HCV. This question can now be addressed using the NHANES III Linked Morality File that was recently released in 2010.
Abstract
Background. Liver-related mortality among those infected with hepatitis C virus (HCV) has been described, but little is known about non–liver-related mortality. Our objective was to determine HCV-associated all-cause, liver-, and non–liver-related mortality in the general US population.
Methods. A prospective cohort study of 9378 nationally representative adults aged 17–59 years was performed utilizing the Third National Health and Nutrition Examination Survey (NHANES III) Linked Mortality File that was made publicly available in 2010. HCV status was assessed from 1988 to 1994, with mortality follow-up of the same individuals through 2006.
Results. There were 614 deaths over a median follow-up of 14.8 years. After adjusting for all covariate risk factors, HCV chronic infection had a 2.37 times higher all-cause mortality rate ratio [MRR] (95% CI: 1.28–4.38; P = .008), a 26.46 times higher liver-related MRR (95% CI: 8.00–87.48; P < .001), and 1.79 times higher non–liver-related MRR (95% CI: .77–4.19; P = .18), compared with being HCV-negative. This represents an estimated 2.46 million US adults aged 17–59 years with chronic HCV infection who had an estimated 31,163 deaths from all causes per year, of which 57.8% (95% CI: 21.9%–77.2%) were attributable to HCV. Among those, there was an estimated 9569 liver-related deaths per year, of which 96.2% (95% CI: 87.5–98.9%) were attributable to HCV. Non–liver-related deaths were not significantly associated with HCV status.
Conclusions. Chronic HCV all-cause mortality is more than twice that of HCV-negative individuals. This suggests that those with chronic HCV infection are at a higher risk of death even after accounting for liver-related morbidity and should be closely monitored.
Hepatitis C virus (HCV) is a bloodborne infection that affects nearly 2.2% of the world’s population, or 130 million people [1]. Approximately 55%–85% of newly infected cases progress to chronicity; of those, 20%–30% will develop liver fibrosis, cirrhosis, and liver failure, and 2%–5% will advance to hepatocellular carcinoma [2–6].
In the United States, data from the Third National Health and Nutrition Examination Surveys (NHANES III) and 1999–2002 NHANES estimated that the number of persons positive for HCV antibodies (anti-HCV positive) increased from 3.9 million persons in 1988–1994 to 4.1 million in 1999–2002 [7, 8]. Over the same time period, the number of chronically infected persons (anti-HCV positive and HCV-RNA positive) increased from 2.7 million to 3.2 million. Population growth and the chronic nature of HCV are likely the main factors behind the increased prevalence despite prevention efforts (primarily motivated by human immunodeficiency virus [HIV] risk), which resulted in a drop in incident HCV cases from ∼230,000 per year in the 1980s to its current level of 19,000 cases per year [6]. Chronic HCV infection is currently the cause of 40% of all chronic liver disease (CLD) in the United States. Approximately 8000–10,000 CLD-related deaths occur annually, and HCV-associated end-stage liver disease is the leading indication for liver transplantation among adults [9–11].
Multiple studies have sought to quantify or project the burden of mortality from HCV. Data from the Centers for Disease Control and Prevention (CDC) estimated that an average of 12,000 HCV-related deaths from CLD occur each year [12]. Other studies produced more modest findings and ranged between 3340 and 7427 HCV-related deaths per year [13, 14]. These latter calculations were based on conservative estimates of deaths among individuals with CLD or HIV-infected patients with concurrent HCV infection, rather than a broadly representative sample of HCV-infected individuals from the US population.
Since HCV is predominantly asymptomatic and not routinely tested for in the general US population, it is difficult to quantify the overall long-term mortality burden, particularly among those without liver disease. However, the recent release in 2010 of the NHANES III Linked Mortality File with mortality follow-up through December 31, 2006, provides a unique opportunity to address this question. In this study, we evaluated the association of HCV status with all-cause and cause-specific mortality. Since mortality was ascertained in the same NHANES III participants over 12–18 years, this study is a true prospective cohort study among HCV-infected individuals in a representative sample of the general US population.
METHODS
Study Participants
Participants from the NHANES III survey aged ≥17 years at initial enrollment and with vital status follow-up data in 2006 were included in this analysis. NHANES III is a multistage probability survey conducted during 1988–1994 by the National Center for Health Statistics [15] designed to represent noninstitutionalized American civilians, which oversampled non-Hispanic blacks, Mexican Americans, and older adults [16]. Our initial analysis included all participants ≥17 years (n = 16,509), and was subsequently narrowed to only 9378 participants aged 17–59 years for whom HCV covariate risk factor information was available (including drug use and sexual activity data), and additional covariate-adjusted analyses could be performed. The University of Maryland School of Medicine Institutional Review Board formally reviewed this study and determined the secondary analysis of this de-identified data set to be exempt.
Study Variables
NHANES III survey and data collection procedures [15], and detailed descriptions of laboratory assays and quality control procedures are available elsewhere [17]. Briefly, NHANES included an interview, physical examination, and blood draw. Testing for antibody to HCV (anti-HCV) was performed using a second-generation enzyme immunoassay (EIA) and a supplemental test (EIA 2.0 and HCV MATRIX, Abbott Laboratories). HCV-RNA was tested on anti–HCV-positive samples using reverse-transcriptase-polymerase-chain reaction amplification of the 5′ noncoding region (Boehringer Mannheim) [7].
Body mass index (BMI, kg/m2) was calculated using measured height and weight. Self-reported number of alcoholic drinks over the previous 30 days of <30, 30–60, and >60 drinks, were classified as <1, 1–2, and >2 drinks/d, respectively. Participants self-reported age, sex, race/ethnicity (non-Hispanic white, non-Hispanic black, Mexican American, other), marital status, education, smoking status, lifetime number of sex partners, lifetime marijuana and cocaine use, and physician diagnosis of cancer and diabetes. Poverty income ratio was computed as the total family income divided by the poverty threshold based on year of interview, as defined by the US Census Bureau.
This analysis used the 2010 public-release NHANES III Linked Mortality File which included mortality follow-up through December 31, 2006, by probabilistic matching to National Death Index records using 12 identifying variables. Matching was validated via manual review of a subsample of death certificates. Cause of death was classified using the International Classification of Diseases, Ninth Revision [18], for deaths during 1988–1998, and using the International Statistical Classification of Diseases, 10th Revision (ICD-10) [19] for deaths during 1999–2006. Deaths during 1988–1998 were recoded based on ICD-10 causes. The primary outcome studied was all-cause mortality. Mortality ascribed to liver-related causes including malignant neoplasm of liver (code C22), viral hepatitis (codes B15–B19), alcoholic liver disease (code K70), and other chronic liver disease and cirrhosis (codes K73–K74) was a secondary outcome.
Statistical Analysis
To accommodate the complex survey design, we used the survey package of R software version 2.10.0 [20]. We calculated standard errors using linearization to account for stratification and clustering [21]. All estimates were weighted to represent the US population. Survey-weighted all-cause mortality rates and 95% confidence intervals (CI) stratified by HCV status, age, and sex were calculated for participants aged ≥17 years. A separate comparison for participants aged 17–59 years was made between anti-HCV negative, anti-HCV positive, and anti-HCV and HCV-RNA positive (chronic HCV infection), with respect to baseline characteristics using Wald χ2 tests or t-tests and all-cause mortality using weighted Kaplan-Meier survival curves and weighted Cox proportional hazards models [22]. Those who were anti-HCV positive but HCV-RNA negative were included with those who were anti-HCV positive and RNA positive (chronic HCV infection) under the “anti-HCV positive” group and were not analyzed as a separate group due to small numbers. Three models assessed associations of HCV status with mortality. First, we fit a model adjusted for age and sex, followed by a partially adjusted model that additionally included demographics (race/ethnicity, marital status, education, poverty income ratio), lifestyle behaviors (alcohol consumption, smoking, lifetime cocaine and marijuana use, lifetime number of sexual partners), BMI, and comorbidities and viruses (cancer, diabetes, hepatitis A antibody, hepatitis E antibody). Finally, we fit a fully adjusted model that additionally included liver function biomarkers (ALT and total bilirubin). We initially planned to adjust for hepatitis B virus surface antigen but excluded it due to data sparseness, given that only 45 participants tested positive for it among whom only 4 were also positive for anti-HCV, and only 3 were also positive for HCV-RNA. A sensitivity analysis showed that exclusion of HBV had negligible impact on model estimates (data not shown).
Results from the fully adjusted model were used to calculate expected survival. Weighted Cox proportional hazards models were also used to separately analyze liver-related and non–liver-related mortality. Due to small numbers of liver-related deaths, partial adjustment factors were age, sex, white race, poverty income ratio, alcohol consumption, smoking status, BMI, and number of comorbidities/viruses (sum of cancer, diabetes, hepatitis A antibody, hepatitis E antibody).
We calculated national estimates for the annual total number of deaths from all causes for those aged 17–59 years who were anti-HCV positive and those with chronic HCV infection. The estimates were calculated as weighted average annual mortality rates × N, where N was the estimated total population aged 17-59 years who were anti-HCV positive or chronically HCV-infected. We calculated the attributable risk percentage as (mortality rate ratio [MRR]-1)/MRR × 100 from the fully adjusted Cox models. We performed similar calculations for liver-related and non–liver-related deaths. All P-values were 2-sided; P < .05 was considered statistically significant.
While NHANES III did not collect data on HIV serostatus, which may confound the association between HCV and mortality, the NHANES III Linked Mortality File included HIV as a cause of death (codes B20–B24). As a sensitivity analysis, we reanalyzed the data by censoring deaths ascribed to HIV. Among those aged 17–59 years, we also compared covariates between those included and excluded due to missing HCV and covariate data.
RESULTS
Among 16,509 participants aged ≥17 years, 3853 deaths occurred over a median follow-up of 14.3 years (interquartile range 12.7–16.2 years). Seventy-seven (2.0%) deaths were ascribed to liver-related causes: malignant liver neoplasms (n = 24), viral hepatitis (n = 7), alcoholic liver disease (n = 17), and other chronic liver diseases (n = 29). Table 1 shows all-cause mortality rates by HCV status for those aged ≥ 17 years. There were 11.1 (95% CI:10.1–12.2), 14.8 (95% CI:9.9–22.1) and 16.5 (95% CI:10.5–26.0) deaths per 1000 person-years for anti-HCV negative, anti-HCV positive, and chronic HCV-infected individuals, respectively. Mortality was highest for chronically infected individuals and lowest for anti-HCV negative individuals for all subgroups defined by age and sex, except for men aged 17–29 years where mortality rates were similar.
Table 1.
All-Cause Mortality Rates of 16,509 Participants of NHANES III Aged ≥17 Years, by Hepatitis C Virus (HCV) Antibody and RNA Status
| HCV antibody negative |
HCV antibody positive (RNA positive and negative) |
HCV antibody positive and HCV RNA positive (chronic infection) |
||||
| n | Mortality rate (95% CI) deaths per 1000 person-years | n | Mortality rate (95% CI) deaths per 1000 person-years | n | Mortality rate (95% CI) deaths per 1000 person-years | |
| All participants | 16,157 | 11.1 (10.1–12.2) | 352 | 14.8 (9.9–22.1) | 279 | 16.5 (10.5–26.0) |
| Men | ||||||
| Total | 7535 | 11.6 (10.5–12.7) | 212 | 16.2 (9.9–26.3) | 174 | 17.1 (10.0–29.4) |
| 17–29 yr | 1971 | 2.3 (1.5–3.4) | 39 | 1.9 (0.6–6.2) | 33 | 2.3 (0.7–8.1) |
| 30–44 yr | 1934 | 2.3 (1.6–3.1) | 104 | 13.1 (6.7–25.6) | 92 | 15.7 (7.2–29.9) |
| 45–59 yr | 1255 | 11.2 (9.1–13.7) | 40 | 24.3 (10.4–56.9) | 31 | 36.2 (16.2–80.9) |
| ≥60 yr | 2375 | 54.2 (49.3–59.6) | 29 | 157.0 (98.0–251.7) | 18 | 200.6 (109.1–390.4) |
| Women | ||||||
| Total | 8622 | 10.6 (9.6–11.8) | 140 | 12.5 (6.9–22.7) | 105 | 15.3 (7.5–31.1) |
| 17–29 yr | 2267 | 1.2 (0.8–2.0) | 19 | 3.2 (0.7–15.5) | 13 | 4.9 (1.0–25.3) |
| 30–44 yr | 2441 | 1.8 (1.2–2.6) | 69 | 2.7 (1.2–6.4) | 53 | 3.2 (1.4–7.3) |
| 45–59 yr | 1418 | 8.5 (6.8–10.6) | 28 | 20.8 (6.9–62.9) | 21 | 22.4 (6.5–77.2) |
| ≥60 yr | 2496 | 43.4 (39.2–47.9) | 24 | 64.5 (34.8–119.7) | 18 | 83.4 (50.0–139.0) |
NOTE. CI, confidence interval.
Liver-related mortality rates (Table 2) for those aged ≥17 years were 0.16 (95% CI: .10–.25), 3.8 (95% CI:1.5–9.7), and 4.4 (95% CI:1.5–12.9) deaths per 1000 person-years for anti-HCV negative (58 deaths), anti-HCV positive (19 deaths), and chronically infected individuals (17 deaths), respectively.
Table 2.
Liver-Related Mortality Rates of 16,509 Participants of NHANES III Aged ≥17 Years, by Hepatitis C Virus (HCV) Antibody and RNA Status
| HCV antibody negative | HCV antibody positive (RNA positive and negative) | HCV antibody positive and HCV RNA positive (chronic infection) | |||||
|
n
|
Mortality rate (95% CI) deaths per 1000 person-years | n | Mortality rate (95% CI) deaths per 1000 person-years | n | Mortality rate (95% CI) deaths per 1000 person-years | ||
| All participants | 16,157 | 0.16 (0.10–0.25) | 352 | 3.8 (1.5–9.7) | 279 | 4.4 (1.5–12.9) | |
| Men | |||||||
| Total | 7535 | 0.20 (0.10–0.38) | 212 | 5.1 (1.8–15.1) | 174 | 5.5 (1.5–19.9) | |
| 17–59 yr | 5160 | 0.13 (0.05–0.31) | 183 | 4.1 (1.0–16.1) | 156 | 5.2 (1.3–20.6) | |
| ≥60 yr | 2375 | 0.60 (0.24–1.51) | 29 | 41.8 (17.9–97.8) | 18 | 24.5 (4.3–140.6) | |
| Women | |||||||
| Total | 8622 | 0.12 (0.06–0.22) | 140 | 1.4 (0.6–3.4) | 105 | 2.1 (0.9–4.7) | |
| 17–59 yr | 6126 | 0.06 (0.02–0.16) | 116 | 0.69 (0.21–2.28) | 87 | 1.0 (0.3–3.1) | |
| ≥60 yr | 2496 | 0.37 (0.17–0.82) | 24 | 9.1 (2.6–32.1) | 18 | 14.9 (4.8–46.0) | |
NOTE. CI, confidence interval.
In our covariate-adjusted analysis of the subset of 9378 participants aged 17–59 years, there were 614 deaths over a median follow-up of 14.8 years (interquartile range 13.3–16.4 y). Twenty-seven (4.4%) deaths in this age group were ascribed to liver-related causes: malignant liver neoplasms (n = 5), viral hepatitis (n = 6), alcoholic liver disease (n = 8), and other chronic liver diseases (n = 8). The chronically infected participants (N = 203) had 44 deaths, including 9 from liver-related causes. The remaining deaths were ascribed to HIV (n = 5), other infectious diseases (n = 2), cancer (n = 3), cardiovascular disease (n = 6), diabetes (n = 3), and other causes (n = 16). Participants who were anti-HCV positive (N = 251) had 6 additional deaths, for a total of 50 deaths (cancer [n = 3], cardiovascular disease [n = 3]).
The 17–59-year-olds included in analysis were younger, had a higher poverty income ratio, were more likely to be married, high school graduates, non-Hispanic white, and to have used cocaine compared with 17–59 year olds excluded from analysis (all P < .05). All other variables were similar between excluded and included participants (all P ≥ .05).
Table 3 shows that among participants aged 17–59 years, those who were anti-HCV positive, or chronically infected, were more likely to be male, non-Hispanic black, single, high-school drop-outs, current smokers, and anti-HIV positive (all P < .05) than those who were anti-HCV negative. Those who were anti-HCV negative also had higher incomes, fewer sexual partners, less marijuana or cocaine use, and lower ALT levels (all P < .001).
Table 3.
Baseline Characteristics of 9378 Participants of NHANES III Aged 17–59 Years, by Hepatitis C Virus (HCV) Antibody and RNA Status; Mean (Standard Error) or % (Standard Error)
| HCV antibody negative | HCV antibody positive (RNA positive and negative) |
HCV antibody positive and HCV RNA positive (chronic infection) |
|||
| Characteristic | n = 9127 | n = 251 | P value vs HCV antibody negative | n = 203 | P value vs HCV antibody negative |
| Age (years), mean | 36.0 (0.2) | 36.4 (0.9) | .69 | 36.8 (1.0) | .44 |
| Female, % | 52.1 (0.6) | 31.0 (4.1) | <.001 | 29.0 (5.2) | <.001 |
| Race/Ethnicity, % | |||||
| Non-Hispanic white | 75.9 (1.4) | 66.8 (4.8) | .007 | 63.9 (5.9) | .007 |
| Non-Hispanic black | 10.6 (0.6) | 18.2 (2.4) | 20.4 (3.2) | ||
| Mexican American | 10.4 (1.0) | 11.2 (2.6) | 10.6 (2.5) | ||
| Other | 3.2 (0.4) | 3.8 (2.2) | 5.0 (2.9) | ||
| Poverty income ratio, mean | 3.16 (0.07) | 2.01 (0.17) | <.001 | 1.84 (0.18) | <.001 |
| Married, % | 61.1 (1.1) | 40.3 (4.4) | <.001 | 38.1 (4.7) | <.001 |
| High school graduate, % | 80.0 (1.2) | 60.2 (4.3) | <.001 | 62.5 (4.5) | <.001 |
| Alcohol consumption, % | |||||
| <1 drinks/day | 91.1 (0.5) | 77.4 (5.6) | .10 | 72.8 (6.5) | .07 |
| 1–2 drinks/day | 7.0 (0.5) | 15.8 (4.4) | 19.2 (5.6) | ||
| >2 drinks/day | 1.9 (0.2) | 6.8 (4.7) | 8.0 (6.0) | ||
| Current smoker, % | 30.3 (1.0) | 64.2 (5.5) | <.001 | 69.9 (6.2) | <.001 |
| Lifetime no. of sex partners, % | |||||
| 0–1 | 24.6 (0.8) | 5.4 (1.5) | <.001 | 4.0 (1.7) | <.001 |
| 2–9 | 47.6 (0.9) | 33.1 (5.2) | 37.7 (5.9) | ||
| 10–49 | 23.5 (1.0) | 43.5 (5.4) | 41.6 (5.9) | ||
| ≥50 | 4.2 (0.5) | 18.0 (3.2) | 16.6 (0.3) | ||
| Lifetime marijuana use, % | |||||
| Never | 55.7 (1.3) | 20.3 (3.8) | <.001 | 18.8 (4.3) | <.001 |
| 1–99 times | 33.0 (1.0) | 27.2 (4.0) | 28.0 (4.5) | ||
| ≥100 | 11.3 (0.6) | 52.4 (5.1) | 53.2 (6.1) | ||
| Lifetime cocaine use, % | |||||
| Never | 87.0 (0.8) | 40.7 (5.6) | <.001 | 39.1 (6.4) | <.001 |
| 1–10 times | 7.6 (0.6) | 17.3 (4.8) | 14.5 (4.2) | ||
| >10 times | 5.4 (0.5) | 42.0 (6.4) | 46.4 (7.2) | ||
| Body Mass Index (kg/m2), mean | 26.3 (0.1) | 25.6 (0.5) | .22 | 25.5 (0.6) | .24 |
| ALT (U/L), mean | 17.9 (0.4) | 38.4 (2.2) | <.001 | 44.2 (3.0) | <.001 |
| Total bilirubin (mg/dL), mean | 0.62 (0.01) | 0.62 (0.04) | .85 | 0.64 (0.05) | .71 |
| Cancer, % | 3.7 (0.3) | 6.3 (3.1) | .28 | 8.0 (4.0) | .14 |
| Diabetes, % | 2.7 (0.3) | 3.4 (1.5) | .58 | 3.1 (1.5) | .77 |
| Hepatitis A virus antibody positive, % | 26.7 (1.2) | 35.1 (5.2) | .06 | 31.7 (5.8) | .34 |
| Hepatitis E virus IgG antibody positive, % | 19.2 (1.0) | 29.9 (5.0) | .02 | 31.6 (5.7) | .02 |
Table 4 shows that among individuals aged 17–59 years, the mortality rate was consistently highest among those who were chronically infected, followed by those who were anti-HCV positive, compared with those who were anti-HCV negative. After adjusting for all covariates except for liver function biomarkers, being anti-HCV positive was associated with a 2.34 times higher mortality rate (95% CI: 1.35–4.04, P = .004), a finding that was attenuated to 2.11 after adjusting for liver function biomarkers. The analogous mortality rate ratio (MRR) for those chronically infected was 2.65 (95% CI: 1.51–4.66, P = .001), which was attenuated to 2.37 after adjusting for liver function biomarkers. Figure 1 A shows that the estimated unadjusted 10-year mortality incidence was 3% for those who were anti-HCV negative, 10% for those who were anti-HCV positive, and 11% for those chronically infected; whereas Figure 1 B shows that the 10-year expected mortality incidence adjusted for covariates (covariates set at survey-weighted means) was 2% for those who are anti-HCV negative, 3% for those who were anti-HCV positive, and 4% for those who were chronically infected.
Table 4.
Association Between Hepatitis C Virus (HCV) Antibody/RNA Status and All-Cause Mortality Among 9378 NHANES Participants Aged 17–59 Years
| HCV antibody negative n = 9127 | HCV antibody positive (RNA positive and negative) n = 251 |
HCV antibody positive and HCV RNA positive (chronic infection) n = 203 |
|||
| MRR (95% CI)a | P value vs HCV antibody negative | MRR (95% CI)a | P value vs HCV antibody negative | ||
| All-cause mortality, no. | 564 | 50 | 44 | ||
| Age- and sex-adjusted | 1.00 [Reference] | 3.71 (2.25–6.13) | <.001 | 4.42 (2.59–7.54) | <.001 |
| Partially adjustedb | 1.00 [Reference] | 2.34 (1.35–4.04) | .004 | 2.65 (1.51–4.66) | .001 |
| Fully adjustedc | 1.00 [Reference] | 2.11 (1.18–3.75) | .01 | 2.37 (1.28–4.38) | .008 |
| Liver-related mortality, no. | 27 | 9 | 9 | ||
| Age- and sex-adjusted | 1.00 [Reference] | 40.27 (9.67–167.66) | <.001 | 53.62 (12.87–223.46) | <.001 |
| Partially adjustedd | 1.00 [Reference] | 26.02 (7.64–88.56) | <.001 | 36.40 (10.04–131.92) | <.001 |
| Fully adjustede | 1.00 [Reference] | 19.73 (6.42–60.57) | <.001 | 26.46 (8.00–87.48) | <.001 |
| Non–liver-related mortality, no. | 537 | 41 | 35 | ||
| Age- and sex-adjusted | 1.00 [Reference] | 2.74 (1.61–4.69) | <.001 | 3.12 (1.76–5.53) | <.001 |
| Partially adjustedb | 1.00 [Reference] | 1.66 (0.82–3.37) | .16 | 1.79 (0.83–3.88) | .14 |
| Fully adjustedc | 1.00 [Reference] | 1.62 (0.76–3.49) | .22 | 1.79 (0.77–4.19) | .18 |
Mortality rate ratio (95% confidence interval) versus HCV antibody negative.
Partial adjustment factors: demographics (age, sex, race/ethnicity, marital status, education, poverty income ratio), lifestyle factors (alcohol consumption, smoking status, lifetime cocaine and marijuana use, lifetime number of sexual partners), body mass index, and comorbidities/viruses (cancer, diabetes, hepatitis A antibody, hepatitis E antibody).
Full adjustment factors: partial adjustment factors, liver function biomarkers (ALT, total bilirubin).
Liver-related partial adjustment factors (due to small numbers): age, sex, white race, poverty income ratio, alcohol consumption, smoking status, body mass index, and number of comorbidities/viruses (sum of cancer, diabetes, hepatitis A antibody, hepatitis E antibody).
Liver-related full adjustment factors: liver-related partial adjustment factors, liver function biomarkers (ALT, total bilirubin).
Figure 1.
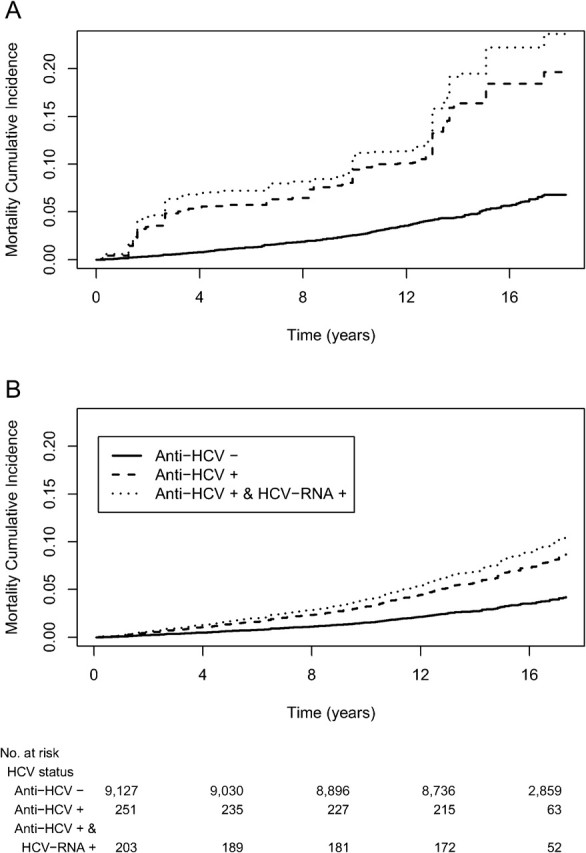
Survival probability by HCV status. Unadjusted survival probabilities from weighted Kaplan-Meier (A), and covariate-adjusted expected survival probabilities from weighted Cox proportional hazards models (B).
Table 4 additionally shows mortality rate ratio (MRR) separately for liver-related deaths and non–liver-related deaths for participants aged 17–59 years. After adjusting for all covariates except for liver function biomarkers, anti-HCV positive participants had a liver-related MRR of 26.02 (95% CI: 7.64–88.56, P < .001), which was attenuated to 19.73 after adjusting for liver function biomarkers. Chronically infected participants had a liver-related MRR of 36.40 (95% CI: 10.04–131.9, P < .001), which was attenuated to 26.46 after full adjustment. HCV status was not significantly associated with non–liver-related mortality after partial and full covariate adjustment (P > .10).
After generalizing to the US population, the estimated total population size of 17–59-year-olds who were anti-HCV positive was 3.22 million. Table 5 shows that within this group there was an estimated 33,759 deaths per year from all causes occurring from 1988 to 1994 through 2006, of which, after adjusting for all covariates, 52.6% (95% CI: 15.2%–73.3%) were attributable to the presence of anti-HCV. Similarly, the estimated total population size of those aged 17–59 years and chronically infected was 2.46 million among whom an estimated 31,163 deaths per year occurred, of which 57.8% (95% CI: 21.9%–77.2%) were attributable to HCV infection. There was an estimate of 9569 liver-related deaths per year among those who were chronically infected, of which 96.2% (95% CI: 87.5%–98.9%) were attributable to HCV infection.
Table 5.
Number of Deaths and Percentage Attributable to Hepatitis C Virus (HCV) Among 9378 NHANES Participants Aged 17–59 Years
| HCV antibody positive |
HCV antibody positive and HCV RNA positive (chronic infection) |
|||
| Cause of death | Average annual no. of deathsa (95% CI) | Attributable risk percentageb (95% CI) | Average annual no. of deathsa (95% CI) | Attributable risk percentageb (95% CI) |
| All-cause | 33,759 (19,819–57,503) | 52.6 (15.2–73.3) | 31,163 (17,567–55,282) | 57.8 (21.9–77.2) |
| Liver-related | 9390 (2,557–34,482) | 94.9 (84.4–98.3) | 9569 (2,589–35,373) | 96.2 (87.5–98.9) |
| Non–liver-related | 24,369 (14,713–40,362) | 38.3 (−31.6 to 71.3) | 21,595 (12,564–37,116) | 44.1 (−29.9 to 76.1) |
NOTES. CI, confidence interval.
Calculated as weighted average annual mortality rates × N, where N was the estimated total population aged 17–59 years who were HCV-antibody positive (3.22 million) and HCV-antibody and HCV-RNA positive (2.46 million).
From fully adjusted Cox model: (MRR-1)/MRR ×100.
When deaths ascribed to HIV were treated as censored, all-cause mortality MRRs for anti-HCV were attenuated by 2%–4%, but all were still statistically significant. Similarly, all-cause mortality MRRs for anti-HCV and HCV-RNA were attenuated by 3%–6%, but all were still statistically significant.
DISCUSSION
Using data from a large representative sample of US adults enrolled in the NHANES III study in 1988–1994, and followed up until 2006, we found that all-cause and liver-related mortality among adults with positive anti-HCV antibodies, and those with chronic HCV infection was higher than those who were anti-HCV negative. Our reported liver-related deaths were 9569 per year, which is consistent with other estimates that ranged between 12,000 annual HCV-related deaths estimated by the CDC and 3340–7427 deaths per year in other studies [12–14, 23]. The lower estimates in these latter studies may be explained by (1) their narrow definition of HCV-related deaths that depend on coexisting CLD or HIV as the cause of death; and (2) our more inclusive definition that incorporated ICD codes for liver-related malignant neoplasms, viral hepatitis, and alcoholic liver disease.
Our reported deaths from all-causes, however, were much higher than those of previous studies [24–27]. A study in the United Kingdom following HCV-infected patients at secondary care centers found a 3-fold higher mortality than the general English population, but no difference in non–liver-related deaths [24, 25]. Another report from Switzerland followed HCV-infected patients attending secondary and tertiary care centers for 2 years and found no excess mortality compared with the general Swiss population after adjusting for lifestyle factors, HIV, and other diseases [26]. Another study of transfusion recipients showed no increase in all-cause mortality among HCV-infected patients compared with uninfected controls [27].
However, it is plausible that our findings may still underestimate both the true all-cause and liver-related mortality burden. NHANES III participants were informed of their infection after HCV testing and had the opportunity to (1) seek better medical care and follow-up; (2) benefit from improved therapeutic modalities and better harm reduction initiatives that were adopted since their enrollment; and (3) appropriately manage other comorbidities such as HIV coinfection, all of which may have greatly reduced their mortality. Furthermore, NHANES III results are only generalizable to noninstitutionalized individuals and likely underestimate mortality among institutionalized individuals. A study of US correctional facilities (prisons and jail systems) found that HCV infection among inmates was more than 10-fold higher than in the general US population [28].
Most of the non–liver-related deaths in our study were ascribed to HIV, cardiovascular diseases, diabetes, and other causes, although they were not significantly associated with HCV. This is biologically plausible given that several studies describe an association between HCV and diabetes [29, 30], and between HCV and coronary and carotid artery atherosclerosis [31–34]. Non–liver-related deaths may also be due to other factors such as high-risk behaviors, lower socioeconomic status (as reflected by significantly lower poverty index), barriers to accessing health care, and genetic predisposition. This last point is illustrated in a study of siblings of HIV/HCV–coinfected patients that showed higher mortality in this group compared with siblings of either HIV monoinfected patients or control subjects [35, 36].
Few studies have attempted to examine long-term excess mortality due to HCV infection, particularly non–liver-related mortality [24–27]. To our knowledge, only one other study in the United States described significant excess liver-related and non–liver-related mortality among anti-HCV positive blood donors compared with a matched sample of anti-HCV negative donors over a mean follow-up period of 7.7 years [37]. Although this study sample is not representative of the general US population, it is more similar to our study in that the participants were not previously aware of their HCV infection, and hence HCV-positive individuals without any known liver morbidity could be included. Their inclusion of a large number of HCV-positive individuals (>10,000) may explain their significantly higher non–liver-related mortality.
Our current study had many strengths including a large representative sample of US adults with no prior knowledge of their HCV status, objectively measured HCV antibody and HCV RNA, a long follow-up period, and validation using multiple analysis techniques. Some limitations should be noted when interpreting study results. First, while the mortality was prospectively assessed, NHANES III was an observational study; therefore, the potential exists for unmeasured or excluded confounding factors. We attempted to mitigate this possibility by controlling for many known confounders and performing sensitivity analyses. Second, this study relied on self-reported data for behaviors and comorbidities. Third, non–liver-related deaths may have been overestimated due to underlying undiagnosed liver disease. Conversely, unknown antiviral treatment or liver transplantation may have lowered liver disease mortality, especially in the latter years of the study. Lastly, the fully adjusted analyses were limited to those who provided complete data on high-risk covariates; however, sensitivity analyses showed robust study conclusions.
In conclusion, this study suggests that mortality among HCV-infected individuals in the general US population is higher than previously described. Given these findings, and the greater availability and affordability of various HCV testing methods, perhaps increased testing, earlier therapy, and closer monitoring of all HCV-positive individuals, particularly those with non–liver-related morbidities, should be considered by health care providers.
Acknowledgments
Potential conflicts of interest. All authors: No reported conflicts.
All authors have submitted the ICMJE Form for Disclosure of Potential Conflicts of Interest. Conflicts that the editors consider relevant to the content of the manuscript have been disclosed in the Acknowledgments section.
References
- 1.Global Burden Of Hepatitis C Working Group. Global burden of disease (GBD) for hepatitis C. J Clin Pharmacol. 2004;44:20–9. doi: 10.1177/0091270003258669. [DOI] [PubMed] [Google Scholar]
- 2.Heintges T, Wands JR. Hepatitis C virus: epidemiology and transmission. Hepatology. 1997;26:521–6. doi: 10.1002/hep.510260338. [DOI] [PubMed] [Google Scholar]
- 3.Kenny-Walsh E. Clinical outcomes after hepatitis C infection from contaminated anti-D immune globulin. Irish Hepatology Research Group. N Engl J Med. 1999;340:1228–33. doi: 10.1056/NEJM199904223401602. [DOI] [PubMed] [Google Scholar]
- 4.Shakil AO, Conry-Cantilena C, Alter HJ, et al. Volunteer blood donors with antibody to hepatitis C virus: clinical, biochemical, virologic, and histologic features. The Hepatitis C Study Group. Ann Intern Med. 1995;123:330–7. doi: 10.7326/0003-4819-123-5-199509010-00002. [DOI] [PubMed] [Google Scholar]
- 5.Vogt M, Lang T, Frosner G, et al. Prevalence and clinical outcome of hepatitis C infection in children who underwent cardiac surgery before the implementation of blood-donor screening. N Engl J Med. 1999;341:866–70. doi: 10.1056/NEJM199909163411202. [DOI] [PubMed] [Google Scholar]
- 6.Wasley A, Grytdal S, Gallagher K. Surveillance for acute viral hepatitis–United States, 2006. MMWR Surveill Summ. 2008;57:1–24. [PubMed] [Google Scholar]
- 7.Alter MJ, Kruszon-Moran D, Nainan OV, et al. The prevalence of hepatitis C virus infection in the United States, 1988 through 1994. N Engl J Med. 1999;341:556–62. doi: 10.1056/NEJM199908193410802. [DOI] [PubMed] [Google Scholar]
- 8.Armstrong GL, Wasley A, Simard EP, McQuillan GM, Kuhnert WL, Alter MJ. The prevalence of hepatitis C virus infection in the United States, 1999 through 2002. Ann Intern Med. 2006;144:705–14. doi: 10.7326/0003-4819-144-10-200605160-00004. [DOI] [PubMed] [Google Scholar]
- 9.Verna EC, Brown RS., Jr Hepatitis C virus and liver transplantation. Clin Liver Dis. 2006;10:919–40. doi: 10.1016/j.cld.2006.08.012. [DOI] [PubMed] [Google Scholar]
- 10.National Institutes of Health Consensus Development Conference Panel statement: management of hepatitis C. Hepatology. 1997;26(3 Suppl 1):2S–10. doi: 10.1002/hep.510260701. [DOI] [PubMed] [Google Scholar]
- 11.Hoofnagle JH. Hepatitis C: the clinical spectrum of disease. Hepatology. 1997;26(3 Suppl 1):15S–20. doi: 10.1002/hep.510260703. [DOI] [PubMed] [Google Scholar]
- 12.Centers for Disease Control and Prevention. Statistics and surveillance: Disease burden from viral Hepatitis A, B, and C in the United States. 2009. Available at: http://www.cdc.gov/hepatitis/statistics.htm. Accessed 2 May 2011. [Google Scholar]
- 13.Manos MM, Leyden WA, Murphy RC, Terrault NA, Bell BP. Limitations of conventionally derived chronic liver disease mortality rates: results of a comprehensive assessment. Hepatology. 2008;47:1150–7. doi: 10.1002/hep.22181. [DOI] [PubMed] [Google Scholar]
- 14.Wise M, Bialek S, Finelli L, Bell BP, Sorvillo F. Changing trends in hepatitis C-related mortality in the United States, 1995–2004. Hepatology. 2008;47:1128–35. doi: 10.1002/hep.22165. [DOI] [PubMed] [Google Scholar]
- 15.National Center for Health Statistics, Centers for Disease Control and Prevention Web Site. National Health and Nutrition Examination Survey. Available at: http://www.cdc.gov/nchs/nhanes/nh3data.htm. Accessed 2 May 2011.
- 16.Ezzati TM, Massey JT, Waksberg J, Chu A, Maurer KR. Sample design: Third National Health and Nutrition Examination Survey. Vital Health Stat 2. 1992:;(113):1–35. [PubMed] [Google Scholar]
- 17.Gunter EW, Lewis BL, Koncikowski SM. Laboratory methods used for the third National Health and Nutrition Examination Survey (NHANES III), 1988–1994. Atlanta, GA: National Center for Environmental Health, Centers for Disease Control and Prevention, Public Health Service, US Department of Health and Human Services; 1996. [Google Scholar]
- 18.United States. Health Care Financing Administration. The International classification of diseases, 9th revision, clinical modification: ICD-9-CM. 4th ed. Washington, DC: US Dept of Health and Human Services, Public Health Service For sale by the Supt. of Docs., US GPO; 1991. [Google Scholar]
- 19.World Health Organization; WHO Collaborating Centres for Classification of Diseases. International statistical classification of diseases and related health problems. 10th revision ed. Geneva: World Health Organization; 1992. [Google Scholar]
- 20.R Development Core Team. R: a language and environment for statistical computing. Vienna, Austria: R Foundation for Statistical Computing; 2006. [Google Scholar]
- 21.Korn EL, Graubard BI. Analysis of health surveys. New York, NY: Wiley; 1999. [Google Scholar]
- 22.Binder DA. Fitting Cox's proportional hazards models from survey data. Biometrika. 1992;79:139–47. [Google Scholar]
- 23.Vong S, Bell BP. Chronic liver disease mortality in the United States, 1990–1998. Hepatology. 2004;39:476–83. doi: 10.1002/hep.20049. [DOI] [PubMed] [Google Scholar]
- 24.Mohsen AH. The epidemiology of hepatitis C in a UK health regional population of 5.12 million. Gut. 2001;48:707–13. doi: 10.1136/gut.48.5.707. [DOI] [PMC free article] [PubMed] [Google Scholar]
- 25.Neal KR, Ramsay S, Thomson BJ, Irving WL. Excess mortality rates in a cohort of patients infected with the hepatitis C virus: a prospective study. Gut. 2007;56:1098–104. doi: 10.1136/gut.2006.113217. [DOI] [PMC free article] [PubMed] [Google Scholar]
- 26.Prasad L, Spicher VM, Negro F, Rickenbach M, Zwahlen M. Little evidence that hepatitis C virus leads to a higher risk of mortality in the absence of cirrhosis and excess alcohol intake: the Swiss Hepatitis C Cohort Study. J Viral Hepat. 2009;16:644–9. doi: 10.1111/j.1365-2893.2009.01113.x. [DOI] [PubMed] [Google Scholar]
- 27.Seeff LB, Hollinger FB, Alter HJ, et al. Long-term mortality and morbidity of transfusion-associated non-A, non-B, and type C hepatitis: a National Heart, Lung, and Blood Institute collaborative study. Hepatology. 2001;33:455–63. doi: 10.1053/jhep.2001.21905. [DOI] [PubMed] [Google Scholar]
- 28.Hammett TM, Harmon MP, Rhodes W. The burden of infectious disease among inmates of and releasees from US correctional facilities, 1997. Am J Public Health. 2002;92:1789–94. doi: 10.2105/ajph.92.11.1789. [DOI] [PMC free article] [PubMed] [Google Scholar]
- 29.Mason AL, Lau JY, Hoang N, et al. Association of diabetes mellitus and chronic hepatitis C virus infection. Hepatology. 1999;29:328–33. doi: 10.1002/hep.510290235. [DOI] [PubMed] [Google Scholar]
- 30.Mehta SH, Brancati FL, Sulkowski MS, Strathdee SA, Szklo M, Thomas DL. Prevalence of type 2 diabetes mellitus among persons with hepatitis C virus infection in the United States. Ann Intern Med. 2000;133:592–9. doi: 10.7326/0003-4819-133-8-200010170-00009. [DOI] [PubMed] [Google Scholar]
- 31.Haji SA, Starling RC, Avery RK, et al. Donor hepatitis-C seropositivity is an independent risk factor for the development of accelerated coronary vasculopathy and predicts outcome after cardiac transplantation. J Heart Lung Transplant. 2004;23:277–83. doi: 10.1016/S1053-2498(03)00148-7. [DOI] [PubMed] [Google Scholar]
- 32.Ishizaka N, Ishizaka Y, Takahashi E, et al. Association between hepatitis C virus seropositivity, carotid-artery plaque, and intima-media thickening. Lancet. 2002;359:133–5. doi: 10.1016/s0140-6736(02)07339-7. [DOI] [PubMed] [Google Scholar]
- 33.Vassalle C, Masini S, Bianchi F, Zucchelli GC. Evidence for association between hepatitis C virus seropositivity and coronary artery disease. Heart. 2004;90:565–6. doi: 10.1136/hrt.2003.018937. [DOI] [PMC free article] [PubMed] [Google Scholar]
- 34.Bedimo R, Westfall AO, Mugavero M, Drechsler H, Khanna N, Saag M. Hepatitis. C virus coinfection and the risk of cardiovascular disease among HIV-infected patients. HIV Med. 2010;11:462–8. doi: 10.1111/j.1468-1293.2009.00815.x. [DOI] [PubMed] [Google Scholar]
- 35.Hansen AB, Gerstoft J, Kronborg G, Pedersen C, Sorensen HT, Obel N. Mortality in siblings of patients coinfected with HIV and hepatitis C virus. J Infect Dis. 2007;195:230–5. doi: 10.1086/510246. [DOI] [PubMed] [Google Scholar]
- 36.Tillmann HL, Thursz M. Hepatitis C virus infection–its role in pathogenesis. J Infect Dis. 2007;195:168–70. doi: 10.1086/510250. [DOI] [PubMed] [Google Scholar]
- 37.Guiltinan AM, Kaidarova Z, Custer B, et al. Increased all-cause, liver, and cardiac mortality among hepatitis C virus-seropositive blood donors. Am J Epidemiol. 2008;167:743–50. doi: 10.1093/aje/kwm370. [DOI] [PMC free article] [PubMed] [Google Scholar]