
Fig. 7.
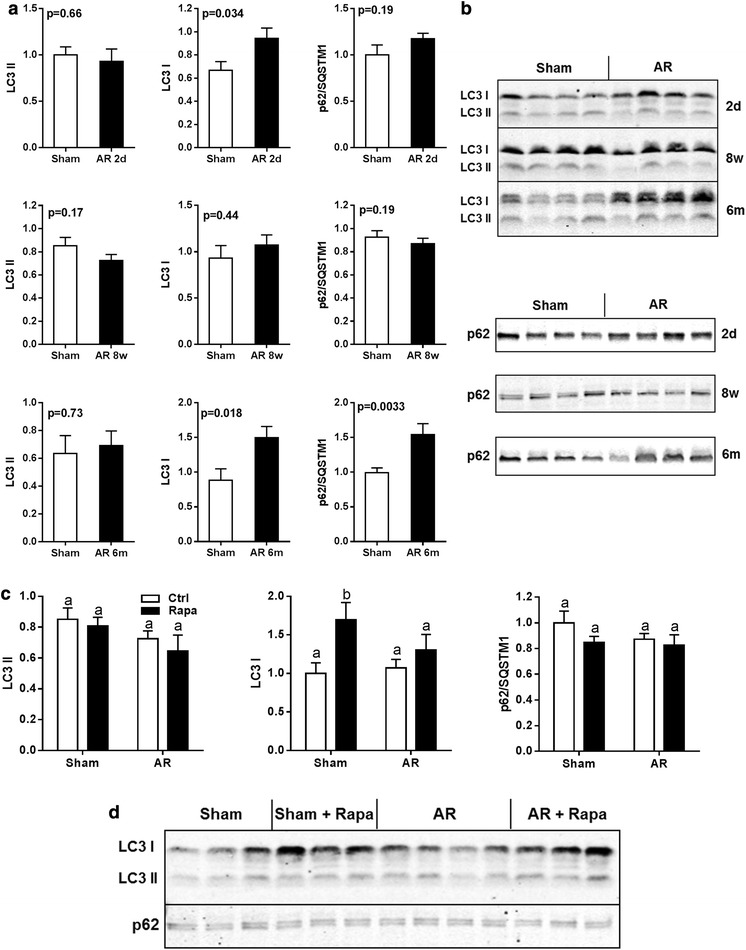
Autophagy markers in LV VO. LC3 and p62 protein contents were evaluated at various times post-AR induction (a, b) as well as the impact of rapamycin treatment (c, d). N = 9–12 animals per group. Values are expressed as mean ± SEM. Means not sharing a common superscript are significantly different from each other, P < 0.05