Abstract
Food refusal is a hallmark of exposure of experimental animals to the trichothecene mycotoxin deoxynivalenol (DON), a common foodborne contaminant. Although studies in the mouse suggest that DON suppresses food intake by aberrantly inducing the release of satiety hormones from enteroendocrine cells (EECs) found in the gut epithelium, the underlying mechanisms for this effect are not understood. To address this gap, we employed the murine neuroendocrine tumor STC-1 cell line, a widely used EEC model, to test the hypothesis that DON-induced hormone exocytosis is mediated by G protein-coupled receptor (GPCR)-mediated Ca2+ signaling. The results indicate for the first time that DON elicits Ca2-dependent secretion of cholecystokinin (CCK) and glucagon-like peptide-17-36 amide (GLP-1), hormones that regulate food intake and energy homeostasis and that are products of 2 critical EEC populations—I cells of the small intestine and L cells of the large intestine, respectively. Furthermore, these effects were mediated by the GPCR Ca2+-sensing receptor (CaSR) and involved the following serial events: (1)PLC-mediated activation of the IP3 receptor and mobilization of intracellular Ca2+ stores, (2) activation of transient receptor potential melastatin-5 ion channel and resultant L-type voltage-sensitive Ca2+ channel-facilitated extracellular Ca2+ entry, (3) amplification of extracellular Ca2+ entry by transient receptor potential ankyrin-1 channel activation, and finally (4) Ca2+-driven CCK and GLP-1 excytosis. These in vitro findings provide a foundation for future investigation of mechanisms by which DON and other trichothecenes modulate EEC function in ex vivo and in vivo models.
Keywords: mycotoxin, deoxynivalenol, CaSR, TRPA1, CCK, GLP-1
Deoxynivalenol (DON or vomitoxin) is a trichothecene mycotoxin produced by the fungus Fusarium graminearum following infestation of cereal grains in the field or during storage (Pestka, 2010). Frequently detected in wheat, barley, and corn, DON elicits a range of acute and chronic adverse effects in experimental animals that include anorexia, nausea, emesis, neuroendocrine changes, growth suppression, weight loss, and immunotoxicity (Maresca, 2013). DON’s capacity to evoke anorectic responses and consequent potential to interfere with growth of children and young animals are critical concerns from a public health perspective. These adverse effects were the basis for determining the tolerable daily intake for DON (Canady et al., 2001) that has been used to define regulatory limits for this mycotoxin in food (EFSA, 2013).
Appetite and food intake are normally controlled by both central and peripheral factors that influence the balance of anor exigenic and orexigenic signaling in the brain (Schwartz, 2006). In the mouse, oral exposure to DON rapidly upregulates the expression of specific components of the anorexigenic response in hypothalamic neurons of the brain, including the pro-opiomelanocortin (POMC), melanocortin 4 receptor (MC4R), and cocaine amphetamine-regulated transcript (Girardet et al., 2011a,b). A potential upstream mechanism for elevated expression of these hypothalamic anorexigenic hormones is increased secretion of the gut satiety peptides by enteroendocrine cells (EEC) of the gastrointestinal (GI) tract (Moran-Ramos et al., 2012; Steinert et al., 2013).
The EEC is a primary intestinal cell subtype that, along with enterocytes, goblet, and Paneth cells derived from intestinal stem cells populates the epithelial layer of the GI tract (Moran-Ramos et al., 2012). Although EECs comprise only ∼1% of all gut epithelial cells, as a whole they represent one of the largest endocrine organs in the body, making them a central target for toxins entering the gut. At least 15 regionally associated EEC lineages have been described that are generated from a common neurogenin3-positive secretory progenitor population. A paramount function of EECs is to sense nutrients of the gut lumen and respond by secreting a range of peptide and amine hormones. These hormones control numerous digestive and physiologic functions, including food intake, postmeal gastric secretion, gut motility, energy expenditure, and maintenance of glucose levels by acting peripherally on adjacent cells and afferent enteric neurons and/or on distal cells of the central nervous system (Gribble, 2012; Reimann et al., 2012; Tolhurst et al., 2012).
Cholecystokinin (CCK), peptide YY3-36 (PYY3-36), and glucagon-like peptide-17-36 amide (GLP-1) are examples of satiety hormones secreted by EEC. CCK is produced by I cells, an EEC population found in the jejunum and ileum, that elicits short-term, diminished food consumption by upregulating POMC and MC4R expression (Dockray, 2009). Both peripheral and central administration of CCK to animals causes decreased food consumption. PYY3-36 is produced by L-cells, an EEC population that populates the lower GI tract including the distal ileum and colon (Karra and Batterham, 2010). This hormone both upregulates anorexigenic and downregulates orexigenic signaling molecules within the brain, inducing satiety in many species including humans, nonhuman primates, and rodents. GLP-1 is another hormone of L-cell origin that is secreted in response to a meal and evokes satiety (Williams et al., 2009). Several recent investigations by our laboratory support the contention that EEC-derived gut satiety hormones contribute to DON’s anorectic effects in mice. Importantly, both oral and IP administration of DON in mice dose-dependently induces rapid (≤15 min) elevations in plasma CCK and PYY3-36 with concurrent food refusal (Flannery et al., 2012; Wu et al., 2014). Subsequent experiments with specific pharmacologic antagonists to CCK and PYY receptors attenuate this effect, thus further indicating that these hormones are upstream mediators of DON-induced anorexigenic signaling in the hypothalamus.
Although in vivo studies have established that DON suppresses food intake by inducing the aberrant release of hormones originating from EEC, the upstream mechanisms for this effect are not understood. Recent investigations have demonstrated that a variety of G protein-coupled receptors (GPCRs) are present in EEC that function as chemosensors of the gut luminal content (Liou ,2013; Reimann et al., 2012). The goal of this research study was to test the hypothesis that DON induces hormone exocytosis in EEC by GPCR-mediated Ca2+ signaling. To achieve this goal, we employed a widely used EEC model, the murine neuroendocrine tumor STC-1 cell (Hira et al., 2008; Kurogi et al., 2012; Shah et al., 2012), that exhibits characteristics of both duodenal I-cells (ie, secretes CCK) and ileal-colonic L-cells (ie, secretes GLP-1) (Geraedts et al., 2011). Our primary focus was to determine DON’s short-term (15–45 min) effects (ie, intracellular calcium increase and hormone secretion) in this enteroendocrine model that would be indicative of an intestinal chemical defense response (eg, food refusal) observed in vivo in the mouse (Flannery et al., 2012; Wu et al., 2014). The results suggest that DON induces secretion of both hormones from STC-1 by activating the GPCR calcium-sensing receptor (CaSR) as well as a unique downstream pathway involving transient receptor potential melastatin-5 ion channel (TRPM-5) and transient receptor potential ankyrin-1 (TRPA1).
MATERIALS AND METHODS
Chemicals
DON (>98.00% purity) and all other chemicals were purchased from Sigma-Aldrich (St. Louis, Missouri) unless otherwise indicated. Tocris Bioscience (Minneapolis, Minnesota) was the source of EGTA, a Ca2+ chelator; U73122, a phospholipase C inhibitor; 2-aminoethyl diphenyl-borinate (2-APB), an IP3 receptor antagonist; nitrendipine, an L-type voltage-sensitive Ca2+ channel (L-type VSCCs) blocker; triphenylphosphine oxide (TPPO), a selective inhibitor of the TRPM-5; NPS 568, a CaSR agonist; NPS 2143 and Calhex 231, CaSR antagonists; AITC, a TRPA1 agonist; and HC 030031 and A 967079, selective TRPA1 channel blockers. The concentrations for the various agonists and antagonists were selected based on supplier recommendations and preliminary experiments and were consistent with those used in previous reported cell culture studies.
Cell culture
The STC-1 cell line was kindly provided at the 25th passage by Dr Hanahan (University of California, San Francisco, California) via the ATCC culture collection (Manassas, Virginia). Cells were maintained in DMEM high glucose medium with L-glutamine, without sodium pyruvate supplemented with 10% (v/v) fetal bovine serum, 100 units/ml penicillin, 100 µg/ml streptomycin plus 25 µg/ml gentamicin (Life Technologies, Grand Island, New York) at 37°C in 5% CO2/air. Cells were routinely subcultured by trypsinization with 0.25% (w/v) trypsin-EDTA (Life Technologies) upon reaching 80%–90% confluence. Cells between 25 and 35 passages were used. Viability of cultures was tested by Trypan blue exclusion and MTT assay and/or Vybrant MTT Cell Proliferation Assay Kit (Life Technologies, Grand Island, New York).
Measurement of CCK and GLP-1 release
For determining DON’s effects on viability and hormone release, STC-1 cells were cultured in 24-well plates (2 × 10⁵ cells/well) until they reached 80%–90% confluence. Cell supernatant was removed and replaced with DON (0–5 mM) with or without antagonists dissolved in Hank’s balanced salts solution (HBSS) supplemented with 20 mM of HEPES and additional 4.5 mM D-glucose for final glucose concentration of 10 mM and incubated for indicated time intervals. Following treatment with DON, supernatants were collected and centrifuged at 1000 × g for 5 min at 4°C to remove cells. Hormone concentrations in cell culture supernatants were measured using a CCK (26-33) (nonsulfated) EIA Kit and GLP-1 (7-36)-amide EIA Kit from Phoenix Pharmaceuticals, Inc Burlingame, California), according to the manufacturer’s recommendations.
Assessment of [Ca2+]i by confocal microscopy
STC-1 cells were grown on Basement Membrane Matrix Gel (BD Biosciences, Bedford, Massachusetts)—coated Lab-Tek II chambered cover slides (Fisher Scientific, Pittsburgh, Pennsylvania). Slides were washed with HBSS and then stained with 2 µM Fluo-4 AM in bath solution consisting of HBSS supplemented with 20 mM of HEPES and additional 4.5 mM D-glucose for final glucose concentration of 10 mM for 30 min in dark at room temperature. Slides were then washed twice using bath solution, followed by addition of 1 ml bath solution. DON, agonists and/or antagonists were applied by pipette and then changes in intracellular Ca2+ were monitored using an Olympus Fluoview FV 1000 Confocal Laser Scanning Microscope (Olympus America Inc Center Valley, Pennsylvania). An Argon ion laser was used for fluorescence excitation at 488 nm. The fluorometric signals obtained were expressed as relative fluorescence change, ΔF/F = (F−F0)/F0, where F0 was the basal fluorescence level. Increases in fluorescence >10% above baseline were deemed positive responses.
RT-PCR analysis for TRPM5, TRPA1, and CaSR mRNA
Total RNA was purified from adherent monolayer of STC-1 cells in a 6-well culture plate with TRI Reagent solution (Life Technologies). RNA was subjected to reverse transcription with High Capacity RNA to cDNA Kit (Life Technologies) and purified with QIA quick PCR Purification Kit (Qiagen, Valencia, California). Resultant first-strand cDNA was used as a template for PCR. The following mouse-specific primer pairs were used: TRPM5: 5′-ACCTGGCCACTGAAGCTGAT-3′ and 5′-CCACCAGCAGGACATAGGTG-3′ (Staaf et al., 2010); CaSR: 5′-GAGCACATCCCTTCAACCATC-3′, 5′-AAGTCAATGCAGATGTCCCTCTC-3′ (Hira et al., 2008); and TRPA1: 5′-CATGATGTCACCCCTTCACATAG-3′ and 5′ACAGGGTAGTCTCCCCACT TA-3′ (Cattaruzza et al., 2010). PCR conditions were as follows: 1 cycle of 3 min at 94°C, 35 cycle each for 45 sec at 94°C, 30 sec at 55°C, 1 min 30 sec at 72°C and 1 cycle of 10 min at 72°C. PCR products were then separated on a 1% (w/v) agarose gel with 0.01% (w/v) ethidium bromide. PCR product sizes were 429, 320, and 216 bp for TRPM5, CaSR, and TRPA1, respectively.
Western blot analysis for TRPM5, CaSR, and TRPA1
Total proteins were extracted from adherent monolayers of STC-1 cells in a 100 mm culture plate by adding boiling lysis buffer consisting of 1% (w/v) SDS, 1 mM sodium orthovanadate and 10 mM Tris (pH 7.4). Cells were boiled in lysis buffer for 5 min, sonicated briefly and then centrifuged at 12 000 × g for 10 min at 4°C. The protein concentration of the resultant supernatant was determined with a BCA Protein Assay Kit (Thermo Scientific, Rockford, Illinois). Samples (40 µg protein) were resolved on a precast 4%–20% (w/v) polyacrylamide gel (Bio-Rad, Hercules, California) and the proteins were transferred to an Immobilon-FL membrane (Millipore, Billerica, Massachusetts). After blocking with Odyssey Blocking buffer (LI-COR, Lincoln, Nebraska) for 1 h at 25°C, membranes were incubated overnight at 4°C in LI-COR blocking buffer with goat polyclonal anti-TRPM5 (1:10 000) (NBP1-44059, Novus, Littleton, Colorado); rabbit polyclonal anti-CaSR of mouse, rat, and human origin (NBP1-19452, Novus) (1:1000) or rabbit polyclonal anti-TRPA1 (AB68847,Abcam, Cambridge, Massachusetts) (1:10 000). Blots were washed 3 times of 10 min with TBST buffer (50 mM Tris, 150 mM NaCl and 0.1% [v/v] Tween 20, PH7.5) and then incubated in blocking buffer containing either IRDye 800CM donkey anti-goat IgG (H + L) (LI-COR) (1:20 000) for TRPM5 or IRDye 800CW goat anti-mouse IgG (H + L) secondary antibody (LI-COR) (1:3000 for CaSR or 1:20 000 for TRPA1). Infrared fluorescence intensity was detected on the Odyssey Infrared Imaging System (LI-COR).
Imunocytochemical detection of CaSR
Briefly, STC-1 cells were grown on BD Matrigel Basement Membrane Matrix coated cover glasses. These were washed with PBS once, fixed with cold methanol containing 0.3% (v/v) H2O2 for 15 min, and then washed with PBS twice. The washed cells were permeabilized with 0.1% (v/v) Triton X-100 in PBS for 10 min and washed with PBS twice. The fixed cells were blocked with 1.5% (v/v) goat serum in PBS for 30 min and then incubated with primary anti CaSR antiserum at a concentration of 10 µg/ml in 1.5% (v/v) goat serum in PBS for 1 h. Negative control were carried out by performing the same procedure with purified rabbit IgG at the concentration of 10 µg/ml. Cells were washed 3 times of 5 min each with PBS followed by incubation 30 min with biotinylated secondary antibody. Washed 3 times of 5 min each with PBS and then incubated 30 min with ABC reagent (VECTASTAIN Elite ABC Kit [rabbit IgG], Vector Labs, Burlingame, California). After washing, slides were incubated with ImmPACT DAB peroxidase substrate (Vector Labs). Reactions were terminated by washing twice with water and then counterstained with hematoxylin (Vector Labs).
siRNA silencing of CaSR and TRPA1
STC-1 cells were grown in 24-well culture plates and then transfected with 5 pmol/well of Silencer Select Predesigned siRNA targeted mCaSR (1# and #2), mTRPA1 (#1 and 2#) or nontargeting silencer negative control #1 siRNA using Lipofectamine RNAiMAX (Life Technologies, Grand Island, New York) according to the manufacturer’s protocol (LifeTechnologies, 2014). After transfection, cells were incubated for 48 h at 37°C. To verify that siRNA induced gene knockdown, total cellular RNA was isolated from cells 48 h posttransfection and subjected to qRT-PCR using TaqMan RNA-to-Ct 1-step Kit (Life Technologies). The effects of siRNA silencing on DON-induced CCK release were determined after 48 h posttransfection.
Statistical analysis
All experiments were independently done in triplicate. Data were analyzed using Sigma Plot 11 Software (Systat Software, Inc, San Jose, California). Statistical comparisons between 2 groups were made using a Student’s t-test unless normality failed and a Mann-Whitney Rank Sum Test was executed. Multiple groups were analyzed for statistical significance using a 1-way analysis of variance (ANOVA) with Holm-Sidak multiple comparison procedure and when normality failed a Kruskal-Wallis 1-way ANOVA on Ranks with a Tukey or Dunn’s test was utilized. Data were considered to be statistically significant if P < .05.
RESULTS
DON Induces CCK and GLP-1 Release in STC-1 Cells via Ca2+-Mediated Signaling
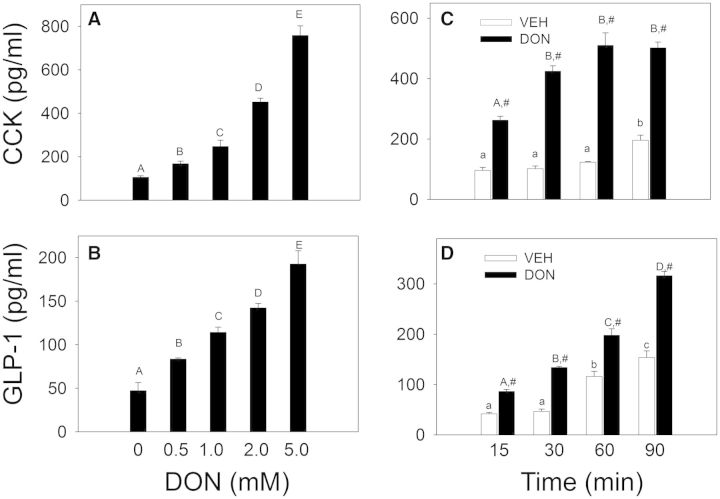
Exposure of STC-1 cells to DON from 0.5 to 5 mM induced the secretion of CCK (Fig. 1A) and GLP1 (Fig. 1B) in a concentration-dependent fashion after 45 min. When the effects of different DON concentrations over the same time period on the MTT response were determined, viabilities were 100% ± 11.4%, 108% ± 9.6%, 94% ± 11.8%, and 80% ± 10.3% for DON 0, 1, 2, or 5 mM, respectively (Supplementary Fig. S1). When the effects of 2 mM DON were measured over a 90-min time period, secretion of both hormones was evident as early as 15 min in cells treated with (Fig. 1C and 1D). STC-1 viability was unaffected by 2 mM DON up to 45 min but was decreased by ∼10% at 60 and 90 min (Supplementary Fig. S1 and Table S1). Based on these findings, subsequent treatments employed ≤2 mM DON and were incubated for ≤45 min.
FIG. 1.
Deoxynivalenol (DON) induces release of the gut hormones cholecystokinin (CCK) and glucagon-like peptide-17-36 amide (GLP-1) from STC-1 cells. A, B, DON-induced gut hormone release is concentration-dependent. STC-1 cells were treated with DON at indicated concentrations for 45 min. Medium was collected and CCK (A) and GLP-1 (B) concentrations determined by ELISA. Bars without the same letter are significantly different (P < .05). C, D, DON-induced hormone release is rapid. STC-1 cells were incubated with DON at 2 mM for indicated time intervals and CCK (C) and GLP-1 (D) measured. Lower case or upper case letters indicate significant difference within vehicle- or DON-treated groups, respectively. The # sign indicates significant difference between vehicle and corresponding DON-treated group at a given time point (P < .05). Results are representative of 3 independent experiments.
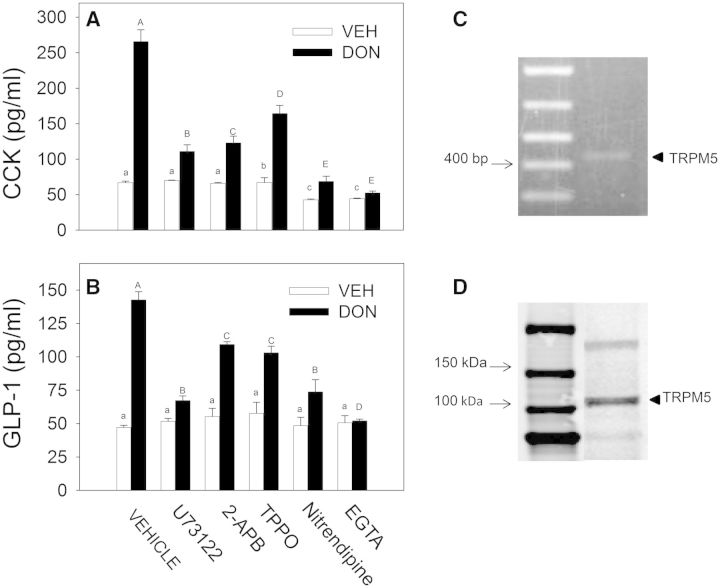
The potential role of Ca2+ in DON-induced hormone secretion by the STC-1 cell line was assessed using selective antagonists. The PLC inhibitor U73122 and IP3 receptor antagonist 2-APB suppressed CCK secretion suggesting PLC-dependent release of Ca2+ stores were involved in release of this hormone (Fig. 2A). In addition, the TRPM5 Na2+ channel inhibitor TPPO, the L-type VSCC inhibitor nitrendipine and the extracellular Ca2+ chelator EGTA all inhibited DON-induced CCK release indicating possible involvement of extracellular Ca2+ entry. DON-induced GLP-1 secretion similarly involved these Ca2+-dependent mechanisms (Fig. 2B). STC-1 cell expression of TRPM5 mRNA and protein was demonstrated by PCR (Fig. 2C) and Western analysis (Fig. 2D), respectively, confirming that this channel was expressed in this EEC model.
FIG. 2.
DON-induced CCK and GLP-1 release in STC-1 cells depends on Ca2+ signaling and transient receptor potential melastatin-5 ion channel. A, B, STC-1 cells were preincubated for 15 min with: vehicle (DMSO); U73122 (10 µM), a phospholipase C inhibitor; 2-aminoethyl diphenyl-borinate (2-APB, 50 µM), an IP3 receptor antagonist; TPPO (10 µM), a selective inhibitor of TRPM5; nitrendipine (1 µM), an L-type voltage-sensitive Ca2+ channel (L-type VSCC) blocker; or EGTA (1 mM), a Ca2+ chelator. Cells were then incubated with DON (2 mM) for 30 min and supernatant fractions were analyzed for CCK (A) and GLP-1(B). Different lower case and upper case letters indicate significant differences within control and DON-treated cells, respectively (P < .05). (C, D) STC-1 cells express TRPM5. Total RNA was isolated from STC-1 cells and subjected to RT-PCR (C). Estimated size of product (429 bp) is consistent with TRPM5 (indicated by arrow). Total protein of STC-1 cells was extracted and TRPM5 presence determined by Western analysis (D) (indicated by arrow).
DON-Induced Intracellular Calcium Increase Requires the GPCR CaSR
As suggested by the antagonist studies, confocal microcopy studies revealed that DON induced rapid (1–2 min) elevation of [Ca2+]i in STC-1 cells but not in control HEK 293 cells at concentrations that were consistent with hormone secretion (Fig. 3A). Furthermore, [Ca2+]i elevation was dependent on the presence of extracellular Ca2+ (Fig. 3B and 3C), which suggested the possible involvement of CaSR, a GPCR previously reported to be present on STC-1 (Hira et al., 2008).
FIG. 3.
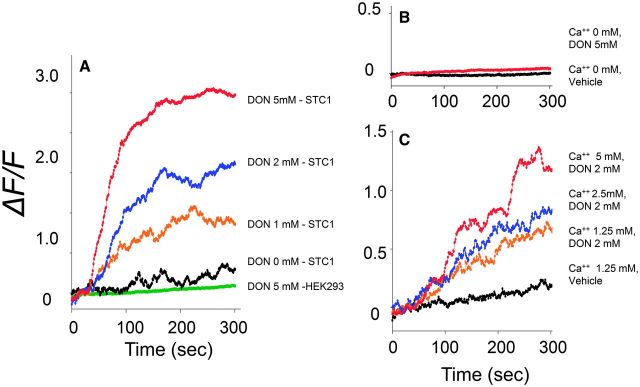
DON induces intracellular Ca2+([Ca2+]i) increase in STC-1 cells. A, DON dose-dependently induces [Ca2+]i elevation. STC-1 and HEK 293 cells were grown on matrigel-coated slides and then incubated 2 µM of Fluo-4, AM calcium indicator dye for 30 min, at room temperature in dark. After treatment with DON at indicated concentrations, Ca2+ influx was measured by confocal calcium imaging. Fluorescence intensities were recorded and mean value of the relative fluorescence change of 50 cells expressed as ΔF/F. B, C, Extracellular calcium modulates DON-evoked [Ca2+]i increase in STC-1 cells. STC-1 cells were preloaded with Fluo-4, AM as described earlier and exposed to 2 mM DON containing 0, B, 1.25, 2.5, or 5 mM CaCl2 (C) and ΔF/F measured. All results are representative of 3 independent experiments.
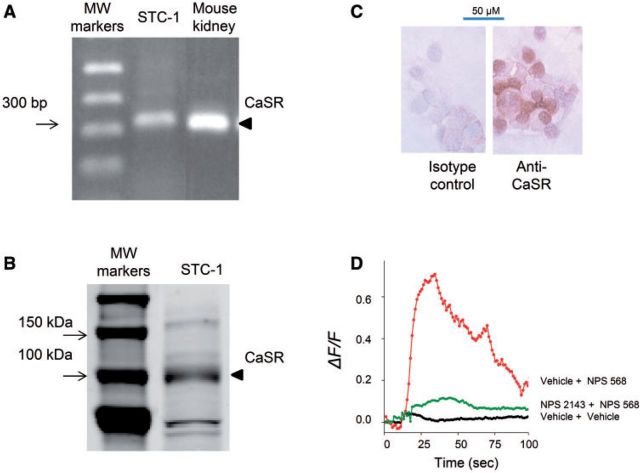
Expression of CaSR by the STC-1 line was demonstrated by RT-PCR (Fig. 4A), Western analysis (Fig. 4B) and immunocytochemistry (Fig. 4C). Exposure of STC-1 cells to the allosteric CaSR agonist NPS 568 elicited a rapid increase in [Ca2+]i that was ablated by preincubation with the allosteric antagonist NPS 2143 (Fig. 4D). Preincubation with CaSR antagonists NPS 2143 (Fig. 5A) and Calhex 231 (Fig. 5B) suppressed DON-mediated increases in cytosolic Ca2+. Accordingly, CaSR were confirmed to be expressed and functional in STC-1 cells and, furthermore, this GPCR appeared to mediate DON-induced elevation of [Ca2+]i.
FIG. 4.
STC-1 cells express a functional calcium-sensing receptor (CaSR). Expression of CaSR in STC-1 was verified by RT-PCR (A), Western analysis (B), and imunocytochemical staining (C) (see arrows). Functionality of this receptor is indicated by [Ca2+]i increase induced by the CaSR agonist NPS 568 (20 µM) and ablation of this response the antagonist NPS 2143 (10 µM) (D). All results are representative of 3 independent experiments.
FIG. 5.
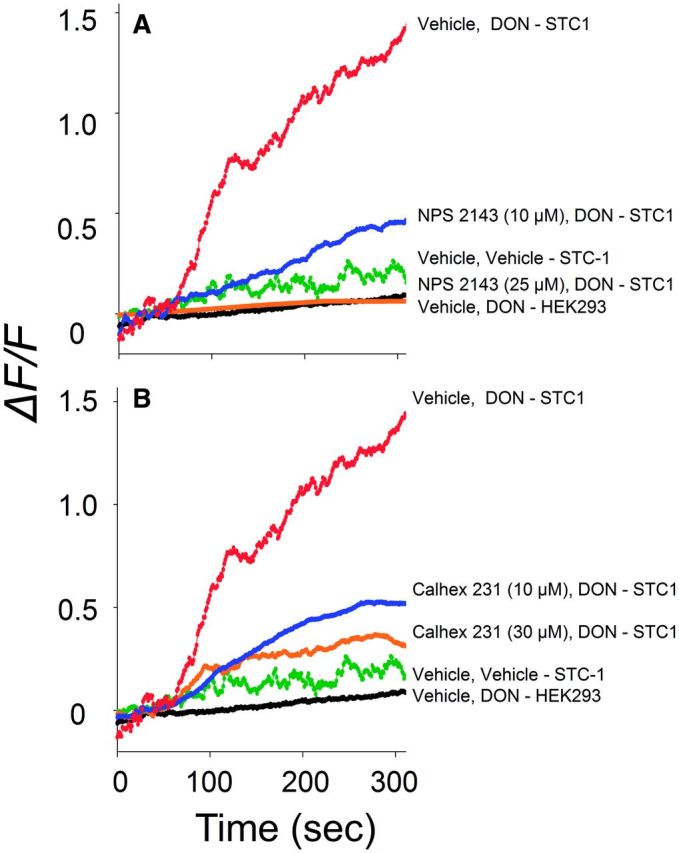
DON-induced [Ca2+]i elevation in STC-1 is CaSR-dependent. Induction of [Ca2+]i by DON (2 mM) was blocked by the CaSR antagonists NPS 2143 (A) and Calhex 231(B).
DON-Induced [Ca2+]i Increase Also Requires TRPA1
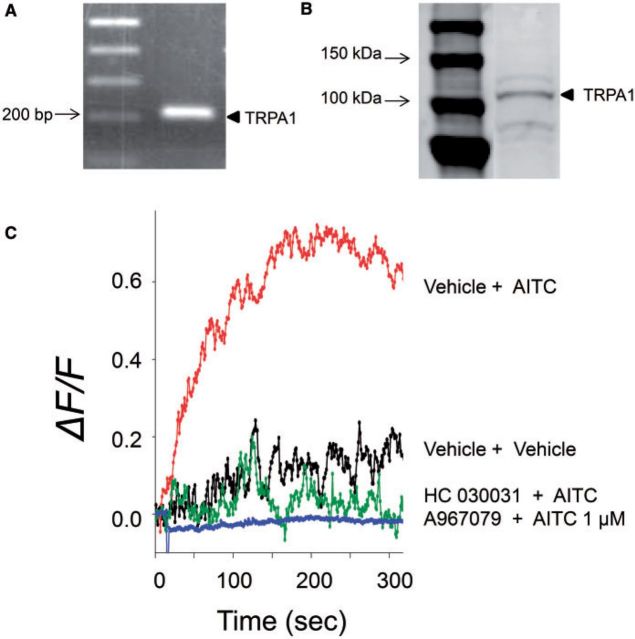
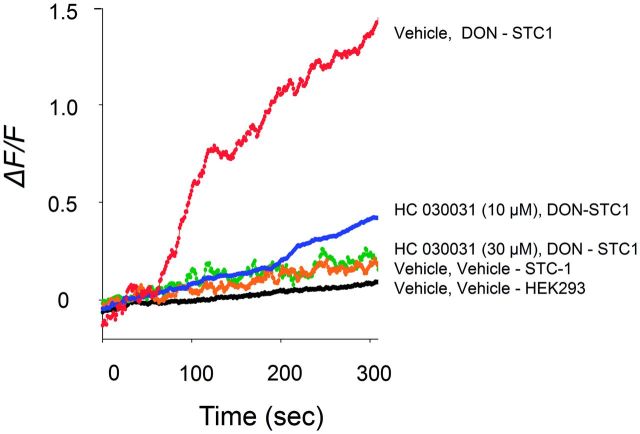
STC-1 has been reported to express TRPA1 (Kurogi et al., 2012; Purhonen et al., 2008), which might also contribute to DON-induced perturbations in cytosolic Ca2+. The presence of TRPA1 in the cell line was confirmed by PCR (Fig. 6A) and Western analysis (Fig. 6B). The functionality of this channel was verified based on the induction of elevated [Ca2+]i by the TRPA1 agonist AITC and the inhibition of this response by the TRPA1 antagonists HC 030031 and A967079 (Fig. 6C). DON-induced elevation of [Ca2+]i was likewise suppressed in a concentration-dependent manner by the TRPA1 antagonist HC 030031 (Fig. 7). These data indicate that, in addition to CaSR, TRPA1 appeared to be involved in DON-mediated elevation in [Ca2+]i.
FIG. 6.
STC-1 cells express a functional transient receptor potential A1 (TRPA1). Expression of TRPA1 in STC-1 was demonstrated by RT-PCR (A) and Western analysis (B) (see arrows). Functionality of this channel is indicated by [Ca2+]i increase induced by the TRPA1 agonist AITC (1 µM) and ablation of this response by TRPA1 antagonists HC030031 (30 µM) or A967079 (30 µM) (C). All results are representative of 3 independent experiments.
FIG. 7.
DON-induced [Ca2+]i increase is TRPA1-dependent. Induction of [Ca2+]i by DON (2 mM) was dose-dependently blocked by the TRPA1 antagonist HC030031. Results are representative of 3 independent experiments.
CaSR-Driven [Ca2+]i Increase and Hormone Release Requires TRPA1
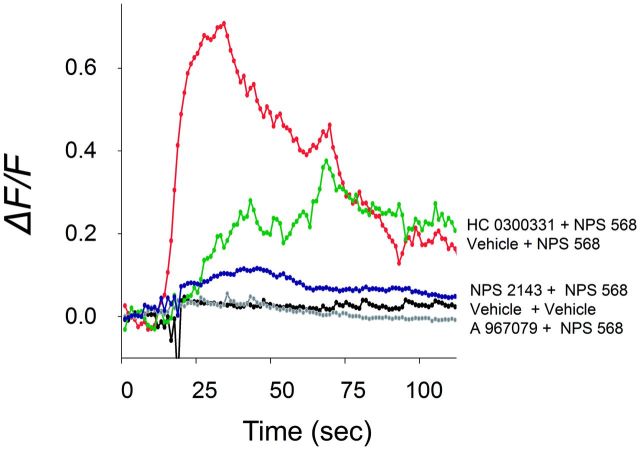
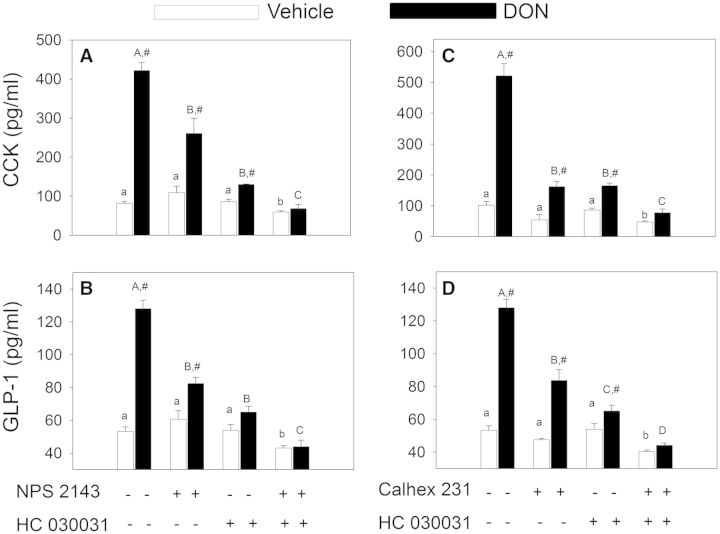
Induction of [Ca2+]i elevation in STC1 by the CaSR agonist NPS 568 was not only be suppressed by the CaSR antagonist NPS 2143 but also by the TRPA1 antagonists HC0300331 and A 967079 (Fig. 8). Thus, TRPA1 appeared to play a role downstream to CaSR in eliciting increased cytosolic Ca2+ in STC-1 cells. The joint contributions of CaSR and TRPA1 in DON-induced hormone secretion were assessed in STC-1 cells using pharmacological antagonists. DON-induced CCK release was suppressed by the CaSR antagonists NPS 2143 and Calhex 231 as well as the TRPA1 antagonist HC 030031 (Fig. 9A–C). The combination of HC 030031 with either NPS 2143 or Calhex 231 additively inhibited DON-mediated CCK secretion. Similar results were observed relative to DON-induced GLP-1 secretion (Fig. 9B and 9D), again suggesting that CaSR and TRPA1 played complementary roles in these responses.
FIG. 8.
CaSR-mediated [Ca2+]i elevation in STC1 cells is TRPA1-dependent. Induction of [Ca2+]i increase by CaSR agonist NPS 568 (20 µM) was inhibited by TRPA1 antagonists HC030031 (50 µM) or A967079 (50 µM) as well as CaSR antagonist NPS 2143 (30 µM). Results are representative of 3 independent experiments.
FIG. 9.
DON-induced CCK and GLP-1 release by STC-1 cells are CaSR- and TRPA1-dependent. STC-1 cells grown in 24-well culture plate were preincubated with NPS 2143(10 µM), HC 030031(20 µM), and/or Calhex 231(20 µM) for 15 min as indicated. DON was then added to a concentration of 2 mM in the cultures incubated for 30 min and then the supernatants analyzed for CCK (A, C) and GLP-1 (B, D). Lower and upper case letters indicate significant difference with control or DON groups, respectively (P < .05). Results are representative of 3 independent experiments.
CaSR- and TRPA1-Knockdown Impair DON-Induced CCK Release
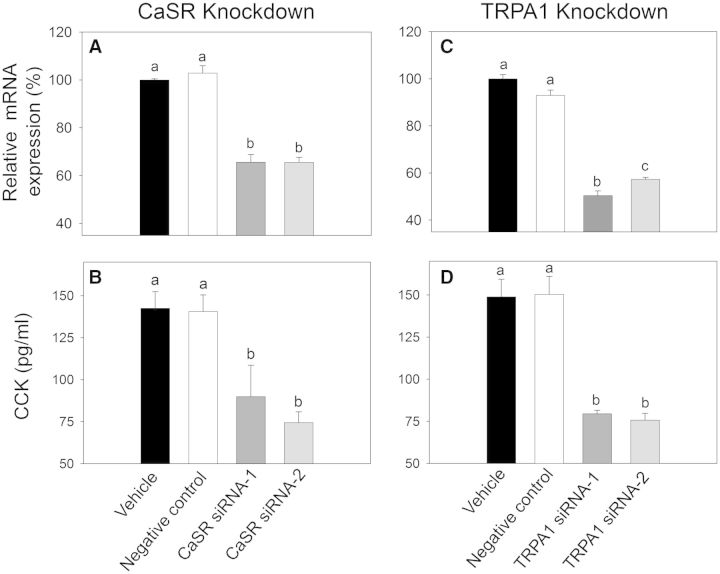
The effects of CaSR- and TRPA1-specific siRNA knockdown on DON-induced CCK exocytosis were evaluated in STC-1 to confirm findings with pharmacologic antagonists. siRNA transfection caused ∼35% and 45% reductions in CASR mRNA (Fig. 10A) and TRPA1-mRNA (Fig. 10B) expression levels, respectively, as compared with the vehicle-transfected cells. Transfections with CaSR siRNAs (Fig. 10C) or with TRPA1 siRNAs (Fig. 10D) significantly attenuated DON-stimulated CCK release in STC-1 cells. Furthermore, DON-induced CCK release was identical in cells transfected with negative control siRNAs to those transfected only with vehicle (Fig. 10C and 10D). Thus, siRNA knockdown confirmed the antagonist studies, again suggesting that CaSR and TRPA1 were both involved in DON-induced CCK secretion.
FIG. 10.
Specific siRNA knockdown of CaSR- and TRPA1-mRNA expression impairs DON stimulated CCK release of STC-1 cells. A, B, Confirmation of CASR- and TRPA1-mRNA expression knockdown by quantitative real time PCR in STC-1 cells transfected with 2 different silencer select siRNA against the mouse CASR (A) or mouse TRPA-1 (B), as well as with a silencer select negative control and a vehicle transfected cells control. (P < .05). C, D, DON-induced CCK release is inhibited by knockdown of CASR (C) and TRPA1 (D). Bars without the same letter are significantly different (P < .05).
DISCUSSION
Prior investigations in the mouse have suggested that DON-induced food refusal is mediated by hormones known to be produced by EECs (Flannery et al., 2012; Wu et al., 2014). Here, we employed the murine STC-1 model to elucidate the upstream mechanisms by which DON elicits EEC hormone secretion. The results indicate for the first time that DON induces Ca2-dependent secretion of CCK and GLP-1. These hormones regulate food intake and energy homeostasis and are products of 2 critical EEC populations—I cells of the small intestine and L cells of the large intestine, respectively. Although this cell line expresses PYY mRNA, it did not robustly secrete the PYY3-36 in response to known STC-1 inducers or to DON (data not shown). As summarized in Figure 11, the data presented herein suggest that DON induces [Ca2+]i elevation in STC-1 cells via a CaSR-mediated pathway that involved the following serial events: (1) PLC-mediated activation of the IP3 receptor and mobilization of intracellular Ca2+ stores, (2) activation of the TRPM5 Na2+ channel and resultant L-type VSCC-facilitated extracellular Ca2+ entry, and (3) amplification of extracellular Ca2+ entry by TRPA1 activation. It is further predicted that that this elevation in [Ca2+]i subsequently elicits secretion of CCK and GLP-1.
FIG. 11.
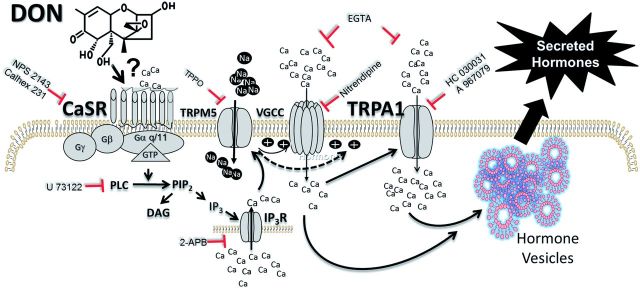
Putative model for DON-induced hormone secretion by the STC-1 EEC model. This study suggests that DON initiates [Ca2+]i increase in STC-1 cells via CaSR-mediated pathway that involves the following serial events: (1) PLC-mediated activation of the IP3 receptor and mobilization of intracellular Ca2+ stores, (2) activation of the TRPM5 Na2+ channel and resultant L-type VSCC-facilitated extracellular Ca2+ entry, and (3) amplification of extracellular Ca2+ entry by TRPA1 activation. The resultant elevation of [Ca2+]i drives exocytosis of CCK, GLP-1, and potentially other hormones. The data presented here suggest that DON hijacks these normal physiologic processes mediated by CaSR, thereby disrupting homeostasis and mediating hormone release. Further investigation is needed to ascertain if DON allosterically interacts with CaSR or if the toxin activates this GPCR by an alternative mechanism. The symbol ⊥ indicates targets of antagonists used in this study.
Consistent with our findings, STC-1 has been previously shown to respond to agonists and antagonists of CaSR, TRPM5, and TRPA1 (Hira et al., 2008; Kurogi et al., 2012; Nakajima et al., 2012; Purhonen et al., 2008; Shah et al., 2012). CaSR regulates serum calcium homeostasis and is directly activated by sensing increased extracellular Ca2+, other inorganic cations and organic polycations; however, this receptor has many other physiological roles (Chakravarti et al., 2012; Ward et al., 2012). Importantly, it has been postulated that CaSR functions as a chemosensor of intestinal luminal content and that its activation can elicit secretion of gut hormones which regulate nutritional homeostasis (Liou et al., 2011; Nakajima et al., 2012). Consistent with this role, in the presence of Ca2+, CaSR is activated by various aromatic L-amino acids, dietary peptides, polyamines, and fatty acids that are encountered in the gut after meal consumption. Our results suggest that DON hijacks these normal physiologic processes by acting on CaSR, thereby disrupting homeostasis and causing aberrant loss of appetite. It is possible that the toxin allosterically interacts with CaSR but this will require further study.
TRPM5 is a Ca2+-activated cation channel that mediates signaling in taste and other chemosensory cells (Huang and Roper, 2010). This TRP channel is distributed in chemosensory cells located throughout the digestive tract, in the respiratory system and in the olfactory system (Liman, 2007). TRPM5 is the final element in a signaling cascade that starts with the activation of GPCRs by bitter, sweet, or umami taste molecules and that requires PLCβ2 (Kaske et al., 2007). Consistent with our model, this latter enzyme catalyzes the conversion of PIP2 into DAG and IP3, and the ensuing release of Ca2+ from intracellular stores activates TRPM5.
It is well known that TRPA1 is expressed in neurons and mediates pain and neurogenic inflammation in response to heat, cold, mechanical, and chemical stressors (Nilius et al., 2012). However, its expression and role in nonneuronal cell types that control diverse physiological functions is now being recognized as important (Fernandes et al., 2012). The finding that DON mediates increased [Ca2+]i in part, via TRPA1, was surprising because in its role as a chemosensor, TRPA1 is primarily activated by reactive chemicals such as allyl isothiocyanate (AITC), cinnamaldehyde, formalin, hydrogen peroxide, 4-hydroxynonenal, and acrolein. Although DON contains an epoxide group, this moiety is shielded by the parent ring thus masking and preventing it from reacting with other chemicals or macromolecules. As an alternative, it has been proposed that TRPA1 and other TRP channels are activated through intracellular signaling involving: (1) GPCR-mediated activation via PLC and diacylglycerol (DAG)-dependent mechanisms, (2) intracellular phosphatidylinositol phosphates (eg, PIP2), (3) elevated [Ca2+]I, and (4) membrane depolarization (Nilius et al., 2012). Thus, it is reasonable to suggest that TRPA1 activation results from DON-induced CaSR activation (Fig. 11) rather than as a result of direct interaction between the toxin and this TRP channel. Nevertheless, a few nonreactive activators (eg, nicotine, PF-4840154) have been reported to activate TRPA1, so without further investigation it is not yet possible to exclude the possibility of a direct interaction with DON.
We recognize that a limitation of this study was that the high DON concentrations employed might possibly be associated with other toxic effects upon prolonged incubation (Maresca, 2013) such as apoptosis as has been observed in the RAW 264.7 macrophage cell line incubation with 1 µM DON for 6 h (Zhou et al., 2005). Because our primary focus was to determine DON’s short term (15–45 min) effects (ie, intracellular calcium increase and hormone secretion) in this enteroendocrine model that would be indicative of a rapid intestinal chemical defense response (eg, food refusal, reduced gut motility, and emesis), we confirmed viability during this time period but did not measure the effects on viability of ≥6 h incubation at these concentrations. Although concentrations of DON required to evoke Ca2+ and hormone responses in STC-1 (≥500 µM) were very similar to those of other agonists that induce hormone secretion in this model (Hira et al., 2008), comparatively lower DON gut luminal and tissue concentrations (≥10 µM) might be expected to elicit satiety hormone elevations and anorectic responses in the mouse (Flannery et al., 2012). This divergence might reflect several inherent limitations associated with using the cloned STC-1 line to predict the effects of EEC lineages in vivo. First, the dissociated state of these cells and absence of adjacent (ie, epithelial, Paneth, goblet) or supporting cells might affect their ability to respond identically to the in vivo setting. Second, the responsiveness might be affected by the absence of basal luminal components such as nutrients (eg, amino acids, fatty acids) and microbiota found naturally in the gut that might have modulatory effects on EEC. Finally, because STC-1 is a cancer cell line, there is the clear potential for expression of drug transporters such as the ABC and MDR families (Choi and Yu, 2014; Kathawala et al., 2014) which have been demonstrated to affect DON uptake (Videmann et al., 2007). Nevertheless, the STC-1 model provides a useful starting point for future investigations of GPCR- and TRP-related mechanisms in ex vivo and in vivo models.
Taken together, the results of this investigation indicate that DON evokes CCK and GLP-1 secretion in the STC-1 EEC model by activating CaSR- and TRPA1-mediated Ca2+ signaling pathways (Fig.11). A potential outcome of this research is that understanding the cellular and molecular mechanisms for DON’s anorectic effects will facilitate design of new strategies for preventing these effects in humans and animals as well as lead to new in vitro assays to identify, classify and measure toxic potencies of trichothecene congeners/metabolites that target EEC. The capacity for DON to evoke aberrant secretion of satiety hormones is of further interest because of their recognized pathophysiological involvement in irritable bowel syndrome (Zhang et al., 2008), eating disorders (Chaudhri et al., 2006) and failure to thrive in the elderly (Hays and Roberts, 2006). Over the long term, it is anticipated that this research will serve as a template for future exploration into the role of different EEC lineages in sensing foodborne toxins, chemotherapeutic drugs, environmental toxicants, and chemical warfare agents that might elicit anorexia and emesis through analogous GPCR- and TRP-mediated mechanisms.
SUPPLEMENTARY DATA
Supplementary data are available online at http://toxsci.oxfordjournals.org/.
FUNDING
This study was supported by USDA Wheat and Barley SCAB Initiative Award (Grant Number 59-0206-9-058); USDA NIFA Award (Grant Number 2011-0635); and by the National Institute for Environmental Health (Grant Number ES3358).
Supplementary Material
ACKNOWLEDGMENTS
The authors thank Dr Melinda Frame form the MSU Center for Advanced Microscopy for technical advice and Mary Rosner for assistance with manuscript preparation.
REFERENCES
- Canady R. A., Coker R. D., Rgan S. K., Krska R., Kuiper-Goodman T., Olsen M., Pestka J. J., Resnik S., Schlatter J. (2001). Deoxynivalenol, Safety Evaluation of Certain Mycotoxins in Food. Fifty-Sixth Report of the Joint FAO/WHO Expert Committee on Food Additives. International Programme on Chemical Safety. World Health Organization, Geneva, pp. 420–555. [Google Scholar]
- Cattaruzza F., Spreadbury I., Miranda-Morales M., Grady E. F., Vanner S., Bunnett N. W. (2010). Transient receptor potential ankyrin-1 has a major role in mediating visceral pain in mice. Am. J. Physiol. Gastrointest. Liver Physiol. 298, G81–G91. [DOI] [PMC free article] [PubMed] [Google Scholar]
- Chakravarti B., Chattopadhyay N., Brown E.M. (2012). Signaling through the extracellular calcium-sensing receptor (CaSR). Adv. Exp. Med. Biol. 740, 103–142. [DOI] [PubMed] [Google Scholar]
- Chaudhri O. B., Field B. C. T., Bloom S. R. (2006). From gut to mind—hormonal satiety signals and anorexia nervosa. J. Clin. Endocrinol. Metab. 91, 797–798. [DOI] [PubMed] [Google Scholar]
- Choi Y. H., Yu A. M. (2014). ABC transporters in multidrug resistance and pharmacokinetics, and strategies for drug development. Curr. Pharm. Des. 20, 793–807. [DOI] [PMC free article] [PubMed] [Google Scholar]
- Dockray G.J. (2009). Cholecystokinin and gut–brain signalling. Regul. Pept. 155, 6–10. [DOI] [PubMed] [Google Scholar]
- EFSA. (2013). Statement on the risks for public health related to a possible increase of the maximum level of deoxynivalenol for certain semi-processed cereal products. EFSA J. 11(12):3490, 56 pp. [Google Scholar]
- Fernandes E. S., Fernandes M. A., Keeble J. E. (2012). The functions of TRPA1 and TRPV1: Moving away from sensory nerves. Br. J. Pharmacol. 166, 510–521. [DOI] [PMC free article] [PubMed] [Google Scholar]
- Flannery B. M., Clark E. S., Pestka J. J. (2012). Anorexia induction by the trichothecene deoxynivalenol (vomitoxin) is mediated by the release of the gut satiety hormone peptide YY. Toxicol. Sci. 130, 289–297. [DOI] [PMC free article] [PubMed] [Google Scholar]
- Geraedts M. C., Troost F. J., Fischer M. A., Edens L., Saris W. H. (2011). Direct induction of CCK and GLP-1 release from murine endocrine cells by intact dietary proteins. Mol. Nutr. Food Res. 55, 476–484. [DOI] [PubMed] [Google Scholar]
- Girardet C., Bonnet M. S., Jdir R., Sadoud M., Thirion S., Tardivel C., Roux J., Lebrun B., Mounien L., Trouslard J., et al. (2011a). Central inflammation and sickness-like behavior induced by the food contaminant deoxynivalenol: A PGE2-independent mechanism. Toxicol. Sci. 124, 79–91 [DOI] [PubMed] [Google Scholar]
- Girardet C., Bonnet M. S., Jdir R., Sadoud M., Thirion S., Tardivel C., Roux J., Lebrun B., Wanaverbecq N., Mounien L., et al. (2011b). The food-contaminant deoxynivalenol modifies eating by targeting anorexigenic neurocircuitry. PloS One 6, e26134. [DOI] [PMC free article] [PubMed] [Google Scholar]
- Gribble F. M. (2012). The gut endocrine system as a coordinator of postprandial nutrient homoeostasis. Proc. Nutr. Soc. 71, 456–462. [DOI] [PubMed] [Google Scholar]
- Hays N. P., Roberts S. B. (2006). The anorexia of aging in humans. Physiol. Behav. 88, 257–266. [DOI] [PubMed] [Google Scholar]
- Hira T., Nakajima S., Eto Y., Hara H. (2008). Calcium-sensing receptor mediates phenylalanine-induced cholecystokinin secretion in enteroendocrine STC-1 cells. FEBS J. 275, 4620–4626. [DOI] [PubMed] [Google Scholar]
- Huang Y. A., Roper S. D. (2010). Intracellular Ca2+ and TRPM5-mediated membrane depolarization produce ATP secretion from taste receptor cells. J. Physiol. 588, 2343–2350. [DOI] [PMC free article] [PubMed] [Google Scholar]
- Karra E., Batterham R. L. (2010). The role of gut hormones in the regulation of body weight and energy homeostasis. Mol. Cell Endocrinol. 316, 120–128. [DOI] [PubMed] [Google Scholar]
- Kaske S., Krasteva G., Konig P., Kummer W., Hofmann T., Gudermann T., Chubanov V. (2007). TRPM5, a taste-signaling transient receptor potential ion-channel, is a ubiquitous signaling component in chemosensory cells. BMC Neurosci. 8, 49. [DOI] [PMC free article] [PubMed] [Google Scholar]
- Kathawala R. J., Gupta P., Ashby C. R., Jr, Chen Z. (2014). The modulation of ABC transporter-mediated multidrug resistance in cancer: A review of the past decade. Drug Resist. Updat 18, 1–17. [DOI] [PubMed] [Google Scholar]
- Kurogi M., Miyashita M., Emoto Y., Kubo Y., Saitoh O. (2012). Green tea polyphenol epigallocatechin gallate activates TRPA1 in an intestinal enteroendocrine cell line, STC-1. Chem. Senses 37, 167–177. [DOI] [PubMed] [Google Scholar]
- Liman E. R. (2007). The Ca2+-activated TRP channels: TRPM4 and TRPM5. In TRP Ion Channel Function in Sensory Transduction and Cellular Signaling Cascades Liedtke WB, Heller S, Eds., Taylor & Francis Group, LLC, Boca Raton FL. [PubMed] [Google Scholar]
- Liou A. P. (2013). Digestive physiology of the pig symposium: G protein-coupled receptors in nutrient chemosensation and gastrointestinal hormone secretion. J. Anim. Sci. 91, 1946–1956. [DOI] [PubMed] [Google Scholar]
- Liou A. P., Sei Y., Zhao X., Feng J., Lu X., Thomas C., Pechhold S., Raybould H. E., Wank S. A. (2011). The extracellular calcium-sensing receptor is required for cholecystokinin secretion in response to L-phenylalanine in acutely isolated intestinal I cells. Am. J. Physiol. Gastrointest. Liver Physiol. 300, G538–G546. [DOI] [PMC free article] [PubMed] [Google Scholar]
- Maresca M. (2013). From the gut to the brain: Journey and pathophysiological effects of the food-associated trichothecene mycotoxin deoxynivalenol. Toxins 5, 784–820. [DOI] [PMC free article] [PubMed] [Google Scholar]
- Moran-Ramos S., Tovar A.R., Torres N. (2012). Diet: Friend or foe of enteroendocrine cells–how it interacts with enteroendocrine cells. Adv. Nutr. 3, 8–20. [DOI] [PMC free article] [PubMed] [Google Scholar]
- Nakajima S., Hira T., Hara H. (2012). Calcium-sensing receptor mediates dietary peptide-induced CCK secretion in enteroendocrine STC-1 cells. Mol. Nutr. Food Res. 56, 753–760. [DOI] [PubMed] [Google Scholar]
- Nilius B., Appendino G., Owsianik G. (2012). The transient receptor potential channel TRPA1: From gene to pathophysiology. Pflugers Arch. 464, 425–458. [DOI] [PubMed] [Google Scholar]
- Pestka J. J. (2010). Deoxynivalenol: Mechanisms of action, human exposure, and toxicological relevance. Arch. Toxicol. 84, 663–679. [DOI] [PubMed] [Google Scholar]
- Purhonen A. K., Louhivuori L. M., Kiehne K., Kerman K. E., Herzig K. H. (2008). TRPA1 channel activation induces cholecystokinin release via extracellular calcium. FEBS Lett. 582, 229–232. [DOI] [PubMed] [Google Scholar]
- Reimann F., Tolhurst G., Gribble F. M. (2012). G-protein-coupled receptors in intestinal chemosensation. Cell Metab. 15, 421–431. [DOI] [PubMed] [Google Scholar]
- Schwartz M. W. (2006). Central nervous system regulation of food intake. Obesity 14(Suppl. 1), 1S–8S. [DOI] [PubMed] [Google Scholar]
- Shah B. P., Liu P., Yu T., Hansen D. R., Gilbertson T. A. (2012). TRPM5 is critical for linoleic acid-induced CCK secretion from the enteroendocrine cell line, STC-1. Am. J. Physiol. Cell Physiol. 302, C210–C219. [DOI] [PMC free article] [PubMed] [Google Scholar]
- Staaf S., Franck M. C., Marmigere F., Mattsson J. P., Ernfors P. (2010). Dynamic expression of the TRPM subgroup of ion channels in developing mouse sensory neurons. Gene Expr. Patterns 10, 65–74. [DOI] [PubMed] [Google Scholar]
- Steinert R. E., Feinle-Bisset C., Geary N., Beglinger C. (2013). Secretion of gastrointestinal hormones and eating control. J. Anim. Sci. 91, 1963–1973. [DOI] [PubMed] [Google Scholar]
- Tolhurst G., Reimann F., Gribble F. M. (2012). Intestinal sensing of nutrients. Handb. Exp. Pharmacol. 209, 309–335. [DOI] [PubMed] [Google Scholar]
- Videmann B., Tep J., Cavret S., Lecoeur S. (2007). Epithelial transport of deoxynivalenol: Involvement of human p-glycoprotein (ABCB1) and multidrug resistance-associated protein 2 (ABCC2). Food Chem. Toxicol. 45, 1938–1947. [DOI] [PubMed] [Google Scholar]
- Ward B. K., Magno A. L., Walsh J. P., Ratajczak T. (2012). The role of the calcium-sensing receptor in human disease. Clin. Biochem. 45, 943–953. [DOI] [PubMed] [Google Scholar]
- Williams D. L., Baskin D. G., Schwartz M. W. (2009). Evidence that intestinal glucagon-like peptide-1 plays a physiological role in satiety. Endocrinology 150, 1680–1687. [DOI] [PMC free article] [PubMed] [Google Scholar]
- Wu W., Zhou H. R., He K., Pan X., Sugita-Konishi Y., Watanabe M., Zhang H., Pestka J. J. (2014). Role of cholecystokinin in anorexia induction following oral exposure to the 8-ketotrichothecenes deoxynivalenol, 15-acetyldeoxynivalenol, 3-acetyldeoxynivalenol, fusarenon X, and nivalenol. Toxicol. Sci. 138, 278–289. [DOI] [PMC free article] [PubMed] [Google Scholar]
- Zhang H., Yan Y., Shi R., Lin Z., Wang M., Lin L. (2008). Correlation of gut hormones with irritable bowel syndrome. Digestion 78, 72–76. [DOI] [PubMed] [Google Scholar]
- Zhou H. R., Islam Z., Pestka J. J. (2005). Induction of competing apoptotic and survival signaling pathways in the macrophage by the ribotoxic trichothecene deoxynivalenol. Toxicol. Sci. 87, 113–122. [DOI] [PubMed] [Google Scholar]
Associated Data
This section collects any data citations, data availability statements, or supplementary materials included in this article.


