

Abstract
Response times provide essential subthreshold perceptual data that extend beyond accuracy alone. Behavioral reaction times (RTs) were used to characterize rats’ ability to detect individual odorants in a series of complimentary binary odorant mixture ratios. We employed an automated, liquid-dilution olfactometer to train Fischer 344 rats (N = 8) on an odor identification task using nonreinforced probe trials. Binary mixture ratios composed of aliphatic odorants (citral and octanol) were arranged such that relative contributions of the 2 components varied systematically by a factor of 1% (v/v). Odorant concentrations for the target (S+), control (S−), and mixture (S+:S−) odorants were presented relative to threshold for each rat. Rats were initially trained to respond by licking at a spout to obtain liquid reward for either citral or octanol as the reinforced target (S+) odorant. After achieving 100% accuracy, rats were transferred to variable ratio (VR 2) reinforcement for correct responding. Nonreinforced probe trials (2 per block of 22 trials) were tested for each mixture ratio and recorded as either S+ (rats lick-responded in the presence of the mixture) or S− (rats refrained from licking), thereby indicating detection of the trained, S+ odorant. To determine the perceived salience for each ratio, RTs (latency from odorant onset to lick response) were recorded for each trial. Consistent with previous studies, RTs for both odorants were shortest (~150–200ms) when the probe trials consisted of a single, monomolecular component. Binary mixtures that contained as little as 1% of the S−, nontarget odorant, however, were sufficiently different perceptually to increase behavioral RTs (i.e., rats hesitated longer before responding); RTs changed systematically as a function of the binary ratio. Interestingly, the rate of RT change was dependent on which odorant served as the S+, suggesting an asymmetric interaction between the 2 odorants. The data demonstrate the value of behavioral RT as a sensitive measure of suprathreshold perceptual responding.
Key words: binary mixtures, Fischer 344 rats, odor discrimination, perception, psychophysics, reaction times
Introduction
In order to most fully take advantage of animal behavioral models in characterizing the physiological and neural mechanisms underlying olfactory processing, it is critical to employ olfactory psychophysical paradigms beyond merely detection and simple discrimination tasks. This issue is especially important for our understanding of processes operating at stimulus levels above detection thresholds, where most olfactory behavior occurs, and where perceptual changes with stimulus conditions might be subtle, or, for example, when olfactory dysfunction occurs in the absence of changes in overall sensitivity (Mobley et al. 2014).
Behavioral reaction times (RTs) have proven particularly useful across a wide range of species and sensory systems for quantifying small changes in perception at suprathreshold stimulus levels (e.g., Moody 1970; Uchida and Mainen 2003; Abraham et al. 2004, 2012; Slotnick 2007). RTs are both sensitive to variations in stimulus intensity and can reflect the temporal characteristics and complexity of underlying physiological mechanisms. For example, in response to monomolecular odorant discriminations, rodents consistently display both high temporal precision and rapid RTs (Karpov 1980; Uchida and Mainen 2003; Slotnick 2007; Wesson et al. 2008; Abraham et al. 2012). Depending on stimulus parameters, response time estimates routinely range from 150 to 200ms (Uchida and Mainen 2003, Abraham et al. 2004). Furthermore, these behavioral timescales approximate the odor-specific, temporal patterns of activation observed in the olfactory bulb (Friedrich 2006; Shusterman et al. 2011; Smear et al. 2011; Haddad et al. 2013), suggesting that underlying processes substantially influence behavioral discrimination times.
Beyond assessing perceived odorant intensity, RTs offer additional computational advantages. There is now considerable evidence that RTs correlate with task demands and may provide a useful continuum for evaluating odor generalization (Schoenbaum et al. 2003). Findings from go/no-go operant conditioning paradigms suggest that RTs depend greatly on stimulus features, such as the complexity of the odorants tested (Abraham et al. 2004, 2010). For instance, active sampling times have been shown to increase during finer odor discriminations (Uchida and Mainen 2003; Mainland and Sobel 2006; Schoenfeld and Cleland 2006). Despite this promising relationship, however, RT differences between simple and complex odor discriminations are generally modest compared with other sensory modalities. A key limitation has been developing odor-guided tasks that are sufficiently difficult to magnify RT differences.
To increase task complexity, one approach has been to introduce mixture discriminations. Rats have been shown to easily discriminate binary mixtures (Uchida and Mainen 2003; Abraham et al. 2004), but the degree of difficulty is largely determined by the mixture components (Linster and Smith 1999). Specifically, adjusting mixture proportions can substantially impact task difficulty (Uchida and Mainen 2003; Perry and Felsen 2012). Consistent with this view, studies have shown that rearranging mixture ratios, by adding or removing components, generates a range of complex, generalizable discriminations (Kay et al. 2003, 2005). One potential explanation for this finding is that olfactory receptor neurons produce ensemble responses for mixtures that are distinct from the activation patterns generated by the individual components alone (Johnson et al. 2010). Hence, odor representations constructed for mixtures may be qualitatively different from those constructed for the individual constituents. Importantly, these differences may be perceptually reflected as systematic changes in behavioral response times (Abraham et al. 2004, 2012).
Previous research from our laboratory has shown that Fischer 344 (F344) rats are a useful model for investigating age-related cognitive decline. Notably, a subset of these rats shows hippocampal-dependent, spatial memory impairments that correlate with reduced olfactory discrimination performance (LaSarge et al. 2007). Though the relationship between decreased olfactory acuity and cognitive decline has been well established in this model, few studies have integrated rigorous psychophysical assessments to evaluate their basic olfactory behavior (LaSarge and Nicolle 2009). Moreover, given that many of these rats develop cognitive changes as they age, isolating potential learning effects from perceptual changes will be key for establishing an olfactory phenotype in this model. To more explicitly characterize olfactory acuity, F344 rats were initially trained using an automated, odorant-conditioning paradigm to discriminate 2 structurally unrelated odorants (citral and octanol). Nonreinforced probe trials were then introduced; probe trials were binary mixtures composed of varied ratios of citral and octanol. Since the relative concentrations of the specific components are critical for binary mixture perception (Münch et al. 2013; Rospars 2013), we created all binary mixtures from components presented relative to estimated behavioral thresholds for each animal. In order to vary task difficulty, binary mixture ratios were incrementally varied from the target alone by decreasing increments of 1% (v/v). If rats identified the S+ target odorant in the mixture (i.e., the novel mixture perceived as similar to the S+), they would lick during the probe stimulus presentation (i.e., display the same behavior as during the target). Conversely, if instead rats recognized the mixture as different from the target stimulus (i.e., as the S− odorant, or as something altogether novel), they would not lick. Behavioral RT, the latency from odor onset to lick response, was used to characterize rats’ assessment of odor identity (as S+ or S−).
Materials and methods
Subjects
Eight male F344 rats were used in this study. Rats were obtained at 3 months of age from the National Institute on Aging breeding colony (Taconic Biosciences), but were 12 months old at initiation of behavioral training. Rats were individually housed in the central Animal Care Services facility in the McKnight Brain Institute at the University of Florida. The rats were maintained on a 12/12-h light/dark cycle, and behavioral testing was conducted during the light cycle. Rats had ad libitum access to dry LabDiet rat chow (Purina Mills) and restricted access to water. This regimen resulted in the rats stabilizing at 85–90% of their free-feeding body weight, which facilitated use of a nutritional liquid food reinforcer during training and testing procedures (Ensure; Abbott Laboratories). During a typical session, rats received ~10mL of Ensure, followed by 2h of unrestricted access to water after daily testing. Rats were tested once daily, 5–7 days per week.
All experiments were conducted in accordance with the Guide for the Care and Use of Laboratory Animals (National Institutes of Health Publication no. 86-23, revised 1985) and were approved by the University of Florida Institutional Animal Care and Use Committee.
Olfactometer
An 8-channel, custom liquid-dilution olfactometer was employed in this study (Tamic Inc.). The behavioral apparatus, adapted for use with the rat, and methods employed in this study are comparable to those used in our previous work with this olfactometer in humans and mice, and detailed presentations of the training and testing techniques can be found in those previous publications (Smith et al. 2008; Gamble and Smith 2009; Yoder et al. 2014a, 2014b). The rat olfactometer was interfaced with a 21-cm deep, 30.5-cm wide, and 24.1-cm tall, ventilated Plexiglas operant chamber. The chamber was fitted with a conductive stainless steel floor and a PVC sniffing port containing a metal licking tube. A ventilation system provided a steady stream of fresh room air to the chamber, maintaining positive pressure and ensuring that the odorant remained within the sniffing port air stream.
A photo beam was broken when the rat inserted its head into the sniffing port, initiating a trial sequence. Rats were required to keep their noses within the port and sample the stimulus air stream for a minimum of 200ms, at which time a stimulus, either the S+ (target stimulus) or S− (control stimulus), as defined below, was introduced through the bottom of the port. The air stream and odorant were drawn through the port and then exhausted out of the top by an in-line exhaust fan and fed into a central room evacuation system. Stimulus delivery and behavioral responses were controlled and monitored by a PC running custom-built software.
Training
Training methods followed those described by Bodyak and Slotnick (1999). Briefly, the rat was initially rewarded for contacting the lick tube with its tongue, followed by nose pokes into the sampling port and finally for remaining in the sampling port during odorant presentation. During the last stage of training, the hold interval was increased and the rat was required to sample the odorant for intervals up to 1 s. To prevent possible learning effects that might influence the experimental results, different odorants were chosen for use during the initial phases of training. A 10% v/v solution of food-grade coconut extract (GFS) served as the initial training stimulus. Reliable performance on this task was achieved within 2 training sessions (45min to 1.5h) for all rats. Prior to the testing, rats therefore acquired an association between the target odorant and delivery of reinforcement. Once the rats successfully completed training, they were transferred to a 2-odorant discrimination program.
Rats were then trained to discriminate dilutions of the target (S+) (coconut extract) odorant in a diluent (diethyl phthalate) from the diluent alone (S−). Reinforcement was contingent upon the rat reporting detection of the S+ odorant by licking on the metal tube (correct detection), which completed an electrical circuit with the metal floor and registered the response with the PC-based olfactometer control program. A correct detection was followed by presentation of approximately 5 μL of Ensure through the lick tube. Failure to report the presence of the S+ (a miss) or licking the response tube during presentation of the S− stimulus (false alarm), were recorded as incorrect responses and required rats to withdraw their nose from the sampling port for 5 s, before reinserting their nose to initiate a new trial. Rats were required to respond to the target (S+) odor by making contact with the lick tube for at least 7 of 10 time bins (each spanning 100ms) during a 1-s odor presentation to receive the 5-μL liquid reinforcement. Conversely, if the rat refrained from licking during presentation of a control odorant (S−), the trial would be recorded as a correct rejection, thereby allowing the rat to initiate the next trial. Note that the rat was not required to lick during the control (S−) trials and therefore was free to leave the odor port once the decision was made.
Trials were presented in blocks of 20 (10 S+ and 10 S−). Within each block, the sequence of the 20 trials was quasi-random such that each stimulus was limited to 3 consecutive presentations. The percent correct was calculated (for both correct detection and correct rejection) individually for each block. Initial discrimination training consisted of 10 blocks (200 trials). Rats typically achieved criterion performance (85% or greater) within 2–4 blocks. The following training session consisted of a new target odorant (1% vanilla extract; GFS), and the rats were required to respond to the new target odorant, while ignoring the control (S−) odorant. A final training session consisted of 1 ppm (10−4% v/v) orange extract (GFS) as the target (S+) odorant and 1 ppm (10−4% v/v) vanilla extract as the control (S−) odorant. These additional sessions were incorporated to ensure the rats could form reward–response associations with new, different target odorants daily, while simultaneously ignoring/inhibiting responses to a previously learned target odorant.
Baseline threshold
To determine the relative levels of each individual component to be used to create different mixture ratios, thresholds for the target odorant alone (citral or octanol) were initially estimated for each rat. Citral and octanol were tested on separate days. Prior to each testing session, rats were exposed to 40 shaping trials (citral or octanol as target, at the individual threshold level for each rat). Similar to the training sessions described above, rats were reinforced for licking in the presence of the target odorant (either citral or octanol). These shaping trials enabled the rat to acclimate to the expected target odorant. Odorant concentrations decreased 10-fold for each new concentration, ranging from 100% v/v to 10−13% v/v. Rats were tested on each concentration for a total of 3 blocks before proceeding to the next concentration. During a given session, rats were allowed to remain in the testing chamber for as long as they continued to initiate trials. The percent correct was calculated (for both correct detection and correct rejection) individually for each block. “Threshold” was recorded as the lowest concentration at which the rat achieved ≥85% on 1 of 3 consecutive blocks, and this concentration was used in the creation of all binary mixtures for each individual animal. Following threshold testing, all subsequent experiments were performed at the individual threshold levels for each rat.
Behavioral testing
Figure 1 shows the experimental timeline for behavioral testing. Prior to each experimental session, dilutions were created specifically for each rat. Given that certain rats displayed greater sensitivity to a particular compound (or greater overall sensitivity, relative to the other rats), it was critical that probe trials be tested at levels corresponding to the relative perceptual sensitivity of each rat. Citral and octanol served as the either the target (S+) odorant or control (S−) odorant on alternating days. This approach was intended to minimize formation of odor-reward associations with a given odorant. Similar to the training session described above, rats were reinforced for licking in the presence of the target (S+) odorant (citral or octanol). Following the initial threshold estimates, dilutions were prepared each day corresponding to the individual thresholds for each rat for both citral and octanol. Prior to introducing mixture ratio probe trials, all rats were required to maintain 100% accuracy at their given threshold for both odorants. To achieve this criterion, rats were trained for ~5 days to discriminate their threshold level from the odorless control (diethyl phthalate), resulting in 20–30 blocks of “overtraining.” At this point, to ensure that the rats would respond appropriately to a given odorant, even in the absence of reward, the rats were switched to a variable ratio (VR 2) schedule of reinforcement, which served to acclimate them to presentation of nonreinforced probe trials. Criterion performance for the VR 2 reinforcement schedule was set to 100% accuracy on 3 consecutive blocks. Once the rats acquired VR 2 reinforcement criterion performance, they were considered sufficiently trained to add nonreinforced, probe trials. Task acquisition varied across animals, from 8 to 15 blocks for both odorants.
Figure 1.
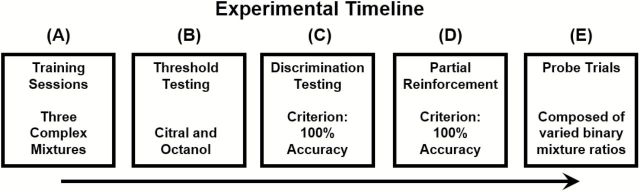
Experimental timeline. (A) Prior to testing, all rats were required to pass a series of basic discrimination tasks. During the first 2 sessions, rats had to discriminate a complex mixture (coconut extract; vanilla extract) from an odorless control (diethyl phthalate). After reaching criterion performance (85%) on both sets, the reinforcement contingency was reversed for one of the odorants (vanilla extract). Under this condition, rats had to discriminate 2 complex odorants (orange extract vs. vanilla extract). Criterion remained unchanged. (B) Following discrimination training, threshold estimates were obtained for each rat on both odorants (citral and octanol). Order of testing was pseudorandomized across rats. Thresholds were recorded as the lowest concentration at which the rats received 85% or better accuracy on 3 consecutive trials. (C) Rats were then trained to discriminate both citral and octanol from odorless, diethyl phthalate. Relative concentrations for both odorants were based on individual threshold values for each rat. All subsequent conditions were also presented at individual thresholds estimates. Rats were required to consistently achieve 100% accuracy on full reinforcement before moving forward. (D) Before proceeding to nonreinforced probe trials, rats had to demonstrate identical criterion performance (100% accuracy) on partial reinforcement. (E) Finally rats were presented with nonreinforced, mixture probe trials (2 per block, 22 trials total). Target trials retained a partial reinforcement schedule to reduce potential reward cues.
Dilutions for citral and octanol were created each day and from those dilutions (at individual threshold levels), the mixture ratios were then created. Thus, if a rat had a threshold of 10−11% citral and 10−8% octanol, then a 99:1 ratio for citral would be (9.9mL of 10−11% citral and 0.1mL of 10−8% octanol). During testing sessions, rats were required to complete a total of 10 blocks. Each block contained 22 trials (10 partially reinforced, S+ trials, 10 nonreinforced S− trials, and 2 nonreinforced—probe trials consisting of the S+/S− mixture ratio), a total of 220 trials. The S+/S− mixture ratios were presented in a pseudorandomized order, such that each block was tested only once per day (i.e., 10 mixtures were pseudorandomly chosen and tested each day). Table 1 shows the binary mixture ratios, calculated as volume/volume (v/v) mixtures of % citral and % octanol. A total of 5 separate blocks (sessions) were used to calculate responses for a given S+/S− ratio (n = 10 trials per ratio, 2 probe trials per block/session). If the rat licked in the presence of the mixture probe trial, suggesting that the mixture was “recognized” as the target (S+) odorant, the response was recorded as S+. Conversely, if the rat refrained from responding in the presence of the mixture, the response was recorded as S−, suggesting the rat recognized the mixture as the control (S−) odorant; these responses were not reinforced. RTs (the interval from the onset of the stimulus to initial contact with the lick tube) were obtained for all trials (S+ and S+/S− probe trials). These responses were then used to characterize how the rat perceived the mixture trials (S+:S−) with respect to the target (S+). Since rats were trained not to make contact with the lick tube during S− trials, RTs were not recorded for the nontarget odorants. Instead, rats would withhold responding, remove their heads from the odor port, and initiate the next trial.
Table 1.
Ratios and percentages of mixtures
| Mixture (S+:S−) | Target (S+), % v/v in mixture at threshold | Control (S−), % v/v in mixture at threshold |
|---|---|---|
| 100:0 | 100% | 0% |
| 99:1 | 99% | 1% |
| 98:2 | 98% | 2% |
| 97:3 | 97% | 3% |
| 96:4 | 96% | 4% |
| 95:5 | 95% | 5% |
| 94:6 | 94% | 6% |
| 93:7 | 93% | 7% |
| 92:8 | 92% | 8% |
| 91:9 | 91% | 9% |
| 90:10 | 90% | 10% |
| 89:11 | 89% | 11% |
| 88:12 | 88% | 12% |
| 87:13 | 87% | 13% |
| 86:14 | 86% | 14% |
| 85:15 | 85% | 15% |
| 84:16 | 84% | 16% |
Control procedures
The olfactometer used to conduct these studies contained 16 solenoid values for controlling stimulus delivery. To minimize possible detection of subtle auditory, or tactile cues, unused odorant valves (i.e., those not controlling delivery of either S+ or S− stimuli during that trial) were randomly activated across conditions to provide a “masking” noise. Locations of saturation bottles were pseudorandomized across sessions. Control tests were conducted to determine whether inadvertent odorant or nonodorant stimuli were available to the rats as discriminative cues. Control tests were administered by replacing the S+ odorant bottle with the diluent alone; in this case, both the S+ and S− saturator bottles contained identical volumes of the control (S−) stimulus. A second, quick control check was also conducted by simply closing off the S+ saturator bottle airflow during an S+ trial. Under both control conditions, trained rats performed at chance levels, indicating the absence of any nontarget discriminative cues. Finally, to ensure that the rats were responding only to presence of airflow (odor), an additional control measure consisted of disconnecting the stimulus stream. Under this condition, rats could initiate a trial, but receive no airflow. In the absence of airflow, rats consistently refrained from responding.
Stimuli
Vanilla extract (35% ethanol), orange extract (25% ethanol), and coconut extract (25% ethanol) purchased in bulk (Gordon Food Service) served as the initial training odorants. The aliphatic, primary alcohol octanol (CAS #111-87-5) and the aliphatic aldehyde citral (CAS #5392-40-5) were used as test odorants in this study. Citral is generally described as lemon-scented, whereas octanol has a citrus odor. Diethyl phthalate was used as the near-odorless diluent for all experiments (cf., Djordjevic et al. 2004; Can Güven and Laska 2012). Both test odorants and diluent were obtained from Sigma-Aldrich and contained a nominal purity of at least 98%.
Odorant concentrations are described in terms of liquid phase concentration (% v/v), though, due to the carrier flow rate, the odor concentration experienced by the rats was ~2.5% of the liquid concentration prepared in the saturation bottles. The stock odorants, once opened, were stored under inert gas (nitrogen) in glass and refrigerated to prevent oxidation. Serial dilutions of the target and control odorants were prepared using diethyl phthalate as a diluent. Ten milliliters of the liquid phase (citral or octanol) odorant, placed in a 500-mL glass saturation jar, served as either the target or control stimulus during experimental conditions. The olfactometer functioned by use of digitally controlled solenoid pinch valves, which briefly bubbled the stimulus air stream through a tube submerged in the liquid phase odorant to produce a volatilized stimulus that filled the headspace before introduction into the carrier stream and presentation to the rat.
Statistical analyses
Correlations between RTs and mixture ratios were evaluated using the Spearman rank correlation coefficient (SigmaPlot; Systat Software Inc.). Probe trials were analyzed across individual rats with 2-way ANOVA (factor 1: compound, factor 2: mixture ratio). Following 2-way ANOVA testing, all pairwise multiple comparison post hoc tests (Tukey’s honestly significant difference) were performed to determine significant differences. Level of significance was set to 0.05 and all tests were 2-tailed.
Results
Eight rats were trained and tested to discriminate 2 structurally unrelated odorants (citral and octanol). Individual baseline thresholds for octanol and citral are plotted for each rat in Figure 2. Each data point represents the mean accuracy (across 20 trials) for each target odorant concentration tested (% v/v). Thresholds are recorded as the lowest dilution at which the rat performed ≥85% correct on at least 1 of 3 consecutive blocks. Consistent with previous psychophysical studies in rodents (Youngentob and Margolis 1999; Vedin et al. 2004; Pho et al. 2005; Clevenger and Restrepo 2006; Yoder et al. 2014a, 2014b), baseline thresholds varied substantially between rats; estimated baseline thresholds for the octanol odorant ranged from 10−6 to 10−11% v/v, with a mean value of 2.8−7% v/v and 10−5 to 10−11% v/v, with a mean value of 1.3−7% v/v for citral. Though baseline threshold estimates were slightly lower for citral, differences were not statistically significant [F (1, 15) = 0.618, P = 0.445].
Figure 2.

Comparison of individual threshold rat estimates, estimated from response accuracy of octanol serial dilutions. Abscissa refers to descending concentrations (% v/v) of the aliphatic odorants. Each panel/symbol represents discrimination accuracy for the target odorant (1-octanol) versus the control odorant (diethyl phthalate) for an individual rat. Functions (lines with 3 symbols) represent accuracy across 3 consecutive blocks for each concentration. The lowest concentration at which the animal received 85% or greater on at least 1 of the 3 blocks was recorded as threshold.
After achieving 100% accuracy at their designated baseline thresholds, rats were switched to a VR 2 reinforcement schedule. Figure 3 shows blocks to criterion for VR 2 reinforcement. For octanol, the number of blocks required to reach criterion performance ranged from 8 to 15 with a mean value of 11±2. Likewise, for citral, the number of blocks required to reach criterion performance ranged from 10 to 14 with a mean value of 12±2. Though some rats required slightly longer to reach criterion performance on citral, differences were not statistically significant [F (1, 15) = 0.691, P = 0.42]. There was, however, a significant positive correlation between estimated baseline thresholds and blocks to criterion for the octanol target (Spearman, r s = 0.859, P = 0.002), such that rats with lower thresholds required more blocks to reach criterion. Conversely, baseline thresholds did not correlate with task acquisition for the citral target (Spearman, r s = 0.286, P = 0.46). Taken together, these data suggest that citral and octanol were relatively comparable in terms of threshold and the acquisition of discrimination.
Figure 3.

Trial blocks to criterion for partial reinforcement schedule (VR = 50) for individual animals. Each panel shows response accuracy for a blocks of 20 trials for an individual rat. Animals continued training until they discriminated the target odorant from the diluent (diethyl phtlate) at 100% for 3 consectutive blocks.
Following partial reinforcement training, nonreinforced, mixture probe trials were introduced (2 per block, n = 10 for each mixture ratio). To control for potential effects of introducing 2 additional trials, rats were also tested on probe trials (S+:S−) containing identical concentrations of the target odorant (100:0, no additional component added). Figure 4 compares mean RTs for the target (S+) trials and the nonreinforced probe trials of equal concentration. During the S+ trials, mean RTs were 173±68 for octanol and 176±73 for citral. Similarly, mean RTs were 167±84 for the octanol-target probe trials (Op, 100:0) and 156±80 for the citral-target probe trials (Cp, 100:0). RTs (ms) for the target (S+) trials and probe (S+:S−) trials were not statistically different for either octanol (P = 0.526) or citral (P = 0.144). Further, given that all rats were exposed to thousands of trials over the course of training and testing with these odorants, both individual and group variance was minimal. It was necessary for rats to be as proficient as possible identifying these compounds so that subsequent mixture probe trials could capture novelty effects. Importantly, rats always responded to the 100:0 probe trials as the target; no “misses” were observed. This suggests that overall performance remained unaffected by introducing 2 additional, nonreinforced trials to each block (i.e., each block contains 10 S+, 10 S−, and 2 S+:S−).
Figure 4.

Comparison of mean RTs for target (S+) trials and nonreinforced, probe trials of equal concentration. Mean values are not statistically different (i.e., reinforcement contingency does not affect RTs).
To compare the systematic shift in behavioral performance using novel, probe mixtures, Figure 5 shows individual RTs for both the octanol probe (Op) trials (n = 560) and citral probe (Cp) trials (n = 1280). Differences in the number of trials completed for citral and octanol probes were due to asymmetrical responding (depending on which component was the S+). Additional mixtures were tested, but only those ratios to which the rats responded (licked) are displayed (see Table 1). Other ratios (example: 60:40) appeared to be too easily distinguished as different from the S+ odorant, as rats rapidly removed their noses from the odor port during presentation of such stimuli. Individual RTs (ms) are displayed for each mixture ratio. RTs were recorded as the duration from stimulus onset to behavioral licking response. Ten probe trials were tested at each ratio for both Op and Cp. All 8 rats consistently licked on the mixture ratios shown. Regression lines are shown to emphasize both the linear relationship between the ratios and the RTs, as well as to highlight the performance differences between the 2 target odorants. For all rats, RTs increased as a function of mixture ratio, such that decreasing the S+ volume and increasing the S− volume in the binary mixtures resulted in longer RTs. Moreover, slopes were steeper (more rapid increases) for the Op trials. Comparatively, RTs increased less rapidly for the Cp trials, when octanol was the S− odorant. Most rats stopped responding at the ratio 94:6 for the Op trials and 86:14 for the Cp trials, suggesting a perceptual asymmetry in the interaction of citral and octanol in the binary mixture. Although individual RTs varied across rats, there was a general trend toward increased RTs as the S+ component in the mixture ratios (S+:S−) decreased.
Figure 5.
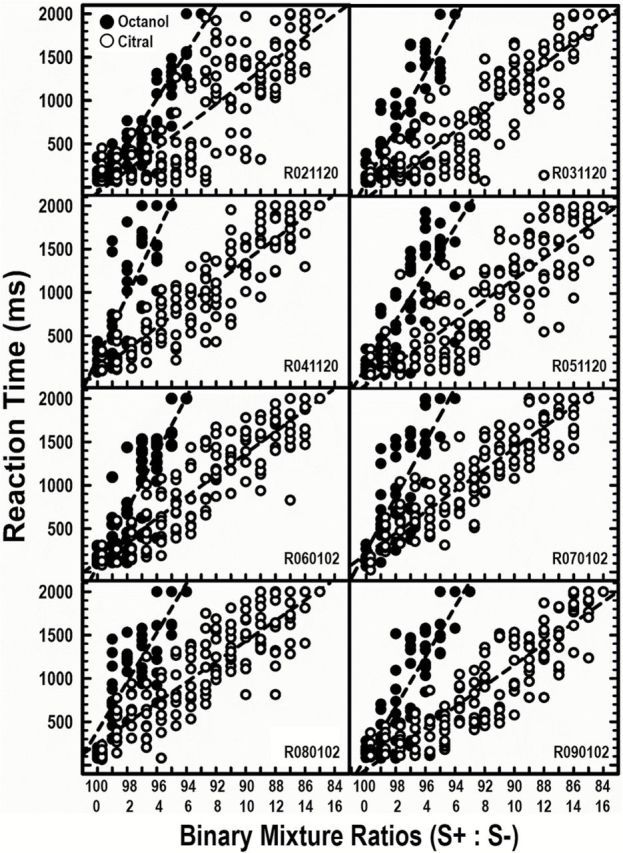
RTs for individual rats at different binary mixture ratios, with both citral and octanol as S+ target odorant. Mean RTs for individual rats for each binary mixture ratio presented, with citral as S+ target (filled symbol) and with octanol as S+ target (open symbol).
To further emphasize the distinct response patterns associated with each odorant, Figure 6 compares the mean RTs for both citral and octanol probe trials. Subsequent mixture ratios, above 94:6, could not be compared as the rats stopped responding to the Op trials. Most rats stopped responding (did not lick) at the ratio 94:6 for Op and 85:15 for Cp, suggesting citral was the dominant component in these binary mixtures. Repeated measures ANOVA revealed a main effect of compound [F (1, 1) = 57.443, P < 0.001] and mixture ratio [F (1, 5) = 26.824, P < 0.001], as well as a ratio × compound interaction [F (2, 5) = 9.980, P < 0.001]. Multiple pairwise comparisons revealed that RTs changed systematically as the mixture ratios became less similar to the target for both Op and Cp (P < 0.001). Likewise, mean response times increased slower for Cp trials than for Op, suggesting that responses were influenced by the dominant mixture component.
Figure 6.

Group mean RTs for binary mixture ratio probe trials of F344 rats (N = 8). RTs were recorded as the response delay (ms) from the onset of the stimulus to initial contact with the lick tube. Mean RTs for nonreinforced probe trials containing binary mixtures comprised of different mixture ratios of component A (citral) and component B (octanol); when the animals were trained to respond to citral as the target (S+) odorant (open symbols), and filled circles represent mean RTs when trained to respond to octanol as the target (S+) odorant. Trials in which the animals refrained from licking in the presence of the probe stimulus were recorded as 2000ms (the total response time provided). Error bars indicate standard error.
There was a significant negative correlation between RT and mixture ratio for both octanol (Spearman, r s = 0.878, P > 0.001) and citral (Spearman, r s = 0.875); RTs increased as mixture ratios varied further from the target odorant alone, reflecting a direct correlation for both octanol (Op: R 2 = 0.77, P < 0.001) and citral (Cp: R 2 = 0.76, P < 0.001). Given this pattern, it can be inferred that rats hesitated before identifying the mixture as the target when the S+ component decreased and the S− component increased.
Lastly, the relative differences in RT slope for the 2 S+ odorants shows that changes in RT growth with mixture content was significantly dependent on which odorant was specified as S+; a smaller amount of citral was required to mask the presence of octanol (94:6), than the octanol content necessary to mask the presence of citral (85:15). This pattern suggests an asymmetric interaction between citral and octanol.
Discussion
Using a RT measure, the present study characterized the ability of behaviorally trained rats to identify either 1 of 2 odorants (citral or octanol) as the target in binary mixtures varying in the ratio of constituent components. The ratio of the 2 components in the mixture was varied block-to-block during each test session and the target odorant (citral or octanol) was changed daily. The data show that RT measures are extremely sensitive to small changes in stimulus conditions, in that RT changed systematically with mixture ratio. RTs measured in the present work agree well with previous RT estimates in behaviorally trained rats for monomolecular odorants, specifically for both octanol and citral (Uchida and Mainen 2003; Abraham et al. 2004). Taken together, those studies, with the present data, demonstrate the sensitivity of behavioral RT to incremental changes in suprathreshold stimulus quality.
Interestingly, the present results also show that the increase in RT with changes in binary mixture ratio was significantly dependent on which of the 2 components was specified as the target (S+) stimulus; RTs increased relatively more rapidly when octanol was the target, compared with when citral was the target. These results suggest that the interaction between citral and octanol was asymmetric, and that relatively less citral was required to alter the detectability of the octanol, than vice versa. This type of perceptual asymmetry has been reported in humans and suggests that the overall perception of binary odorant mixtures is determined by the contribution of the dominant component, likely resulting from differences in binding affinity or from some form of odorant antagonism (cf., Wise and Cain 2000; Atanasova et al. 2005; Brodin et al. 2009), which is well documented in olfactory sensory neurons (cf., Kurahashi et al. 1994; Duchamp-Viret et al. 2003; Ache 2010; Ukhanov et al. 2010). In the present case, the asymmetry agrees well with evidence that citral is an antagonist of octanol activation in olfactory receptors (Peterlin et al. 2005; Ukhanov et al. 2010).
It has long been known that the perceptual qualities of odorants, whether alone or in mixtures, are dependent on odorant concentration (cf., Cometto-Muñiz et al. 2003, 2005; Wise et al. 2007; Brodin et al. 2009). Likewise, a number of studies have characterized changes in olfactory receptor range with odorant concentration, suggesting that the nature of receptor specificity for single odorants is concentration-dependent (Malnic et al. 1999; Duchamp-Viret et al. 2000; Rospars et al. 2008). Moreover, numerous studies have shown substantial intersubject variations in sensitivity for the same odorant (Youngentob and Margolis 1999; Vedin et al. 2004; Pho et al. 2005; Clevenger and Restrepo 2006; Yoder et al. 2014a, 2014b). Hence, in the current study, presenting the 2 odorants to different subjects at the same absolute concentration would, therefore, likely result in differences between rats in relative concentration. By first estimating the rats’ detection thresholds for each binary component, we were able, as best as possible, to set the level of the 2 odorants to equal “intensity” within, and across subjects. By employing low, threshold-level odorant components, we also sought to avoid some of the loss of receptor specificity that is observed at high concentrations, which can complicate understanding of underlying receptor mechanisms (Sokolic et al. 2007). This point is especially crucial because, in the present case, the results suggest an asymmetric interaction between the two odorants.
Although it is common in animal psychophysical studies to reward “correct” responding to a target odorant, a critical issue in our experimental design was the use of a variable ratio schedule of reinforcement and of unrewarded probe trials. Given the impressive quality of the rat olfactory system, as well as the behavioral abilities of the rat, there are few doubts that the rats could be trained to identify even minute amounts of the target odorant in a binary mixture. For example, although rats have difficulty discriminating some enantiomer pairs using a habituation paradigm, they can readily be trained using positive reinforcement to discriminate the same pairs (Linster et al. 2001; Linster et al. 2002). Furthermore, Kay and Laurent (1999) have shown that the firing of individual mitral cells during odor-associated behavioral tasks can be modulated by contingent reinforcement. Hence, there is the potential that by rewarding responses to probe trials, (or not rewarding such responses when all other responses to S+ stimuli are rewarded), rats could be “taught” to signal whether or not the target odorant was present in the binary mixture. Instead, the current study was designed to “ask” the rats to identify whether or not the target component was present, so as to characterize how that judgment (or percept) changed with the mixture ratio. The systematic increases in RTs clearly demonstrate that incremental increases in the S− component in the binary mixture result in systematic increases in the difficulty in identifying the target.
The present results show that small, progressive changes in binary odor mixture ratio produce systematic changes in behavioral RTs. Using binary mixtures, it is possible to create unique odorant gradients, or continua, to study small changes in odor quality perception in an animal model. The present data highlight the sensitivity of RT measures, particularly in rats, and suggest a number of potential uses. Receptor mechanisms underlying the processing of complex odorants have evolved to support behavior. Use of behavioral RT measures with odorant mixtures, like those used here, provide a unique and powerful opportunity to study those receptor mechanisms and how they contribute to overall changes in the perceptual “quality” of the odor. It has been demonstrated that impaired odor recognition correlates with spatial memory loss in aged rats (LaSarge et al. 2007; Eichenbaum and Robitsek 2009). Current work in our laboratory, for example, uses these odorant gradients in the F344 aged rat model to study individual differences in normal aging and to identify olfactory biomarkers of neurodegenerative diseases.
Funding
This work was supported by the McKnight Brain Research Foundation, University of Florida and NIH R01 AG024671 to Jennifer L. Bizon.
References
- Abraham NM, Egger V, Shimshek DR, Renden R, Fukunaga I, Sprengel R, Seeburg PH, Klugmann M, Margrie TW, Schaefer AT, et al. 2010. Synaptic inhibition in the olfactory bulb accelerates odor discrimination in mice. Neuron. 65(3):399–411. [DOI] [PMC free article] [PubMed] [Google Scholar]
- Abraham NM, Guerin D, Bhaukaurally K, Carleton A. 2012. Similar odor discrimination behavior in head-restrained and freely moving mice. PLoS One. 7(12):e51789. [DOI] [PMC free article] [PubMed] [Google Scholar]
- Abraham N, Spors H, Carleton A, Margrie T, Kuner T, Schaefer AT. 2004. Maintaining accuracy at the expense of speed: stimulus similarity defines odor discrimination time in mice. Neuron. 44(5):865–876. [DOI] [PubMed] [Google Scholar]
- Ache B. 2010. Odorant-specific modes of signaling in mammalian olfaction. Chem Senses. 35(7):533–539. [DOI] [PMC free article] [PubMed] [Google Scholar]
- Atanasova B, Thomas-Danguin T, Chabanet C, Langlois D, Nicklaus S, Etiévant P. 2005. Perceptual interactions in odour mixtures: odour quality in binary mixtures of woody and fruity wine odorants. Chem Senses. 30(3):209–217. [DOI] [PubMed] [Google Scholar]
- Bodyak N, Slotnick B. 1999. Performance of mice in an automated olfactometer: odor detection, discrimination and odor memory. Chem Senses. 24(6):637–645. [DOI] [PubMed] [Google Scholar]
- Brodin M, Laska M, Olsson MJ. 2009. Odor interaction between Bourgeonal and its antagonist undecanal. Chem Senses. 34(7):625–630. [DOI] [PubMed] [Google Scholar]
- Can Güven S, Laska M. 2012. Olfactory sensitivity and odor structure-activity relationships for aliphatic carboxylic acids in CD-1 mice. PLoS One. 7(3):e34301. [DOI] [PMC free article] [PubMed] [Google Scholar]
- Clevenger AC, Restrepo D. 2006. Evaluation of the validity of a maximum likelihood adaptive staircase procedure for measurement of olfactory detection threshold in mice. Chem Senses. 31(1):9–26. [DOI] [PubMed] [Google Scholar]
- Cometto-Muñiz JE, Cain WS, Abraham MH. 2003. Quantification of chemical vapors in chemosensory research. Chem Senses. 28(6):467–477. [DOI] [PubMed] [Google Scholar]
- Cometto-Muñiz JE, Cain WS, Abraham MH. 2005. Odor detection of single chemicals and binary mixtures. Behav Brain Res. 156(1):115–123. [DOI] [PubMed] [Google Scholar]
- Djordjevic J, Zatorre RJ, Petrides M, Jones-Gotman M. 2004. The mind’s nose: effects of odor and visual imagery on odor detection. Psychol Sci. 15(3):143–148. [DOI] [PubMed] [Google Scholar]
- Duchamp-Viret P, Duchamp A, Chaput MA. 2000. Peripheral odor coding in the rat and frog: quality and intensity specification. J Neurosci. 20(6):2383–2390. [DOI] [PMC free article] [PubMed] [Google Scholar]
- Duchamp-Viret P, Duchamp A, Chaput MA. 2003. Single olfactory sensory neurons simultaneously integrate the components of an odour mixture. Eur J Neurosci. 18(10):2690–2696. [DOI] [PubMed] [Google Scholar]
- Eichenbaum H, Robitsek RJ. 2009. Olfactory memory: a bridge between humans and animals in models of cognitive aging. Ann N Y Acad Sci. 1170:658–663. [DOI] [PMC free article] [PubMed] [Google Scholar]
- Friedrich RW. 2006. Mechanisms of odor discrimination: neurophysiological and behavioral approaches. Trends Neurosci. 29(1):40–47. [DOI] [PubMed] [Google Scholar]
- Gamble KR, Smith DW. 2009. Discrimination of “odorless” mineral oils alone and as diluents by behaviorally trained mice. Chem Senses. 34(7):559–563. [DOI] [PubMed] [Google Scholar]
- Haddad R, Lanjuin A, Madisen L, Zeng H, Murthy VN, Uchida N. 2013. Olfactory cortical neurons read out a relative time code in the olfactory bulb. Nat Neurosci. 16(7):949–957. [DOI] [PMC free article] [PubMed] [Google Scholar]
- Johnson BA, Ong J, Leon M. 2010. Glomerular activity patterns evoked by natural odor objects in the rat olfactory bulb are related to patterns evoked by major odorant components. J Comp Neurol. 518(9):1542–1555. [DOI] [PMC free article] [PubMed] [Google Scholar]
- Karpov A. 1980. Analysis of neuron activity in the rabbit’s olfactory bulb during food-acquisition behavior. In: Thompson R, Hicks L, Shvyrkov VB, editors. Neural mechanisms of goal-directed behavior. New York: Academic Press; p. 273–282. [Google Scholar]
- Kay LM, Crk T, Thorngate J. 2005. A redefinition of odor mixture quality. Behav Neurosci. 119(3):726–733. [DOI] [PubMed] [Google Scholar]
- Kay LM, Laurent G. 1999. Odor- and context-dependent modulation of mitral cell activity in behaving rats. Nat Neurosci. 2(11):1003–1009. [DOI] [PubMed] [Google Scholar]
- Kay LM, Lowry CA, Jacobs HA. 2003. Receptor contributions to configural and elemental odor mixture perception. Behav Neurosci. 117(5):1108–1114. [DOI] [PubMed] [Google Scholar]
- Kurahashi T, Lowe G, Gold GH. 1994. Suppression of odorant responses by odorants in olfactory receptor cells. Science. 265(5168):118–120. [DOI] [PubMed] [Google Scholar]
- LaSarge CL, Montgomery KS, Tucker C, Slaton GS, Griffith WH, Setlow B, Bizon JL. 2007. Deficits across multiple cognitive domains in a subset of aged Fischer 344 rats. Neurobiol Aging. 28(6):928–936. [DOI] [PubMed] [Google Scholar]
- LaSarge C, Nicolle M. 2009. Comparison of different cognitive rat models of human aging. In: Bizon JL, Woods A, editors. Animal models of human cognitive aging, aging medicine. New York: Humana Press; p. 1–30. [Google Scholar]
- Linster C, Smith BH. 1999. Generalization between binary odor mixtures and their components in the rat. Physiol Behav. 66(4):701–707. [DOI] [PubMed] [Google Scholar]
- Linster C, Johnson BA, Morse A, Yue E, Leon M. 2002. Spontaneous versus reinforced olfactory discriminations. J Neurosci. 22(16):6842–6845. [DOI] [PMC free article] [PubMed] [Google Scholar]
- Linster C, Johnson BA, Yue E, Morse A, Xu Z, Hingco EE, Choi Y, Choi M, Messiha A, Leon M. 2001. Perceptual correlates of neural representations evoked by odorant enantiomers. J Neurosci. 21(24):9837–9843. [DOI] [PMC free article] [PubMed] [Google Scholar]
- Mainland J, Sobel N. 2006. The sniff is part of the olfactory percept. Chem Senses. 31(2):181–196. [DOI] [PubMed] [Google Scholar]
- Malnic B, Hirono J, Sato T, Buck LB. 1999. Combinatorial receptor codes for odors. Cell. 96(5):713–723. [DOI] [PubMed] [Google Scholar]
- Mobley AS, Rodriguez-Gil DJ, Imamura F, Greer CA. 2014. Aging in the olfactory system. Trends Neurosci. 37(2):77–84. [DOI] [PMC free article] [PubMed] [Google Scholar]
- Moody DB. 1970. Reaction time as an index of sensory function. In: Stebbins WC, editor. Animal psychophysics: the design and conduct of sensory experiments. New York: Springer; p. 277–302. [Google Scholar]
- Münch D, Schmeichel B, Silbering AF, Galizia CG. 2013. Weaker ligands can dominate an odor blend due to syntopic interactions. Chem Senses. 38(4):293–304. [DOI] [PMC free article] [PubMed] [Google Scholar]
- Perry C, Felsen G. 2012. Rats can make relative perceptual judgments about sequential stimuli. Anim Cogn. 15(4):473–481. [DOI] [PubMed] [Google Scholar]
- Peterlin Z, Ishizawa Y, Araneda R, Eckenhoff R, Firestein S. 2005. Selective activation of G-protein coupled receptors by volatile anesthetics. Mol Cell Neurosci. 30(4):506–512. [DOI] [PubMed] [Google Scholar]
- Pho V, Butman ML, Cherry JA. 2005. Type 4 phosphodiesterase inhibition impairs detection of low odor concentrations in mice. Behav Brain Res. 161(2):245–253. [DOI] [PubMed] [Google Scholar]
- Rospars JP. 2013. Interactions of odorants with olfactory receptors and other preprocessing mechanisms: how complex and difficult to predict? Chem Senses. 38(4):283–287. [DOI] [PubMed] [Google Scholar]
- Rospars JP1, Lansky P, Chaput M, Duchamp-Viret P. Competitive and noncompetitive odorant interactions in the early neural coding of odorant mixtures. J Neurosci. 28(10):2659–2666. [DOI] [PMC free article] [PubMed] [Google Scholar]
- Schoenbaum G, Setlow B, Nugent SL, Saddoris MP, Gallagher M. 2003. Lesions of orbitofrontal cortex and basolateral amygdala complex disrupt acquisition of odor-guided discriminations and reversals. Learn Mem. 10(2):129–140. [DOI] [PMC free article] [PubMed] [Google Scholar]
- Schoenfeld TA, Cleland TA. 2006. Anatomical contributions to odorant sampling and representation in rodents: zoning in on sniffing behavior. Chem Senses. 31(2):131–144. [DOI] [PubMed] [Google Scholar]
- Shusterman R, Smear MC, Koulakov AA, Rinberg D. 2011. Precise olfactory responses tile the sniff cycle. Nat Neurosci. 14(8):1039–1044. [DOI] [PubMed] [Google Scholar]
- Slotnick B. 2007. Odor-sampling time of mice under different conditions. Chem Senses. 32(5):445–454. [DOI] [PubMed] [Google Scholar]
- Smear M, Shusterman R, O’Connor R, Bozza T, Rinberg D. 2011. Perception of sniff phase in mouse olfaction. Nature. 479(7373):397– 400. [DOI] [PubMed] [Google Scholar]
- Smith DW, Thach S, Marshall EL, Mendoza MG, Kleene SJ. 2008. Mice lacking NKCC1 have normal olfactory sensitivity. Physiol Behav. 93(1-2):44–49. [DOI] [PMC free article] [PubMed] [Google Scholar]
- Sokolic L, Laing DG, McGregor IS. 2007. Asymmetric suppression of components in binary aldehyde mixtures: behavioral studies in the laboratory rat. Chem Senses. 32(2):191–199. [DOI] [PubMed] [Google Scholar]
- Uchida N, Mainen ZF. 2003. Speed and accuracy of olfactory discrimination in the rat. Nat Neurosci. 6(11):1224–1229. [DOI] [PubMed] [Google Scholar]
- Vedin V, Slotnick B, Berghard A. 2004. Zonal ablation of the olfactory sensory neuroepithelium of the mouse: effects on odorant detection. Eur J Neurosci. 20(7):1858–1864. [DOI] [PubMed] [Google Scholar]
- Ukhanov K, Corey EA, Brunert D, Klasen K, Ache BW. 2010. Inhibitory odorant signaling in mammalian olfactory receptor neurons. J Neurophysiol. 103(2):1114–1122. [DOI] [PMC free article] [PubMed] [Google Scholar]
- Wesson DW, Donahou TN, Johnson MO, Wachowiak M. 2008. Sniffing behavior of mice during performance in odor-guided tasks. Chem Senses. 33(7):581–596. [DOI] [PMC free article] [PubMed] [Google Scholar]
- Wise PM, Cain WS. 2000. Latency and accuracy of discriminations of odor quality between binary mixtures and their components. Chem Senses. 25:247–265. [DOI] [PubMed] [Google Scholar]
- Wise PM, Miyazawa T, Gallagher M, Preti G. 2007. Human odor detection of homologous carboxylic acids and their binary mixtures. Chem Senses. 32(5):475–482. [DOI] [PubMed] [Google Scholar]
- Yoder WM, Munizza O, Lyman M, Smith DW. 2014a. A technique for characterizing the time course of odor adaptation in mice. Chem Senses. 39(7):631–640. [DOI] [PubMed] [Google Scholar]
- Yoder WM, Setlow B, Bizon JL, Smith DW. 2014b. Characterizing olfactory perceptual similarity using carbon chain discrimination in Fischer 344 rats. Chem Senses. 39(4):323–331. [DOI] [PMC free article] [PubMed] [Google Scholar]
- Youngentob SL, Margolis FL. 1999. OMP gene deletion causes an elevation in behavioral threshold sensitivity. Neuroreport. 10(1):15–19. [DOI] [PubMed] [Google Scholar]