

Summary
Excessive expansions of glutamine (Q)-rich repeats in various human proteins are known to result in severe neurodegenerative disorders such as Huntington’s disease and several ataxias. However, the physiological role of these repeats and the consequences of more moderate repeat variation remain unknown. Here, we demonstrate that Q-rich domains are highly enriched in eukaryotic transcription factors where they act as functional modulators. Incremental changes in the number of repeats in the yeast transcriptional regulator Ssn6 (Cyc8) result in systematic, repeat-length-dependent variation in expression of target genes that result in direct phenotypic changes. The function of Ssn6 increases with its repeat number until a certain threshold where further expansion leads to aggregation. Quantitative proteomic analysis reveals that the Ssn6 repeats affect its solubility and interactions with Tup1 and other regulators. Thus, Q-rich repeats are dynamic functional domains that modulate a regulator’s innate function, with the inherent risk of pathogenic repeat expansions.
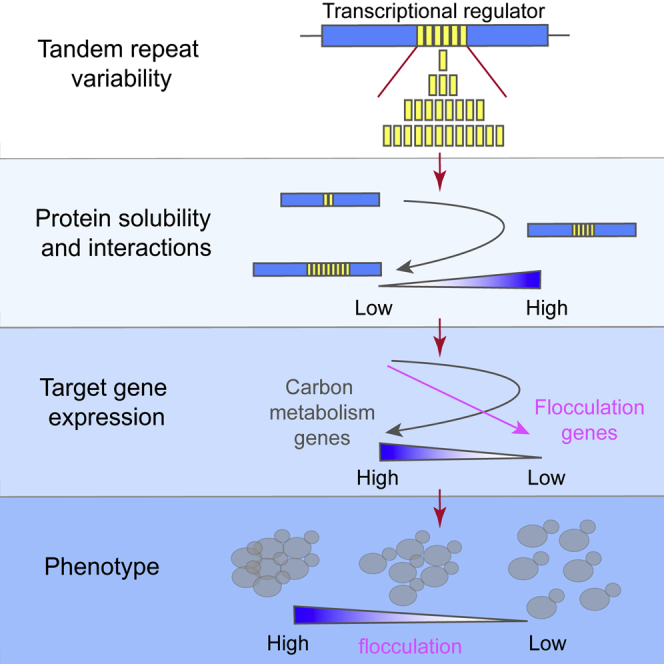
Graphical Abstract
Highlights
-
•
Glutamine-rich repeats are highly enriched in eukaryotic transcriptional regulators
-
•
Repeat variation in a fungal transcription factor changes expression of its targets
-
•
Variable repeats enable tuning of transcription factor solubility and interactions
-
•
Excessive repeat expansion results in TF malfunctioning and aggregation
Expanded glutamine-rich repeat domains within regulatory proteins are associated with devastating neurodegenerative diseases. However, Gemayel et al. show that these highly variable glutamine-rich repeats also have a functional role by modulating the solubility, interactions, and function of the transcriptional regulators in which they typically reside.
Introduction
Polyglutamine (polyQ) repeats have been associated with several human neurodegenerative diseases, including Huntington’s disease, Kennedy disease, and multiple spinocerebellar ataxias (reviewed in Orr and Zoghbi, 2007). Like other tandem repeat (TR) sequences, polyQ repeats show a high mutation rate, exceeding that of single-nucleotide polymorphisms by orders of magnitude (Legendre et al., 2007; Lynch et al., 2008). Specifically, repeats often shrink and expand at rates between 10−2 and 10−6 per generation. For repeats associated with neurodegenerative diseases, variation within certain limits is not pathogenic, and different individuals in the population often have different repeat lengths (Duitama et al., 2014). However, repeat expansion beyond a certain threshold causes disease, with longer expansions leading to earlier disease onset and faster progression. Pathogenic polyQ expansions have been shown to alter several cellular processes that can lead to neuronal dysfunction. They can modify the conformation of a protein and affect its interaction with partners (Schaffar et al., 2004), lead to depletion of tRNA and subsequent translational frameshifting (Girstmair et al., 2013), cause non-ATG translation and production of abnormal peptides (Pearson, 2011), and even alter normal proteasome function (Park et al., 2013). However, despite the ubiquitous presence of TRs in functional regions of genomes (Duitama et al., 2014; Legendre et al., 2007; Li et al., 2002) and the fact that many repeats are conserved over evolutionary timescales (Schaper et al., 2014), their functional significance outside of the pathological context remains unknown. Natural variation in the length of Q-rich repeats was often dismissed as unimportant neutral drift with no tangible phenotype or physiological role. Isolated studies in several organisms, however, reported instances where TR variation correlated with phenotypic changes (Fondon and Garner, 2004; Sawyer et al., 1997).
Although Q-rich repeats are enriched in eukaryotic transcriptional regulators (Gemayel et al., 2010; Legendre et al., 2007), a comprehensive understanding of their role, specifically whether their variation causes any functional changes, remains unanswered. First, using comparative genomics, we show that targets of Q-rich regulators have elevated gene-expression variation across multiple timescales, suggesting a role of Q-rich repeats in gene-expression regulation. To elucidate how variable Q-rich repeats might influence transcription, we generated multiple repeat variants of the yeast transcriptional regulator Ssn6 (Cyc8). We present direct experimental evidence showing that Ssn6 repeat-length variation affects the expression of target genes, which in turn results in a broad array of phenotypic changes. Using quantitative proteome analysis, we further demonstrate that Ssn6 solubility and its interaction with partners depend on the length of the repeat region. The Hsp70 chaperone Ssa2 helps to maintain Ssn6 function by reducing its intrinsic, repeat-length-dependent propensity to misfold and aggregate. Together, these results demonstrate that, while excessive repeat expansion is pathogenic, Q-rich repeats with normal lengths are functional domains that can help maintain and tune proper transcriptional regulation.
Results
Glutamine-Rich Transcription Factors Promote Target Gene-Expression Divergence
We scanned the open reading frames of all protein coding genes in genomes that span the eukaryotic diversity (yeast, fruit fly, zebrafish, mouse, human) using Tandem Repeat Finder (Benson, 1999). We find that 14%–20% of eukaryotic genes are enriched in TRs (Table S1). We defined repeats as Q rich if at least 85% of their translated sequence comprised glutamine residues (Table S1). Gene ontology analysis of these Q-rich genes versus all genes with repeats revealed a significant enrichment for regulatory functions such as transcriptional regulation and chromatin modification (Table S2). This is consistent with previous studies investigating the functional enrichment of repeat-containing proteins in various eukaryotic genomes (Faux et al., 2005; Gemayel et al., 2010; Legendre et al., 2007; Young et al., 2000). TRs are often unstable, with even closely related individuals or species showing differences in the number of repeated units in a “homologous” TR. This prompted us to ask whether repeats in transcription factors (TFs) can influence the variability of target gene expression. To address this, we first reconstructed a comprehensive yeast transcriptional regulatory network (TRN) by combining a previously published TRN (Balaji et al., 2006) with the recent genome-wide in vivo binding map of yeast regulatory proteins (Venters et al., 2011) (Figure 1A). We classified the target genes as those regulated by Q-rich TFs and those by non-repeat containing TFs (NR-TFs). We next analyzed gene-expression variation over long, intermediate, or short timescales by examining published datasets on yeast gene-expression variation across species (Tirosh et al., 2006), among strains (Choi and Kim, 2008), across generations (Landry et al., 2007), and between genetically identical cells at an instant (Newman et al., 2006). We find that target genes that are regulated by Q-rich TFs show significantly higher levels of expression divergence, expression variability, mutational variance, and expression noise than targets of NR-TFs (Figure 1B). Importantly, these differences in expression patterns of the targets are not explained by changes in expression patterns of the respective TFs (Figure S1A) or by differences in average transcript levels of targets (Figure S2A). Even if we only consider TFs with low expression variation across multiple time scales, the targets of Q-rich TFs still show higher expression divergence and variability and higher mutational variance than targets of NR-TFs (Figure S1B).
Figure 1.

Q-Rich TFs Influence Expression Variation of Targets across Different Timescales
(A) Yeast TRN reconstructed based on data from Balaji et al. (2006) and Venters et al. (2011). For the latter, promoter occupancy cutoff of at least 3-fold higher than background was considered. Based on the presence of Q-rich repeats, the TFs and their targets were categorized.
(B) Distribution of variation of expression among species and strains, across generations, and among genetically identical cells, of targets regulated by non-repeat containing TFs (NR-TFs) and TFs with Q-rich repeats (Q-rich TFs). The boxes represent the first and third quartile with the median at the black line. The notches correspond to ∼95% confidence interval for the median. The whiskers show data points up to 1.5 times the interquartile range. Statistical significance was assessed using Wilcoxon rank sum test. The effect sizes are represented by the common language effect size (CLES) statistic, describing the probability that a randomly selected target of Q-rich TFs will have higher expression variation than a randomly selected target of NR-TFs.
(C) Influence of expression plasticity on gene-expression variability. Distribution of expression plasticity of NR-TF and Q-rich TF targets is shown. The panels represent the median of expression variation across different timescales of targets of NR-TFs and Q-rich TFs in low (bottom 33.3%), medium (middle 33.3%), and high (top 33.3%) expression plasticity bins defined using tertile cuts of the distribution of all genes. p values were estimated using Wilcoxon rank sum test.
(D) Proposed model of target gene-expression variability over different time-scales facilitated by Q-rich TFs among genes with high dynamic expression modulation.
(E) Enrichment of targets with expression variation across different timescales for each Q-rich TF. Enrichment of targets with expression variation values higher than that of median of all Q-rich TF targets was tested using a permutation test. In each permutation, every target of a Q-rich TF was replaced with a random target from the TRN. The number of random targets with expression variation values equal or higher than the median of Q-rich TF targets was noted for 10,000 iterations. The color intensity in the heatmap represents Z scores, which indicate the distance of the number of real targets to the mean of random expectation in SD units. Statistically significant enrichment is highlighted with a red border. p values were estimated as the ratio of the average number of random targets with expression variation more than or equal to that of Q-rich TF targets over the total number of random samples (10,000).
See also Figures S1 and S2 and Tables S1 and S2.
While the targets of NR-TFs are enriched in processes related to gene-expression, those of Q-rich TFs were enriched for metabolic processes (Figure S2B). This prompted us to investigate whether Q-rich TF targets are on average more amenable to dynamic gene-expression regulation. To test this, we compared expression plasticity, which captures the magnitude of gene-expression variation to various conditions (Tirosh and Barkai, 2008). The results show that on average, Q-rich TF target genes show a larger range of expression modulation compared with NR-TF targets (Figure 1C) and those with high expression plasticity showed higher variation across different timescales (Figure 1D). Moreover, irrespective of the nature of the stimuli they respond to—exogenous (stress) or endogenous (developmental transitions, etc.)—Q-rich TF targets have higher expression variation across multiple timescales than targets of NR-TFs (Figures S2C and S2D). Taken together, our results suggest that among genes with highly dynamic gene-expression modulation, Q-rich TF targets tend to have enhanced expression variability at multiple timescales (Figures 1C and 1D).
Whole-Genome Transcriptomics Reveal Gradual and Quantitative Changes in Target Expression as a Result of SSN6 Repeat Variation
To assess whether the variability in Q-rich repeats within transcriptional regulators directly influences the expression of downstream targets, we chose the S. cerevisiae transcriptional regulator Ssn6 (Cyc8) (Chen et al., 2013; Tzamarias and Struhl, 1994; Wong and Struhl, 2011). Ssn6 is a TF that controls a large number of targets that show high expression variability (Figure 1E). The SSN6 coding sequence comprises two Q-rich repeat regions: a first polyQ stretch (residues 15–30), henceforth referred to as Tandem Repeat 1 (TR1), and a second Q-rich region, comprised of an array of QA repeats directly followed by a polyQ stretch (residues 493–587), referred to as TR2 (Figure 2A).
Figure 2.

The Q-Rich Repeats in Saccharomyces cerevisiae Transcriptional Regulator Ssn6 Show Variability between Natural Yeast Strains
(A) Schematic representation of the Ssn6 protein showing the two repeat regions. TR1 denotes the N-terminal polyQ (residues 15 to 30), and TR2 denotes the central Q-rich repeat (residues 493 to 587). The natural range of repeat number variation is indicated underneath each repeat region. See also Figure S3.
(B) The TR1 region of SSN6 from various S. cerevisiae strains was amplified by PCR.
(C) Amplification of the SSN6 TR2 region from various S. cerevisiae strains. The asterisks denote genetically close strains YPS606 (∗) and YPS128 (∗∗) with different TR2 sizes. See also Table S3.
(D) TR sizes in representative SSN6 variants constructed for this study. Total repeat numbers are given. The asterisk indicates the repeat number in the WT strain. Repeat numbers falling within the range observed in natural strains (C) are indicated.
To check for variability in the SSN6 repeats, we sequenced both repeat regions in a number of genetically and ecologically diverse S. cerevisiae strains (Liti et al., 2009) (Figures 2B and 2C; Table S3). Both regions showed variability in repeat number between yeast strains, with TR2 having a wider range of variation and also showing variation between closely related strains (Figure 2C). Similarly, we find Q-rich repeats in other transcriptional regulators (SWI1 and SNF5) to be variable between natural S. cerevisiae strains (Figure S3), indicating that the variability of the Ssn6 Q-rich repeat is typical for repeats in regulatory proteins.
To investigate the direct consequences of SSN6 repeat variation, we created a series of variants of the SSN6 TR1 and TR2 regions in the reference yeast strain Sigma1278b (Figure 2D). These variants included natural repeat lengths, as well as extremely short and long forms. This set of mutants allowed us to explore the outcomes of natural variability, as well as complete loss or long expansions of Q-rich repeats in Ssn6 controlled by its native promoter, in an otherwise isogenic background. As TR2 shows higher variability within the natural strains, we chose nine TR2 variants (natural variations: TR2-33, TR2-55, TR2-63; short variants: TR2-0, TR2-14, TR2-20, TR2-27; long variants: TR2-90, TR2-105) to investigate the influence of Q-rich repeats on gene-expression regulation. Using RNA sequencing, we profiled the transcriptome of the SSN6 TR2 variants in glucose-rich medium and during carbon starvation. As many as 153 genes showed significant changes in expression (log2 fold-change cutoff of 0.8 and false discovery rate (FDR) p < 0.01) in either the SSN6 TR2 deletion (TR2-0) or expansion (TR2-105) variant compared with the WT strain (TR2-63) in either culture conditions (Table S4). To further discriminate between noise and targets whose regulation is directly influenced by SSN6 TR2 number variation, we computed the autocorrelation function, which detects non-randomness in data, considering the SSN6 TR2 number as a series. By selecting SSN6 target genes that showed an autocorrelation coefficient ≥0.2 and the same expression trend in at least two consecutive repeat variants, we identified 89 targets whose regulation was TR2 length dependent (Figure 3A).
Figure 3.

Whole-Genome Transcriptomics Reveal that Variation in the SSN6 TR2 Region Influences the Expression of Target Genes
(A) Expression profiles for genes (rows) in different SSN6 TR2 variants (columns) in carbon-starved (left) or glucose-rich medium (right) measured by RNA-seq. The data are represented as relative to the expression levels in the WT (TR2-63), and similar colors indicate similar changes in expression relative to the WT strain. Enriched biological processes (Gene Ontology [GO] categories) of the target genes are shown (p < 0.05). Genes highlighted with arrows are key genes involved in alternative carbon transport and catabolism. The SUC2 gene that encodes the major sucrose-hydrolyzing enzyme is also highlighted. See also Figure S4 and Table S4.
(B) Many genes showing SSN6 repeat-dependent variation in expression are known targets of Ssn6. The figure represents a functional network of all genes whose expression is affected by SSN6 TR2 variation, with edge colors representing different types of interactions.
(C) Venn diagrams showing the overlap between genes whose expression is SSN6 TR2-dependent, genes with Ssn6-bound promoters (enrichment of 1.5-fold over background) (Venters et al., 2011) and genes showing de-repression upon TUP1 depletion from the nucleus (Wong and Struhl, 2011). The overlapping p values between our RNA-seq dataset and the other datasets were estimated by a chi-square test with Yates’ correction.
(D) SSN6 TR2 variation confers environment-dependent changes in fitness. The correlation between fitness and SSN6 TR2 number was assessed by a linear regression test. Data points represent mean ± SD, n = 3.
In the carbon-starved condition, we observe a positive correlation between the length of TR2 and the expression levels of a subset of genes (Group 1) and an inverse correlation for a second subset of genes (Group 2) (Figure 3A, left). Interestingly, for a number of targets belonging to Group 2, the expression increases again in the longest TR2 expansion variant (TR2-105). In other words, for these genes, the effect of SSN6 repeat deletion or long expansion is identical (see Discussion). In glucose-rich medium, the expression of the majority of targets follows an inverse correlation with TR2 length. Here again, expression in the TR2-105 variant is comparable to the TR2-0 variant for a subset of genes (Figure 3A, right). We confirmed these expression patterns by performing real-time qPCR measurements on seven target genes (Figure S4A).
Functional enrichment analysis revealed that the genes whose expression shows a direct correlation with TR2 (Group 1) during carbon starvation are mostly involved in alternative carbon transport and metabolism, including key genes of gluconeogenesis (PCK1, FBP1, ICL1-2, MLS1, IDP2). Genes that show the opposite expression trend (Group 2) are mostly involved in glycolysis (MAE1, CDC19, ENO2, GPM1), flocculation, and filamentous growth (FLO11, TIR3, NRG1, PHD1) or, notably, are TFs that (physically) interact with the Ssn6-Tup1 complex (YAP6, CIN5, NRG1, PHD1, SUT1) (Hanlon et al., 2011) (Figure 3A, left). The genes whose expression in glucose-rich medium is anti-correlated with TR2 length are mostly involved in hexose transport and metabolism (HXT5-6-7, HXK1), stress response (GPH1, HSP42, HSP12, GAD1, TSL1, DDR2), or flocculation and filamentous growth (FLO11, FLO10, BSC1, HMS1, MGA1) (Figure 3A, right). Importantly, we also find several highly induced cytosolic chaperones, including the “antiaggregase” HSP26, the inducible Hsp70 SSA4, and HSP30 and HSP33 only in the TR2-0 or TR2-105 variants (Table S4), suggesting a response of the protein folding machinery to deletion or expansion of the Ssn6 repeat.
Using published datasets on protein-protein, protein-DNA, and metabolic interactions, we constructed a network between SSN6 (CYC8) and its targets identified by RNA-seq (Figure 3B). This network shows that most targets are connected to SSN6 through direct protein-DNA interactions with TFs (CIN5, PHD1, YAP6, NRG1, and SUT1) that act as hub proteins connected to SSN6 by direct protein-DNA as well as protein-protein interactions. Furthermore, we find significant overlap between the genes whose expression is identified as SSN6 TR2-dependent in this study and (1) de-repressed genes upon Tup1 nuclear depletion (Wong and Struhl, 2011) and (2) SSN6 target promoters identified by chromatin immunoprecipitation (ChIP) (Venters et al., 2011) (Figure 3C). This observation, along with the fact that most genes identified by our RNA-seq could be included in an interaction network, suggests that these genes are bona fide SSN6 targets and that the observed changes in their expression are most likely a direct consequence of changes in the number of SSN6 TR2.
To investigate whether this variation in gene expression under changing nutrient availability has phenotypic consequences, we measured growth of the TR2 variants in alternative carbon or nitrogen sources using the Phenotype MicroArrays (Biolog). While we find no significant differences in growth when glucose is the sole carbon source, the fitness of the variants increases linearly with TR2 number when fructose or galactose is used (Figure 3D). Interestingly, this fitness trend closely resembles the expression pattern of key genes involved in alternative carbon transport and metabolism (highlighted in Figure 3A, left). Moreover, growth in sucrose mirrors the more complex expression pattern of SUC2 (the major sucrose hydrolyzing enzyme) (highlighted in Figure 3A, right) and growth in the presence of α-Amino-N-Valeric Acid (Norvaline) as the sole nitrogen source is anti-correlated with TR2 number (Figure 3D).
We next analyzed the SSN6 TR2 variants for phenotypes associated with FLO11 and IMA1, two target genes (highlighted in Figure 3B) that underlie very specific and quantifiable phenotypes: FLO11 mediates complex colony morphology (induced by growth on sucrose) (Voordeckers et al., 2012b), invasive growth (induced by glucose starvation) (Brückner and Mösch, 2012), adhesion to plastic (Reynolds and Fink, 2001), and flocculation (Verstrepen and Klis, 2006), while IMA1 is a glucosidase required for growth on palatinose (a naturally occurring disaccharide) (Brown et al., 2010; Voordeckers et al., 2012a). All the Flo11-related phenotypes presented a common response to variation in SSN6 TR2 number: colonies showed more “wrinkled” surfaces, stronger agar invasion and plastic adhesion, and higher flocculation levels in the short SSN6 TR2 variants (Figure 4D). These phenotypes gradually decrease with increasing TR2 number. On the other hand, the Ima1-dependent growth rates on palatinose closely follow Ima1 levels in these TR2 variants (Figure 4D). Together, this analysis demonstrates that Ssn6 TR2 variation results in changes in the expression levels of its target genes and also results in corresponding changes in fitness in different nutrient environments. Moreover, these transcriptomics and phenotypic data are in keeping with the results of the genome-scale analysis showing that the targets of Q-rich TFs are enriched in metabolic processes (Figure S2B).
Figure 4.

Correlation between Ssn6 TR2-Dependent Variation in Target mRNA, Protein Levels, Expression Noise, and Associated Phenotypes
(A) Mean mRNA levels, measured by RNA-seq are expressed as fold change relative to the WT (TR2-63 variant). Mean fluorescence of the corresponding reporter was measured by flow cytometry. Data points represent mean ± SEM, n = 5. See also Figure S5.
(B) Analytical flow cytometry of single-cell fluorescence distributions of SSN6 target genes in the TR2 variants. A representative histogram for flo11::YFP (promoter fusion), IMA1-YFP, and CIN5-RFP (protein fusions) in each TR2 variant is shown. Expression noise (defined by the standard deviation divided by the mean fluorescence; i.e., magnitude of variability as a percentage of expression level) (Raser and O’Shea, 2004) was calculated from the fluorescence distributions. Data points represent mean ± SD, n = 5.
(C) Images show flo11::YFP fluorescence in the SSN6 TR2 variants. Cells were analyzed by live-cell fluorescence and differential interference contrast (DIC) microscopy.
(D) Adhesion to plastic and flocculation intensity correlate with FLO11 expression levels. Data points represent mean ± SD, n = 2. Colony morphologies of the SSN6 TR2 variants show a graded variation in complexity on YP-sucrose. The agar invading capacity is also TR2-length dependent. Cultures were spotted on YPD plates and pictures taken after 11 days of growth at 30°C (pre-wash). The plates were then washed under water to remove non-agar-invading cells (post-wash). Growth rates in palatinose correlate with IMA1 expression. Data points represent mean ± SD, n = 3.
To confirm that Q-rich repeats can be functional domains in transcriptional regulators and that our main observations are not limited to Ssn6, we investigated the effect of deletion of the polyQ repeat in Snf5, a subunit of the SWI/SNF chromatin remodeling complex in S. cerevisiae. Deletion of the polyQ resulted in lower expression of known Snf5 targets (Figure S5A). Additionally, using a fluorescent reporter for PHO84 (a high-affinity phosphate transporter), we show that Snf5 polyQ deletion leads to lower steady-state expression of PHO84 and to differences in PHO84 induction in response to variable concentrations of extracellular phosphate (Figure S5B). Together, these results show that the Q-rich repeat influences the function of Snf5, similar to what we observed with Ssn6.
Variable SSN6 Repeats Contribute to Target Expression Noise
We next asked whether SSN6 repeat variability affects the expression noise of its targets (i.e., stochastic cell-to-cell differences in gene expression), as suggested by our genome-scale observations (Figure 1B). We grew fluorescent reporter strains of three targets (FLO11, IMA1, and CIN5) identified by RNA-seq (highlighted in Figure 3B) in appropriate media for more than ten doublings, maintaining them at low cell density to ensure steady-state levels of expression. First, protein levels measured using reporter constructs closely follow the changes in mRNA levels, with the exception of Cin5 levels in the TR2-105 variant (Figure 4A). Second, the fluorescence distributions indicate that changes in SSN6 TR2 have target-specific effects on expression noise (Figure 4B). Specifically, flo11::YFP distributions show remarkable variability between the TR2 variants (Figures 4B and 4C), whereas IMA1-YFP distributions only show greater dispersion in the TR2-105 variant and CIN5-RFP fluorescence is homogeneous between all the variants (Figure 4B). This indicates that Q-rich repeat variation in the regulator could be one of the factors that contributes to expression noise and this effect is target dependent.
Ssn6 Q-Rich Repeat Variation Results in Changes in Its Stability and Interactome
How does repeat variation lead to changes in Ssn6 function? Quantitative real-time PCR analysis showed that the expression of SSN6 is similar in all the TR2 variants and does not differ significantly from the WT allele (TR2-63) (Figure S4B). Moreover, expanded SSN6 repeats (TR2-105) are stable over multiple (>30) generations (Figure S6A), ruling out that TR2 repeat heterogeneity within a population would be responsible for the increased expression noise in some Ssn6 targets.
To check for changes in the Ssn6 stability and interactome, we fused the Ssn6 repeat variants (TR2-0, TR2-55, TR2-63, TR2-90, and TR2-105) to six copies of an HA epitope tag at their C terminus. Using gel-bound anti-HA antibodies, we isolated the tagged Ssn6 from soluble protein extracts. Bound proteins were separated by SDS-PAGE, followed by in-gel digestion and identification by mass spectrometry (Figure 5A, left). This qualitative approach shows that the interactomes of the repeat deletion and expansion variants are larger than that of the WT and also contain common elements (Figure 5A, left). Notably, these common interactors are involved in active chromatin remodeling (e.g., the histone variant H2AZ, Dot6, Yku80), transcription (Ppr1, Tfg1), and signaling (Pkc1, Bmh1, Ypt1). To confirm these results and to accurately quantify TR2-dependent changes in the Ssn6 interactome, we repeated the pull-down experiment and eluted the antibody-bound protein complexes. The eluted fractions were digested, and the peptide mixtures from the WT were labeled with a light isotope (12C3-propionate), while those from the TR2 variants were labeled with a heavy isotope (13C3-propionate). The labeled peptides from each TR2 variant and the WT were mixed 1:1 and analyzed by liquid chromatography-tandem mass spectrometry (LC-MS/MS) (Figure 5A, right). Among the 85 proteins detected, we considered the ones identified by at least two different peptides in all five TR2 variants tested (Table S5). We find >2-fold depletion of Ssn6 and its known interaction partner Tup1 in the TR2-105 variant relative to the WT (Figure 5A, right). Concurrently, we find a significant enrichment of the Hsp70 chaperone Ssa2 in the TR2 expansion (TR2-90 and TR2-105) and deletion (TR2-0) variants. Ssa2 is a cytosolic chaperone required for protein folding, translocation, and degradation of unfolded proteins. It also partners with Hsp40 co-chaperones to promote the refolding of aggregated or unfolded proteins (Verghese et al., 2012). Interestingly, we find that Ssa2 co-localizes with expanded Ssn6 in the nucleus, but not with the WT or TR2-0 variant (Figure 5B).
Figure 5.

TR2 Variation Modulates Ssn6 Solubility and Protein Interactions
(A) Identification of Ssn6 interactors. Shared and unique interacting proteins between WT Ssn6 (TR2-63) and the repeat deletion (TR2-0) or expansion (TR2-105) forms are shown. Quantification is shown of enriched or depleted proteins in pull-downs of representative TR2 variants (labeled with 13C isotope, H) relative to the WT (TR2-63) (labeled with 12C isotope, L). Data points represent mean ± SD, n = 2. p values were evaluated using the unpaired two-tailed t test. Asterisks indicate p < 0.05. See also Table S5.
(B) Co-localization of the Hsp70 chaperone Ssa2 and the expanded Ssn6 (TR2-105). Live cells of TR2 variants containing Ssn6-YFP and Ssa2-RFP fusion proteins were visualized by fluorescence and DIC microscopy.
(C) Ssa2 maintains Ssn6 function. Analytical flow cytometry profiles of flo11::YFP in the TR2 variants and their Δssa2 counterparts show how deletion of SSA2 affects the expression of the FLO11 target gene. See also Figure S6.
(D) Sequestration of expanded Ssn6 (TR2-105) in intranuclear foci (arrowheads) (left) and increased Ssn6 aggregation in the absence of Ssa2 (right). Live cells of TR2 variants containing Ssn6-YFP fusion and their Δssa2 counterparts were visualized by fluorescence and DIC microscopy. See also Figure S6.
(E) The SSN6 TR2 region modulates Ssn6 solubility. Cultures of HA-tagged Ssn6 TR2 variants were analyzed by protein aggregation assay. Soluble and insoluble fractions of Ssn6 were quantified by western blot. For each variant, the ratio of the respective fraction over the sum of the soluble and insoluble fractions was calculated. The horizontal line indicates the mean of the insoluble fraction of the WT Ssn6 (TR2-63). Data represent mean ± SD, n = 3 or n = 2. p values were evaluated using the unpaired two-tailed t test. Asterisks indicate p < 0.05, ns, not significant.
(F) Disruption of the Ssn6 TR2 conformation by proline insertions. Sequencing of the Ssn6 TR2 region show the replacement of two (mutant a) or three (mutants b and c) glutamine-alanine residues by prolines (red).
(G) The α-helical coiled-coil structure of TR2 is essential for Ssn6 function. Median flo11::YFP fluorescence in the QA/P mutants (a, b, c) (striped bars) is comparable to the TR2-0 variant (green bar). Data points represent mean ± SD, n = 2.
To assess whether Ssa2 is required for proper Ssn6 functioning, we deleted this chaperone in the flo11::YFP reporter strains. In general, we observed higher FLO11 levels in the Δssa2 background relative to the parental strains, indicative of a loss of (repressive) Ssn6 function (Figure 5C). The most dramatic functional change is observed in the TR2-105 variant, where median flo11::YFP levels increase ∼20-fold in the absence of Ssa2 and become homogeneous within the population (less expression noise) (Figure 5C).
The involvement of Ssa2 points to a TR2-dependent effect on the conformational dynamics of Ssn6. Aggregation is an intrinsic property of glutamine-rich repeats, and its propensity increases with repeat number (Krobitsch and Lindquist, 2000). Using fluorescence microscopy on Ssn6-YFP fusion proteins, we checked whether Ssn6 formed inclusions. We did not detect any inclusions in actively dividing cells (not shown), but when cells reached the stationary phase, the TR2-105 variant formed nuclear inclusions visible as bright foci (Figure 5D). Notably, deletion of Ssa2 leads to an increase in fluorescent foci in the TR2-105 variant and even the appearance of foci in the WT as well as in the TR2-0 variant (Figure 5D). This suggests that Ssa2 maintains proper Ssn6 folding and counteracts its intrinsic property to aggregate. We did not detect any change in the subcellular localization of Ssn6-YFP in any TR2 variant (not shown).
Under specific experimental conditions, Ssn6 can misfold into self-templating prion-like amyloid fibers (Patel et al., 2009). To determine whether the TR2-105 inclusions were prion aggregates, we devised a strategy to detect protein-only (i.e., non-mendelian) inheritance typical of prions. We crossed the TR2-105 variant with the TR2-0 variant or with the WT strain and scored the progeny for its colony morphology on YP-sucrose. TR2-105 colonies are smooth, TR2-0 very wrinkled, and TR2-63 moderately wrinkled on YP-sucrose. In both crosses, the morphology of the resulting progeny followed 2:2 segregation (Figure S6B), indicating mendelian inheritance of phenotype and ruling out Ssn6 prionization under these conditions.
To provide direct biochemical evidence that repeat expansion results in misfolding and aggregation of Ssn6, we performed an aggregation assay to assess the soluble and insoluble fractions of Ssn6 in the different TR2 variants (Figure 5E). While more than 80% of the WT Ssn6 can be found in the soluble fraction, almost 60% of TR2-105 and about 40% of the short TR2 variants (TR2-0 and TR2-55) of Ssn6 were recovered from the insoluble fraction (Figure 5E). Ssn6 TR2 is predicted to adopt an α-helical coiled-coil structure (Fiumara et al., 2010). To investigate whether this conformation is essential for Ssn6 function, we substituted two or three QA residues in the WT Ssn6 TR2 with single prolines, a strategy commonly employed for helix disruption (Figure 5F). In these QA/P mutants, FLO11 levels are identical to those in the TR2-0 variant, indicating that partial or complete impairment of the TR2 structure results in loss of Ssn6 function (Figure 5G). To further confirm that repeat expansion causes effects directly related to Ssn6 function, rather than being a general consequence of aggregation of a Q-rich repeat, we overexpressed, in the WT, a construct bearing a long, aggregation-prone Q-rich repeat (Krobitsch and Lindquist, 2000). Our results show that expression of this artificial repeat does not have any effect on FLO11 expression (Figure S6C), suggesting that the observed effects of TR2 variation are indeed directly related to Ssn6 function rather than being non-specific effects of polyQ aggregates.
Together, these results indicate that the Q-rich repeat length modulates the interaction of Ssn6 and its partner Tup1 and maintains a balance between correctly folded versus an aggregated Ssn6 and that Ssa2 is critical for maintaining a functional Ssn6.
Discussion
TRs are present in ∼20% of genes in the human genome, yet their functional significance is still not fully understood. In this study, we provide a detailed and direct investigation of the outcome of Q-rich repeat variation in a physiological context. We engineered S. cerevisiae strains that only differ in the number of repeats in the transcriptional regulator SSN6 (CYC8) to mimic the natural repeat variation as well variations outside the natural range. We provide evidence that even moderate variations in Ssn6 repeat number result in detectable functional changes. These are likely caused by changes in Ssn6 solubility and interaction with other proteins, including its prime partner Tup1 (Figure 6). Our study thus shows that Q-rich repeat variation results in changes in TF stability and interaction, which in turn leads to changes in the expression of its target genes and the phenotypes they control, supporting the notion that repeats could function as evolvable genetic tuning knobs of TF function (King et al., 1997).
Figure 6.

Model for a Functional Role of Variable Q-Rich Repeats in the Transcriptional Regulator Ssn6
Variation in the number of Q-rich repeats in Ssn6 may primarily affect the Hsp70 (Ssa2)-mediated folding dynamics of this transcriptional regulator and its interaction with Tup1 and other regulators. The ensuing functional changes in Ssn6 result in repeat-length-dependent variation in the expression of genes involved in various cellular processes. These expression changes underlie phenotypic diversity (e.g., flocculation strength).
Role of Variable Q-Rich Repeats in Modulating the Function of Ssn6
Q-rich repeats are enriched in transcriptional regulators in eukaryotic genomes from yeasts to humans. We first show, using genome-scale analyses in yeast, that targets of Q-rich regulators have higher expression variability across multiple timescales compared with targets of regulators devoid of repeats. We then experimentally demonstrate, using Q-rich repeat (TR2) variants of the yeast Ssn6, that repeat variation in a regulator results in expression changes of its direct targets (Figure 3A).
Interestingly, expression of some Ssn6 targets directly correlates with its TR2 length, whereas the expression of other targets follows an inverse trend. This is likely due to the fact that the Ssn6-Tup1 complex acts as a transcriptional repressor for some targets (Smith and Johnson, 2000) and a co-activator for others (Papamichos-Chronakis et al., 2002; Wong and Struhl, 2011). In line with these observations, we find that 22 of the 37 (∼60%) genes whose expression shows a positive correlation with SSN6 TR2 number (Group 1) have Cat8 and/or Adr1 binding sites in their promoters (Tachibana et al., 2005). These are carbon-responsive transcriptional activators required for transcription in low glucose. On the other hand, 17 of the 29 (∼60%) genes whose expression follows an opposite trend to increasing SSN6 TR2 (Group 2) contain Phd1 (or its homolog Cin5) and/or Nrg1 sites in their promoters. The network analysis further demonstrates how Ssn6 can act as a master regulator controlling the expression of these key TFs that are both direct SSN6 targets themselves (protein-DNA interactions) and Ssn6 partners (protein-protein interactions) (Figure 3B). Moreover, deletion of the Q-rich repeat in another transcription regulator, Snf5, resulted in similar changes in its target gene expression, suggesting that our observations for Ssn6 may represent a general phenomenon.
The almost identical response of diverse targets to SSN6 repeat variation points to a common underlying mechanism. We found that Ssn6 solubility and its interaction with Tup1 depend on its TR2 length and that the helical conformation of TR2 is essential for Ssn6 function (Figures 5F and 5G). This repeat region could behave as a flexible hydrophilic tract that increases the solubility of Ssn6 and also allows its flanking domains to come to spatial proximity, similar to the polyQ domain of huntingtin (Caron et al., 2013). Repeat shortening or expansion could impair the flexibility of this tract and consequently the conformational dynamics of Ssn6. In addition, Ssn6 repeat deletion or expansion variants acquire common interactors (Figure 5A), which could further contribute to the observed (and in some cases identical) functional changes. The Hsp70 chaperone Ssa2 likely counteracts the intrinsic, repeat-length dependent propensity of Ssn6 to aggregate.
Contribution of Unstable Q-Rich Repeats to Phenotypic Diversity and Evolvability
Expression divergence is key to the emergence of variable phenotypes. Here we provide evidence that links SSN6 repeat-dependent gene expression variation to phenotypic diversity. The Ssn6 TR2 variants show clear differences in fitness when grown on alternative carbon or nitrogen sources (Figure 3D). Importantly, these changes in fitness mirror the expression patterns of key metabolic genes induced during nutritional shifts (Figure 3A). We also observe changes in multicellular growth forms in the TR2 variants that are directly linked to changes in FLO11 expression (Figure 4D). These observations suggest that no single SSN6 repeat length offers optimal fitness in different environments. It is therefore tempting to speculate that repeat-dependent variation in gene expression might help to increase the phenotypic evolvability as it facilitates the emergence of variants fit in distinct environments. This would imply that the inherent instability of Q-rich repeats in TFs might in some cases be advantageous instead of purely neutral or even detrimental. Indeed, we observe that Ssn6 repeat expansion can, in some instances, have beneficial outcomes (e.g., higher fitness in alternative carbon sources). Chaperones like Ssa2 might help buffer the potentially negative effects of repeat variation, except in times of stress where the chaperone system can be overstretched, which can lead to the uncovering of the previously buffered effects of Q-repeat variation (Jarosz et al., 2010).
Our results agree with previous studies that show correlations between variation in TRs and phenotypes (Gemayel et al., 2010). A key study by Fondon and Garner (2004) implicated variable repeats in the regulatory gene Runx-2 as mediators of morphological evolution in domestic dogs. In Arabidopsis thaliana, variation in polyQ repeats of ELF3, a component of the circadian clock, also leads to morphological changes (Undurraga et al., 2012). Interestingly, in the human, mouse, and fly genomes, polyQ tracts are preferentially encoded by pure CAG repeats (Schaefer et al., 2012). This might indicate purifying (negative) selection, as without such selection, repeats are expected to gather non-synonymous mutations and consequently become less variable (Legendre et al., 2007).
Understanding the Pathogenesis of Polyglutamine Repeat Expansions
While our study primarily describes the physiological role of polyQ repeats, there are also links to polyQ expansion pathogenesis. First, our study shows how repeat variation in a regulator leads to changes in the expression of downstream targets and how repeat expansion beyond a certain threshold could lead to a global transcriptional dysregulation, a common observation in multiple polyQ expansion diseases (Gatchel and Zoghbi, 2005). In addition, we show that expanded Ssn6 acquires private interactors (Figure 5A). In line with what has been previously documented, these interactors are mainly involved in transcription/translation, chromatin modification, and protein folding (Friedman et al., 2007; Lam et al., 2006; Park et al., 2013; Schaffar et al., 2004). The loss of key cellular regulators through aberrant interactions (Schaffar et al., 2004) could also result in transcriptional dysregulation.
Proteostasis is another factor contributing to polyQ pathogenesis. PolyQ aggregates may not be directly responsible for pathogenesis, but are rather remnants of an overwhelmed proteasome system (Douglas and Dillin, 2010). This “proteasome hijacking” mechanism is directly linked to the pathogenesis of polyQ aggregates (Park et al., 2013; Tsvetkov et al., 2013). Our study identifies the Hsp70 chaperone Ssa2 as a key functional interactor of the Ssn6-Tup1 complex. In the absence of Ssa2, we observe increased aggregation of expanded Ssn6 (TR2-105). These findings highlight the importance of molecular chaperones in counteracting the pathogenesis of polyQ expansions and consolidate the emerging notion that bolstering the proteostasis system might be a therapeutic target for neurodegenerative diseases (Tsvetkov et al., 2013).
In summary, our study establishes a direct link between Q-rich repeat variation and changes in transcription regulator function and demonstrates that repeats may be more than just potentially harmful elements in genomes. Instead, by modulating the proteostasis and the protein interactions of the regulator in which they reside, repeat domains may help tune the expression levels of target genes and diversify underlying phenotypes.
Experimental Procedures
Molecular Techniques and Yeast Strains
Yeast genetic manipulations were performed using standard methods (Amberd et al., 2005). A detailed explanation of the strategy used to create the SSN6 repeat variants in the Σ1278b strain is provided in the Supplemental Experimental Procedures.
Transcriptome Analysis
Strains were grown overnight in YP 4% glucose then inoculated in fresh medium at an OD600 = 0.0005 and grown for 20 hr after which all samples had comparable (∼2%) glucose levels left. Each culture was subsequently divided in two equal volumes. One pellet was frozen at −80°C, and the other was used to inoculate fresh YP medium with no glucose and incubated for 2 hr at 30°C. Total RNA was isolated using the standard phenol-chloroform method (Amberd et al., 2005). For details on mRNA sequencing and analysis, see Supplemental Experimental Procedures.
Immunoprecipitation of Ssn6
Yeast cells were grown in YP 4% glucose until exponential phase, transferred to YP medium lacking any carbon source for 2 hr, and then harvested by centrifugation. Cell pellets were lysed by vortexing with glass beads in cold lysis buffer (50 mM Tris-HCl [pH 7.5], 100 mM NaCl, 1 mM EDTA, 10% glycerol, complete protease inhibitors; Roche), and extracts were cleared twice by centrifugation (10 min, 14,000 rpm at 4°C). Protein concentration in the soluble extracts was measured by the Protein Quantification kit (Sigma-Aldrich) and 4 mg of total protein was mixed with 20 μl EZview Red Anti-HA Gel (Sigma-Aldrich) for 1 hr at 4°C to isolate HA-tagged Ssn6. After three washes with lysis buffer, bound proteins were separated by SDS-PAGE and following in-gel digestion were identified by MS/MS. In a second identical experiment, bound proteins were eluted with 100 μg/ml HA peptide in lysis buffer without protease inhibitors. Eluates were digested overnight at 37°C with EndoLys-C protease and labeled and quantified by LC-MS/MS (see Supplemental Experimental Procedures).
Protein Aggregation Assay
Yeast cells were grown in YP 4% glucose until stationary phase, harvested by centrifugation, and lysed as described above. Extracts were cleared twice by centrifugation, and the supernatant contains the soluble fraction. The resulting pellet was washed with cold lysis buffer and resuspended (in the same volume as the soluble fraction) in insoluble protein buffer (8 M urea, 2% SDS, 50 mM Tris-HCl [pH 7.5], 100 mM NaCl, 1 mM PMSF, 2 mM dithiothreitol, complete protease inhibitors). After centrifugation at 14,000 rpm for 5 min at 4°C, the supernatant contains the insoluble fraction. Same volumes of soluble and insoluble fractions were used for SDS-PAGE and quantitative western blotting. Ssn6-HA was detected using anti-HA-HRP-conjugated antibody (0.5 mU/ml) (Roche, 3F10) using the LumiGLO Ultra chemiluminescence kit (KPL) at three exposure times (10 s, 30 s, and 1 min) to ensure that the signal was not saturated. Band intensities were quantified using ImageJ (http://rsb.info.nih.gov/ij/index.html).
Acknowledgments
Research in K.J.V. lab is funded by an ERC Starting Grant 241426, an HFSP program grant RGP0050/2013, KULeuven NATAR Program Financing, VIB, FWO, and IWT. We thank Bart Lievens and Ado Van Assche for help with the Phenotype MicroArrays (Biolog). We thank the UK Medical Research Council (MC_U105185859) (S.C. and M.M.B.) and the European Molecular Biology Organization (Long-Term Fellowship [S.C.] and Young Investigator Program [M.M.B. and K.J.V.]).
Published: August 6, 2015
Footnotes
This is an open access article under the CC BY-NC-ND license (http://creativecommons.org/licenses/by-nc-nd/4.0/).
Supplemental Information includes Supplemental Experimental Procedures, six figures, and five tables and can be found with this article online at http://dx.doi.org/10.1016/j.molcel.2015.07.003.
Accession Numbers
The accession number for the sequencing data reported in this paper is GEO: GSE70209.
Supplemental Information
TRs of nine or more units were first extracted from the genomes of S. cerevisiae, D. melanogaster, D. rario, M. musculus, and H. sapiens. From this list, we subsequently extracted Q-rich repeats, defined as repeats with at least 85% of glutamines in the translated sequence. Systematic gene names are given.
Genes containing Q-rich repeats are enriched for particular biological functions (column B) when compared with all repeat-containing genes in various eukaryotic genomes. The statistical significance value (adjusted p value) for each enriched category is given in column C.
These data are represented as log2 fold change in expression relative to the expression in the WT strain (TR2-63). A cutoff of log2 fold change ≥0.8, FDR-adjusted p < 0.01, in at least one growth condition, was used to select the significantly upregulated or downregulated genes in these variants.
References
- Amberd D.C., Burke D., Strathern J.N. Cold Spring Harbor Laboratory Press; Cold Spring Harbor, NY: 2005. Methods in Yeast Genetics: A Cold Spring Harbor Laboratory Course Manual. [Google Scholar]
- Balaji S., Babu M.M., Iyer L.M., Luscombe N.M., Aravind L. Comprehensive analysis of combinatorial regulation using the transcriptional regulatory network of yeast. J. Mol. Biol. 2006;360:213–227. doi: 10.1016/j.jmb.2006.04.029. [DOI] [PubMed] [Google Scholar]
- Benson G. Tandem repeats finder: a program to analyze DNA sequences. Nucleic Acids Res. 1999;27:573–580. doi: 10.1093/nar/27.2.573. [DOI] [PMC free article] [PubMed] [Google Scholar]
- Brown C.A., Murray A.W., Verstrepen K.J. Rapid expansion and functional divergence of subtelomeric gene families in yeasts. Curr. Biol. 2010;20:895–903. doi: 10.1016/j.cub.2010.04.027. [DOI] [PMC free article] [PubMed] [Google Scholar]
- Brückner S., Mösch H.U. Choosing the right lifestyle: adhesion and development in Saccharomyces cerevisiae. FEMS Microbiol. Rev. 2012;36:25–58. doi: 10.1111/j.1574-6976.2011.00275.x. [DOI] [PubMed] [Google Scholar]
- Caron N.S., Desmond C.R., Xia J., Truant R. Polyglutamine domain flexibility mediates the proximity between flanking sequences in huntingtin. Proc. Natl. Acad. Sci. USA. 2013;110:14610–14615. doi: 10.1073/pnas.1301342110. [DOI] [PMC free article] [PubMed] [Google Scholar]
- Chen K., Wilson M.A., Hirsch C., Watson A., Liang S., Lu Y., Li W., Dent S.Y. Stabilization of the promoter nucleosomes in nucleosome-free regions by the yeast Cyc8-Tup1 corepressor. Genome Res. 2013;23:312–322. doi: 10.1101/gr.141952.112. [DOI] [PMC free article] [PubMed] [Google Scholar]
- Choi J.K., Kim Y.J. Epigenetic regulation and the variability of gene expression. Nat. Genet. 2008;40:141–147. doi: 10.1038/ng.2007.58. [DOI] [PubMed] [Google Scholar]
- Douglas P.M., Dillin A. Protein homeostasis and aging in neurodegeneration. J. Cell Biol. 2010;190:719–729. doi: 10.1083/jcb.201005144. [DOI] [PMC free article] [PubMed] [Google Scholar]
- Duitama J., Zablotskaya A., Gemayel R., Jansen A., Belet S., Vermeesch J.R., Verstrepen K.J., Froyen G. Large-scale analysis of tandem repeat variability in the human genome. Nucleic Acids Res. 2014;42:5728–5741. doi: 10.1093/nar/gku212. [DOI] [PMC free article] [PubMed] [Google Scholar]
- Faux N.G., Bottomley S.P., Lesk A.M., Irving J.A., Morrison J.R., de la Banda M.G., Whisstock J.C. Functional insights from the distribution and role of homopeptide repeat-containing proteins. Genome Res. 2005;15:537–551. doi: 10.1101/gr.3096505. [DOI] [PMC free article] [PubMed] [Google Scholar]
- Fiumara F., Fioriti L., Kandel E.R., Hendrickson W.A. Essential role of coiled coils for aggregation and activity of Q/N-rich prions and PolyQ proteins. Cell. 2010;143:1121–1135. doi: 10.1016/j.cell.2010.11.042. [DOI] [PMC free article] [PubMed] [Google Scholar]
- Fondon J.W., 3rd, Garner H.R. Molecular origins of rapid and continuous morphological evolution. Proc. Natl. Acad. Sci. USA. 2004;101:18058–18063. doi: 10.1073/pnas.0408118101. [DOI] [PMC free article] [PubMed] [Google Scholar]
- Friedman M.J., Shah A.G., Fang Z.H., Ward E.G., Warren S.T., Li S., Li X.J. Polyglutamine domain modulates the TBP-TFIIB interaction: implications for its normal function and neurodegeneration. Nat. Neurosci. 2007;10:1519–1528. doi: 10.1038/nn2011. [DOI] [PubMed] [Google Scholar]
- Gatchel J.R., Zoghbi H.Y. Diseases of unstable repeat expansion: mechanisms and common principles. Nat. Rev. Genet. 2005;6:743–755. doi: 10.1038/nrg1691. [DOI] [PubMed] [Google Scholar]
- Gemayel R., Vinces M.D., Legendre M., Verstrepen K.J. Variable tandem repeats accelerate evolution of coding and regulatory sequences. Annu. Rev. Genet. 2010;44:445–477. doi: 10.1146/annurev-genet-072610-155046. [DOI] [PubMed] [Google Scholar]
- Girstmair H., Saffert P., Rode S., Czech A., Holland G., Bannert N., Ignatova Z. Depletion of cognate charged transfer RNA causes translational frameshifting within the expanded CAG stretch in huntingtin. Cell Rep. 2013;3:148–159. doi: 10.1016/j.celrep.2012.12.019. [DOI] [PubMed] [Google Scholar]
- Hanlon S.E., Rizzo J.M., Tatomer D.C., Lieb J.D., Buck M.J. The stress response factors Yap6, Cin5, Phd1, and Skn7 direct targeting of the conserved co-repressor Tup1-Ssn6 in S. cerevisiae. PLoS ONE. 2011;6:e19060. doi: 10.1371/journal.pone.0019060. [DOI] [PMC free article] [PubMed] [Google Scholar]
- Jarosz D.F., Taipale M., Lindquist S. Protein homeostasis and the phenotypic manifestation of genetic diversity: principles and mechanisms. Annu. Rev. Genet. 2010;44:189–216. doi: 10.1146/annurev.genet.40.110405.090412. [DOI] [PubMed] [Google Scholar]
- King D.G., Soller M., Kashi Y. Evolutionary tuning knobs. Endeavour. 1997;21:36–40. [Google Scholar]
- Krobitsch S., Lindquist S. Aggregation of huntingtin in yeast varies with the length of the polyglutamine expansion and the expression of chaperone proteins. Proc. Natl. Acad. Sci. USA. 2000;97:1589–1594. doi: 10.1073/pnas.97.4.1589. [DOI] [PMC free article] [PubMed] [Google Scholar]
- Lam Y.C., Bowman A.B., Jafar-Nejad P., Lim J., Richman R., Fryer J.D., Hyun E.D., Duvick L.A., Orr H.T., Botas J., Zoghbi H.Y. ATAXIN-1 interacts with the repressor Capicua in its native complex to cause SCA1 neuropathology. Cell. 2006;127:1335–1347. doi: 10.1016/j.cell.2006.11.038. [DOI] [PubMed] [Google Scholar]
- Landry C.R., Lemos B., Rifkin S.A., Dickinson W.J., Hartl D.L. Genetic properties influencing the evolvability of gene expression. Science. 2007;317:118–121. doi: 10.1126/science.1140247. [DOI] [PubMed] [Google Scholar]
- Legendre M., Pochet N., Pak T., Verstrepen K.J. Sequence-based estimation of minisatellite and microsatellite repeat variability. Genome Res. 2007;17:1787–1796. doi: 10.1101/gr.6554007. [DOI] [PMC free article] [PubMed] [Google Scholar]
- Li Y.C., Korol A.B., Fahima T., Beiles A., Nevo E. Microsatellites: genomic distribution, putative functions and mutational mechanisms: a review. Mol. Ecol. 2002;11:2453–2465. doi: 10.1046/j.1365-294x.2002.01643.x. [DOI] [PubMed] [Google Scholar]
- Liti G., Carter D.M., Moses A.M., Warringer J., Parts L., James S.A., Davey R.P., Roberts I.N., Burt A., Koufopanou V. Population genomics of domestic and wild yeasts. Nature. 2009;458:337–341. doi: 10.1038/nature07743. [DOI] [PMC free article] [PubMed] [Google Scholar]
- Lynch M., Sung W., Morris K., Coffey N., Landry C.R., Dopman E.B., Dickinson W.J., Okamoto K., Kulkarni S., Hartl D.L., Thomas W.K. A genome-wide view of the spectrum of spontaneous mutations in yeast. Proc. Natl. Acad. Sci. USA. 2008;105:9272–9277. doi: 10.1073/pnas.0803466105. [DOI] [PMC free article] [PubMed] [Google Scholar]
- Newman J.R., Ghaemmaghami S., Ihmels J., Breslow D.K., Noble M., DeRisi J.L., Weissman J.S. Single-cell proteomic analysis of S. cerevisiae reveals the architecture of biological noise. Nature. 2006;441:840–846. doi: 10.1038/nature04785. [DOI] [PubMed] [Google Scholar]
- Orr H.T., Zoghbi H.Y. Trinucleotide repeat disorders. Annu. Rev. Neurosci. 2007;30:575–621. doi: 10.1146/annurev.neuro.29.051605.113042. [DOI] [PubMed] [Google Scholar]
- Papamichos-Chronakis M., Petrakis T., Ktistaki E., Topalidou I., Tzamarias D. Cti6, a PHD domain protein, bridges the Cyc8-Tup1 corepressor and the SAGA coactivator to overcome repression at GAL1. Mol. Cell. 2002;9:1297–1305. doi: 10.1016/s1097-2765(02)00545-2. [DOI] [PubMed] [Google Scholar]
- Park S.H., Kukushkin Y., Gupta R., Chen T., Konagai A., Hipp M.S., Hayer-Hartl M., Hartl F.U. PolyQ proteins interfere with nuclear degradation of cytosolic proteins by sequestering the Sis1p chaperone. Cell. 2013;154:134–145. doi: 10.1016/j.cell.2013.06.003. [DOI] [PubMed] [Google Scholar]
- Patel B.K., Gavin-Smyth J., Liebman S.W. The yeast global transcriptional co-repressor protein Cyc8 can propagate as a prion. Nat. Cell Biol. 2009;11:344–349. doi: 10.1038/ncb1843. [DOI] [PMC free article] [PubMed] [Google Scholar]
- Pearson C.E. Repeat associated non-ATG translation initiation: one DNA, two transcripts, seven reading frames, potentially nine toxic entities! PLoS Genet. 2011;7:e1002018. doi: 10.1371/journal.pgen.1002018. [DOI] [PMC free article] [PubMed] [Google Scholar]
- Raser J.M., O’Shea E.K. Control of stochasticity in eukaryotic gene expression. Science. 2004;304:1811–1814. doi: 10.1126/science.1098641. [DOI] [PMC free article] [PubMed] [Google Scholar]
- Reynolds T.B., Fink G.R. Bakers’ yeast, a model for fungal biofilm formation. Science. 2001;291:878–881. doi: 10.1126/science.291.5505.878. [DOI] [PubMed] [Google Scholar]
- Sawyer L.A., Hennessy J.M., Peixoto A.A., Rosato E., Parkinson H., Costa R., Kyriacou C.P. Natural variation in a Drosophila clock gene and temperature compensation. Science. 1997;278:2117–2120. doi: 10.1126/science.278.5346.2117. [DOI] [PubMed] [Google Scholar]
- Schaefer M.H., Wanker E.E., Andrade-Navarro M.A. Evolution and function of CAG/polyglutamine repeats in protein-protein interaction networks. Nucleic Acids Res. 2012;40:4273–4287. doi: 10.1093/nar/gks011. [DOI] [PMC free article] [PubMed] [Google Scholar]
- Schaffar G., Breuer P., Boteva R., Behrends C., Tzvetkov N., Strippel N., Sakahira H., Siegers K., Hayer-Hartl M., Hartl F.U. Cellular toxicity of polyglutamine expansion proteins: mechanism of transcription factor deactivation. Mol. Cell. 2004;15:95–105. doi: 10.1016/j.molcel.2004.06.029. [DOI] [PubMed] [Google Scholar]
- Schaper E., Gascuel O., Anisimova M. Deep conservation of human protein tandem repeats within the eukaryotes. Mol. Biol. Evol. 2014;31:1132–1148. doi: 10.1093/molbev/msu062. [DOI] [PMC free article] [PubMed] [Google Scholar]
- Smith R.L., Johnson A.D. Turning genes off by Ssn6-Tup1: a conserved system of transcriptional repression in eukaryotes. Trends Biochem. Sci. 2000;25:325–330. doi: 10.1016/s0968-0004(00)01592-9. [DOI] [PubMed] [Google Scholar]
- Tachibana C., Yoo J.Y., Tagne J.B., Kacherovsky N., Lee T.I., Young E.T. Combined global localization analysis and transcriptome data identify genes that are directly coregulated by Adr1 and Cat8. Mol. Cell. Biol. 2005;25:2138–2146. doi: 10.1128/MCB.25.6.2138-2146.2005. [DOI] [PMC free article] [PubMed] [Google Scholar]
- Tirosh I., Barkai N. Two strategies for gene regulation by promoter nucleosomes. Genome Res. 2008;18:1084–1091. doi: 10.1101/gr.076059.108. [DOI] [PMC free article] [PubMed] [Google Scholar]
- Tirosh I., Weinberger A., Carmi M., Barkai N. A genetic signature of interspecies variations in gene expression. Nat. Genet. 2006;38:830–834. doi: 10.1038/ng1819. [DOI] [PubMed] [Google Scholar]
- Tsvetkov A.S., Arrasate M., Barmada S., Ando D.M., Sharma P., Shaby B.A., Finkbeiner S. Proteostasis of polyglutamine varies among neurons and predicts neurodegeneration. Nat. Chem. Biol. 2013;9:586–592. doi: 10.1038/nchembio.1308. [DOI] [PMC free article] [PubMed] [Google Scholar]
- Tzamarias D., Struhl K. Functional dissection of the yeast Cyc8-Tup1 transcriptional co-repressor complex. Nature. 1994;369:758–761. doi: 10.1038/369758a0. [DOI] [PubMed] [Google Scholar]
- Undurraga S.F., Press M.O., Legendre M., Bujdoso N., Bale J., Wang H., Davis S.J., Verstrepen K.J., Queitsch C. Background-dependent effects of polyglutamine variation in the Arabidopsis thaliana gene ELF3. Proc. Natl. Acad. Sci. USA. 2012;109:19363–19367. doi: 10.1073/pnas.1211021109. [DOI] [PMC free article] [PubMed] [Google Scholar]
- Venters B.J., Wachi S., Mavrich T.N., Andersen B.E., Jena P., Sinnamon A.J., Jain P., Rolleri N.S., Jiang C., Hemeryck-Walsh C., Pugh B.F. A comprehensive genomic binding map of gene and chromatin regulatory proteins in Saccharomyces. Mol. Cell. 2011;41:480–492. doi: 10.1016/j.molcel.2011.01.015. [DOI] [PMC free article] [PubMed] [Google Scholar]
- Verghese J., Abrams J., Wang Y., Morano K.A. Biology of the heat shock response and protein chaperones: budding yeast (Saccharomyces cerevisiae) as a model system. Microbiol. Mol. Biol. Rev. 2012;76:115–158. doi: 10.1128/MMBR.05018-11. [DOI] [PMC free article] [PubMed] [Google Scholar]
- Verstrepen K.J., Klis F.M. Flocculation, adhesion and biofilm formation in yeasts. Mol. Microbiol. 2006;60:5–15. doi: 10.1111/j.1365-2958.2006.05072.x. [DOI] [PubMed] [Google Scholar]
- Voordeckers K., Brown C.A., Vanneste K., van der Zande E., Voet A., Maere S., Verstrepen K.J. Reconstruction of ancestral metabolic enzymes reveals molecular mechanisms underlying evolutionary innovation through gene duplication. PLoS Biol. 2012;10:e1001446. doi: 10.1371/journal.pbio.1001446. [DOI] [PMC free article] [PubMed] [Google Scholar]
- Voordeckers K., De Maeyer D., van der Zande E., Vinces M.D., Meert W., Cloots L., Ryan O., Marchal K., Verstrepen K.J. Identification of a complex genetic network underlying Saccharomyces cerevisiae colony morphology. Mol. Microbiol. 2012;86:225–239. doi: 10.1111/j.1365-2958.2012.08192.x. [DOI] [PMC free article] [PubMed] [Google Scholar]
- Wong K.H., Struhl K. The Cyc8-Tup1 complex inhibits transcription primarily by masking the activation domain of the recruiting protein. Genes Dev. 2011;25:2525–2539. doi: 10.1101/gad.179275.111. [DOI] [PMC free article] [PubMed] [Google Scholar]
- Young E.T., Sloan J.S., Van Riper K. Trinucleotide repeats are clustered in regulatory genes in Saccharomyces cerevisiae. Genetics. 2000;154:1053–1068. doi: 10.1093/genetics/154.3.1053. [DOI] [PMC free article] [PubMed] [Google Scholar]
Associated Data
This section collects any data citations, data availability statements, or supplementary materials included in this article.
Supplementary Materials
TRs of nine or more units were first extracted from the genomes of S. cerevisiae, D. melanogaster, D. rario, M. musculus, and H. sapiens. From this list, we subsequently extracted Q-rich repeats, defined as repeats with at least 85% of glutamines in the translated sequence. Systematic gene names are given.
Genes containing Q-rich repeats are enriched for particular biological functions (column B) when compared with all repeat-containing genes in various eukaryotic genomes. The statistical significance value (adjusted p value) for each enriched category is given in column C.
These data are represented as log2 fold change in expression relative to the expression in the WT strain (TR2-63). A cutoff of log2 fold change ≥0.8, FDR-adjusted p < 0.01, in at least one growth condition, was used to select the significantly upregulated or downregulated genes in these variants.