

Abstract
Data mining was performed on 28,330 unique peptide tandem mass spectra for which sequences were assigned with high confidence. By dividing the spectra into different sets based on structural features and charge states of the corresponding peptides, chemical interactions involved in promoting specific cleavage patterns in gas-phase peptides were characterized. Pair-wise fragmentation maps describing cleavages at all Xxx-Zzz residue combinations for b and y ions reveal that the difference in basicity between Arg and Lys results in different dissociation patterns for singly-charged Arg- and Lys- ending tryptic peptides. While one dominant protonation form (proton localized) exists for Arg-ending peptides, a heterogeneous population of different protonated forms or more facile interconversion of protonated forms (proton partially-mobile) exists for Lys-ending peptides. Cleavage C-terminal to acidic residues dominates spectra from peptides that have a localized proton(s) and cleavage N-terminal to Pro dominates those that have a mobile or partially mobile proton(s). When Pro is absent from peptides that have a mobile or partially mobile proton, cleavage at each peptide bond becomes much more prominent. Whether the above patterns can be found in b ions and/or y ions depends on the location of the proton holder(s). Enhanced cleavages C-terminal to branched aliphatic residues (Ile, Val, Leu) are observed in both b and y ions from peptides that have a mobile proton, as well as in y ions from peptides that have a partially mobile proton; enhanced cleavages N-terminal to these residues are observed in b ions from peptides that have a partially-mobile proton. Statistical tools have been designed to visualize the fragmentation maps and measure the similarity between them. The pairwise cleavage patterns observed expand our knowledge of peptide gas-phase fragmentation behaviors and should be useful in algorithm development that employs improved models to predict fragment ion intensities.
Keywords: Statistical Analysis, Peptide, CID, MS/MS, Fragmentation Mechanism, Fragmentation Map, Dissociation Pattern, Fragmentation Pattern, Pair-wise Cleavage, Xxx-Zzz, Residue Combination, Selective Cleavage, Proline, Aspartic Acid, Glutamic Acid, Xxx-Pro, Asp-Xxx, Charge State Dependence, Residue Dependence, Data Mining, Protein Identification, Charge Remote, Charge Directed, Fisher Information, the FI threshold, Wilcoxon rank sum test, Mann-Whitney test
Introduction
Low energy collision-induced dissociation (CID) in mass spectrometry has been used extensively in peptide sequencing for protein identification and analysis of protein modifications.1, 2 Computer algorithms are employed to automate the spectral analysis and assign peptide sequences to the fragmentation spectra.2–4 Numerous peptide fragmentation spectra are obtained everyday, but only a low percentage (e.g., 10% – 35%) of them are successfully identified by readily available algorithms.5–8 One explanation for the high failure rate of current algorithms is the very simple fragmentation model on which they are based, which assumes that cleavage will occur mainly, if not exclusively, at the amide bonds between consecutive amino acid residues to produce ions of identical abundance (or intensity), regardless of the identity or the chemical property of the residues.4, 9 Although intensity patterns of the fragment ions from the same peptide under the same experimental settings are highly reproducible, current readily available algorithms only use the mass-to-charge (m/z) information from a tandem mass (MS/MS) spectrum, and ignore the other information available—the relative intensity information. While this approach is sufficient to identify many peptides, many others yield fragmentation patterns that significantly deviate from this model.8 A more detailed and chemically meaningful fragmentation model should improve algorithm performance and might include using different models for different candidate sequences. In addition, the gas-phase unimolecular dissociation of protonated peptides is of fundamental interest because knowledge of the chemistry increases our understanding of molecular structure and intramolecular proton transfer dynamics in the absence of solvent.
Previous studies have shown that peptide dissociation behavior in MS/MS spectra is a complex function of many factors including the residue content, charge state and sequence of the peptide. Traditional studies using only a few model peptides10–13 often yield complicated results and the data are insufficient to elucidate all possible mechanisms. The alternative approach, using data-mining methods to analyze a large set of MS/MS spectra,6, 7, 14–17 requires a large set of high quality spectra whose sequences are assigned unambiguously. Assembling the required high-quality dataset is a major bottleneck. Several earlier attempts used either a high cut-off score in available algorithms7, 14, 15, 18 or manual validation combined with a cut-off score5, 16 to filter the spectra in the databases. Varying numbers of spectra from ~500 to ~5,000 were used6, 7, 14–16, 19 and these studies often focus on a single charge state (most often doubly-charged). More recently, researchers generated validated datasets20 by combining the analyses of two types of mass spectrometers together: The same peptides were analyzed by FT-ICR and ion trap spectrometers under the same chromatographic conditions. The accurate mass measurements of the precursor ions were obtained from the FT-ICR, while the fragmentation information in the MS/MS spectra from the same peptides were recorded by the ion-trap. When the top hit of the sequences assigned by SEQUEST (minimum XCorr score 1.5) from the MS/MS spectrum correlated (within 1ppm) with the accurate mass measurement under the same (±5%) retention time, a spectrum was denoted to have a sequence assigned with very high confidence.
The data generated from such an approach should have few incorrectly assigned spectra, because it takes advantage, at a given retention time, of two different mass spectrometry techniques and records different information from the same peptide, with both measurements contributing to the confidence of the sequence assignment. Although a commercial database searching algorithm was still relied upon in generating peptide sequence assignments, this approach eliminates the requirement of high cut-off scores that results in tremendous loss of information. It also eliminates human errors which are fairly common in manual validation.21
In this study, we use peptide spectra collected from such an approach to catalogue fragmentation behavior of peptides that have different structural motifs. Unlike previous studies that focused only on peptides that were doubly-charged, mainly because spectra from doubly-charged peptides are the most abundant species that can pass through the filters, this study shows pair-wise cleavage statistics among peptides with different structural motifs under different charge states. Special attention has been given to the sorting and filtering of the peptides, which allows factors contributing to the fragmentation process to be studied alone or in combination. Statistical tools are developed to visualize and validate the patterns observed in the pair-wise fragmentation maps, revealing a detailed description of the fragmentation behavior of different peptides. The fragmentation statistics from this study may prove useful for improving the fragmentation model in sequencing algorithms, which could have an immediate impact on practical proteomics studies. At the same time, the correlation of fragmentation statistics with peptide structural features can help us understand chemical interactions or residue combinations involved in promoting specific cleavage pathways, guide the design of specific chemical mechanism studies using model systems, and thus have a longer term impact by increasing our fundamental knowledge of gas-phase unimolecular dissociation.
Experimental Section
Spectra collecting and filtering
The experiments to acquire the spectra were described in previous publications.17, 20 Peptide MS/MS spectra from the proteome of two organisms Shewanella oneidensis and Deinococcus radiodurans were collected using ion-trap instruments. The SEQUEST algorithm4 was used to assign peptide sequences to these spectra. Using the same chromatographic conditions, accurate masses of the precursor ions detected at the same retention time (± by FT-ICR were used to confirm the assigned sequences. 1,137 composite spectra (spectra that show more than one peptide might have been selected for fragmentation simultaneously) were identified and purged from the Deinococcus dataset. 1974 spectra (730 from Shewanella and 1244 from Deinococcus) were also purged if their sequences contain 15N isotope or the mass difference is more than 3 Da between the theoretical mass of the singly-charged precursor ion (MH+) and the recorded MH+ (provided regardless of the actual charge state, in the first line of the *.dta file from the LCQ). After all the filtering steps, 28,330 spectra of unique sequence and charge state (16,008 from Shewanella and 12,322 from Deinococcus) were used for the analyses in this paper. (A copy of this dataset may be requested via email vwysocki@email.arizona.edu.)
Computing the fragmentation statistics
Computer programs written in PERL (version 5.6.3, http://www.perl.com) and MatLab (6.0, release 12, student version, http://www.mathworks.com), as well as in SQL under Microsoft SQL-Server 2000 (http://www.microsoft.com/sql) were used to extract fragmentation statistics. The 28,330 spectra were sorted by the charge states and the number of missed cleavages. Multiple analyses from two categories were then performed. Different sets of spectra and different schemes for peak intensity normalization were used in each category.
In the first category of analyses, summarized in Table 3, the frequencies and intensities of different ion types from peptides of different charge states and basic residue content are characterized and compared. One m/z entry in the *.dta file was considered one peak in the spectrum. Because the mono-isotopic peak of the peptide was selected to obtain the MS/MS spectra, isotopic fragment peaks were not commonly observed in our data. Ion types investigated here include all ion types that may be observed in low energy CID spectra. These include: y, y-H2O, y-NH3, b, b−H2O, b-NH3, b+H2O, a, a-H2O, a-NH3, internal, internal-H2O, internal-NH3, internal-CO, M-H2O, M-NH3, and immonium ions. When the charge state of the precursor ion is greater than 1, both singly- and doubly-charged fragment ions were considered. Two additional ion types, x and c ions, which are not considered to exist typically in low energy CID spectra, were used as the control to determine the probability of random matching and the noise level. All ions from the above ion types were identified from each spectrum according to the assigned sequence using a mass window of ±0.5 around the theoretical m/z. Then they were normalized to the total ion abundance in the spectrum. (Due to the low mass cut-off problem intrinsic to ion trap instruments, as well as the instrument detection limit at 2000 m/z, the ions whose theoretical m/z fall into the above mass cut-off ranges were excluded from our analyses.) This normalization scheme allows direct comparisons of the abundances from different ion types, and enables other fragmentation statistics be computed, e.g., the percentage of total identifiable ion abundance. With each spectrum, the normalized ion intensities from the same ion type are summed together as the sum of normalized intensities for that ion type in that spectrum. The frequency is calculated as the number of spectra that contain a non-zero sum of normalized intensities for that specific ion type divided by the number of total spectra in that dataset. For example, if half the spectra of a set contain at least one b+, the frequency for b+ would be 0.5. A median value is then calculated from those spectra showing a non-zero sum of normalized intensities for that ion type.
Table 3.
Summary of the 9 different spectral sets for which fragmentation maps are analyzed in this paper
| Roman Numeral | Charge State | # of P | Basic Residue Content | Structural Motif Representation | # of Spectra | Most Abundant Cleavages |
|---|---|---|---|---|---|---|
| I | 1 H+ | ≥1 | 1 R, 0 K, 0 H | […P…H̶…R]+ | 674 | D-X, E-X in y |
| II | 1 H+ | ≥1 | 0 R, 1 K, 0 H | […P…H̶…K]+ | 1,216 | D-X, X-P in y |
| III | 2 H+ | ≥1 | 1 R, 0 K, 0 H | […P…H̶…R]2+ | 2,182 | X-P in y |
| IV | 2 H+ | ≥1 | 0 R, 1 K, 0 H | […P…H̶…K]2+ | 1,834 | X-P in y |
| V | 2 H+ | ≥1 | 2 R, 0 K, 0 H | […R…P…H̶…D/E…R]2+ | 201 | D-X, E-X in b & y |
| VI | 2 H+ | ≥1 | 0 R, 2 K, 0 H | […K…P…H̶…D/E…K]2+ | 230 | X-P in y |
| VII | 1 H+ | 0 | 0 R, 1 K, 0 H | […P̶…H̶…K]+ | 1,978 | D-X, E-X in y |
| VIII | 2 H+ | 0 | 1 R or 1 K, 0 H | […P̶…H̶…R/K]2+ | 2755 | I-X, V-X, L-X in y |
| IX | 2 H+ | varies | 1 R or 1 K, varies H | [……R/K]2+ | 10,638 | X-P in y |
In the second category of analyses, which make up the majority of the results discussed, the analyses focus on ion types that are most prominent in low energy CID spectra and useful in sequencing—cleavage of amide bonds with the retention of charge on either the N-terminal fragment (b ion) or the C-terminal fragment (y ion). A different normalization scheme was used: singly-charged b ions (b+) and y ions (y+) were normalized to the most abundant peak among all b+ and y+. This normalization separates the intensities of b+ and y+ from distortions caused by other fragmentation pathways, e.g., neutral loss or internal fragmentation, as well as eliminating the undesirable disruption from spectra with different signal-to-noise ratios. This normalization also allows direct comparison between b+ and y+ relative abundance, and quantitative comparison of the lability of a certain amide bond to the rest. The normalized abundances of b+ and y+ were cataloged by the pair of the AA residues at the cleavage site as the relative abundances for such a pair-wise cleavage. From each spectral set, two fragmentation maps showing the median relative abundances of bond cleavages at each residue combination, one for each ion type (b+ and y+), were then obtained.
Visualization of the fragmentation maps
Computer programs written in C++ were used to generate the fragmentation maps. A color gradient scheme (shown on the right side of each fragmentation map below) is used to represent the wide variance in cleavage likelihood among all residue combinations, with the darker color corresponding to the more abundant cleavages. (Although the color gradient has been chosen to accommodate black and white printing, the authors recommend viewing these maps in color to avoid missing information.) Pair-wise fragmentation maps are obtained for b+ and y+ from different sets of spectra. The color of each circle or ellipse in these maps shows the median of a certain Xxx-Zzz cleavage. Single letter codes of AA residues listed in the leftmost column correspond to the N-terminal residue (Xxx) in an Xxx-Zzz pair, while those listed along the topmost row correspond to the C-terminal residue (Zzz) in an Xxx-Zzz pair. Cysteine (Cys or C) and tryptophan (Trp or W) are the two residues that have the lowest occurrences among all residues because Cys residues were not reduced and alkylated, while Trp residues are prone to oxidation. Therefore, the statistics for these two residues are often missing in the fragmentation maps. The horizontal dimension of each ellipse is proportional to the count (number of the particular Xxx-Zzz residue combination in that dataset) so the visualization impact of a lower-count AA pair is reduced. The minimum count and the count at 90% quantile are illustrated under the color bar.
The FI threshold
A statistical threshold called the Fisher Information (FI) threshold is employed to determine whether the cleavage abundance information for a particular residue combination should be shown when the count of such a residue combination is less than 10. FI describes the amount of information about an unobserved parameter that the observed data carry.22 The FI threshold was designed to validate the distribution of the cleavage abundance when the occurance is low. Denote data X = (X1, · · ·,Xn) as the fragmentation intensities of a residue combination. FI is defined as
where n is the count and σ2 is the sample variance. A larger n and a smaller σ2 correspond to larger FI. We further denote X(i) = (X1, · · ·, Xi−1, Xi+1, · · ·, Xn) the leave-one-out data and FĨ (X) = max (FI(X(1)), · · ·, FI(X(n))) the Fisher information when the greatest outlying observation is treated as an outlier and detected. Therefore FĨ (X) ≫ FI(X) implies that the distribution has a significant outlier. Finally we include the residue combinations in the fragmentation map if they satisfy all of the following:
n≥3.
When 3≤n≤9, FI(X) is larger than or equal to 500.
When 6≤n≤9 and FI(X)<500, FĨ (X) >1000.
Note that rule (3) is introduced as a conservative procedure to recover distributions that should have large Fisher information but were deteriorated by an extreme outlier.
Statistical comparison (similarity test) of two fragmentation maps
After the pair-wise fragmentation maps are generated for different spectral sets, statistical comparisons are performed between them to validate the observed patterns using computer programs written in C++. In order to compare the overall difference between two maps, each corresponding cleavage site needs to be compared first. Denote Xijk, 1≤k≤nij, the normalized intensities at cleavage site i followed by j in map α and denote Yijk, 1≤k≤mij, the corresponding intensities in map β. Here nij and mij are the total cleavage occurrences at site i followed by j in map α and β respectively. The detection of differences at individual cleavage site i followed by j of two maps can be performed by the Wilcoxon (or Mann-Whitney) rank sum test23:
where R(Xijk) is the rank of Xijk among the combined set of {Xij1,…, Xijnij, Yij1,…, Yijmij}. The Wilcoxon test detects the difference of two distributions without distribution assumptions and it is known that under null hypothesis (no difference) the test statistic is approximately N(0,1) when nij≥10 and mij≥10. For each cleavage site with nij≥10 and mij≥10, a Z score is obtained. A larger absolute Z score represents a more significant difference and thus results in a smaller p-value. Cleavage sites with nij<10 or mij<10 are treated as information missing. Denote λ as the total number of cleavage sites satisfying nij≥10 and mij≥10. To account for the fact that λ independent hypothesis tests are simultaneously performed, a p-value rejection threshold of 0.001 instead of the usual 0.05 is used to avoid increased false positives.
After performing the above test for each corresponding cleavage site between two maps, to compare the overall differences of two maps, the following test statistic is considered:
where d is a tuning parameter and the hypothesis testing is more sensitive to differences of individual cleavage sites for larger d. In a normal situation, d = 2 is chosen and statistical theory has shown that in this case W follows a chi-squared distribution of degree of freedom λ under the null hypothesis. To demonstrate the magnitude of the differences between multiple fragmentation maps, the statistic V=W/λ is used to take into account different λ in each comparison, in which V is a measurement of the degree of difference between different fragmentation maps.
Results and Discussions
In the text below, the composition of the 28,330 spectra is briefly summarized and statistics are provided on the ion types that make up the spectra. The remainder of the text then focuses on a presentation and discussion of the chemically meaningful amide bond cleavage patterns for peptide with different structural motifs. When interpreting the data, we typically assume that the backbone amide bond cleavages that occur are charge-directed, i.e., that they occur via involvement of a proton with the exception of cleavage at Asp-Xxx.24 This assumption is most likely to break down for peptides in which the number of protons is less than or equal to the number of Arg.
Composition of the MS/MS database
Among the 28,330 spectra from peptides of unique sequences and charge states, the lengths of the peptides range from 5 to 55 AA residues, with the median and average both at 16 residues. A summary of the spectral database composition by the charge states, the terminating residue, and the number of missed cleavages is shown in Figure 1. Among the 28,330 spectra, 7,181 (25.3%) are from singly-charged (1+) peptides, with a median length of 11 residues; 17,660 (62.3%) are from doubly-charged (2+) peptides, with a median length of 16 residues; 3,489 (12.3%) are from triply-charged (3+) peptides, with a median length of 26 residues. Separating the spectra by the terminating residue of the peptides, 12583 (44.4%) are from peptides that end in Arg and 14253 (50.3%) are from peptides that end in Lys. There is no significant difference in peptide length between the Arg- and the Lys-ending peptides.
Figure 1.

Composition of the 28,330 peptide MS/MS spectral database
Ion Statistics
In order to analyze the spectral content of the 28,330 peptide MS/MS spectra and to glean chemical information from the analyses, it is first desirable to characterize the spectra in terms of the number and types of product ions typically produced in the ion trap. Five sets of spectra from tryptic peptides with zero missed cleavages and peptides without basic residues are characterized (Table 1). (Only 2 spectra exist for Triply-protonated peptides without basic residues, therefore that dataset is not included.) Two sets of analyses were performed on these 5 datasets. The first set of analyses focus on the impact of internal series ions on peak assignment (See Table 1). The second set of analyses compare the frequencies and intensities of different non-internal ions (See Table 2). Conclusions drawn from these analyses are summarized briefly as follows: (More detailed discussions are provided in the Supporting Information.)
Table 1.
Characterizing spectral sets of different charge states and basic residue content (See text for details.)
| 3+ tryptic | 2+ tryptic | 1+ tryptic | 2+ no RKH | 1+ no RKH | ||
|---|---|---|---|---|---|---|
| Avg. Length and Stdev. | 25.7 ± 7.8 | 16.4 ± 5.8 | 11.5 ± 3.6 | 20.2 ± 6.4 | 11.8 ± 4.8 | |
| Median Length | 25 | 17 | 16 | 19 | 17 | |
| % peptide mass > 2000 | 82.9% | 32.4% | 0 | 48.9% | 0 | |
| Average # of Peaks per AA | 12.0 | 17.3 | 23.2 | 14.6 | 19.1 | |
| # of Spectra | 1180 | 10638 | 5857 | 131 | 103 | |
| % Intensity Identified | w/o Internals | 48.0 | 48.2 | 38.0 | 36.9 | 44.3 |
| with Internals | 80.4 | 65.1 | 48.1 | 60.0 | 54.6 | |
| % Peaks Identified | w/o Internals | 32.2 | 29.0 | 19.6 | 26.9 | 20.9 |
| with Internals | 74.7 | 52.3 | 31.1 | 52.1 | 34.3 | |
| % Multiple Assignments | w/o Internals | 22.2 | 16.1 | 3.8 | 17.5 | 3.6 |
| with Internals | 63.5 | 42.5 | 19.2 | 47.5 | 21.3 | |
Note: “3+”, “2+”, and “1+” refer to the charge states. “Tryptic” means Arg or Lys only occurs at the C-terminus of the peptide. “No RKH” stands for peptides without Arg, Lys or His. Median values are shown unless specified otherwise. “w/o Internals” uses y, y-H2O, y-NH3, b, b−H2O, b-NH3, b+H2O, a, a-H2O, a-NH3, M-H2O, M-NH3, and immonium ions to label the spectra, while “with Internals” uses the same ion types plus the internal series (including internal, internal-H2O, internal-NH3, internal-CO). “% peptide mass >2000” is the percentage of spectra with a corresponding peptide MW greater than 2000.
Table 2.
The frequencies (Freq.) and the sum of normalized intensities (Int.) of different ion types among different spectral sets. The intensities of those ions that are significant are highlighted in bold. (See text and supplementary information for details.)
| Ion Type | 3+ tryptic | 2+ tryptic | 1+ tryptic | 2+ no RKH | 1+ no RKH | |||||
|---|---|---|---|---|---|---|---|---|---|---|
| Freq. | % Int. | Freq. | % Int. | Freq. | % Int. | Freq. | % Int. | Freq. | % Int. | |
| y+ | 1.000 | 7.2 | 1.000 | 19.2 | 1.000 | 9.5 | 1.000 | 7.5 | 1.000 | 7.9 |
| y2+ | 0.997 | 10.0 | 0.973 | 2.1 | n. a. | n. a. | 0.924 | 0.8 | n. a. | n. a. |
| [y-H2O]+ | 0.945 | 1.0 | 0.976 | 1.4 | 0.983 | 1.6 | 0.977 | 1.7 | 0.971 | 1.7 |
| [y-H2O]2+ | 0.985 | 2.2 | 0.955 | 1.1 | n. a. | n. a. | 0.954 | 0.9 | n. a. | n. a. |
| [y-NH3]+ | 0.956 | 1.0 | 0.972 | 1.3 | 0.980 | 1.8 | 0.962 | 1.4 | 0.903 | 1.4 |
| [y-NH3]2+ | 0.986 | 2.7 | 0.956 | 1.2 | n. a. | n. a. | 0.969 | 0.9 | n. a. | n. a. |
| total int. of y series | n. a. | 24.1 | n. a. | 26.3 | n. a. | 12.8 | n. a. | 13.2 | n. a. | 11.0 |
| b+ | 0.997 | 3.8 | 1.000 | 6.5 | 1.000 | 5.3 | 1.000 | 6.9 | 1.000 | 11.4 |
| b2+ | 0.997 | 4.6 | 0.921 | 0.8 | n. a. | n. a. | 0.969 | 1.3 | n. a. | n. a. |
| [b−H2O]+ | 0.967 | 1.6 | 0.988 | 2.6 | 0.995 | 3.0 | 0.992 | 1.8 | 0.971 | 4.7 |
| [b−H2O]2+ | 0.980 | 2.2 | 0.902 | 0.7 | n. a. | n. a. | 0.947 | 0.9 | n. a. | n. a. |
| [b-NH3]+ | 0.963 | 1.2 | 0.981 | 2.0 | 0.981 | 2.0 | 0.985 | 1.6 | 0.932 | 3.8 |
| [b-NH3]2+ | 0.981 | 2.4 | 0.902 | 0.7 | n. a. | n. a. | 0.947 | 1.0 | n. a. | n. a. |
| [b+H2O]+ | 0.891 | 0.7 | 0.868 | 0.5 | 0.911 | 0.7 | 0.855 | 0.5 | 0.796 | 0.5 |
| [b+H2O]2+ | 0.968 | 1.2 | 0.917 | 0.7 | n. a. | n. a. | 0.931 | 0.9 | n. a. | n. a. |
| a+ | 0.945 | 0.8 | 0.970 | 1.1 | 0.969 | 1.2 | 0.947 | 0.8 | 0.971 | 1.2 |
| a2+ | 0.969 | 1.5 | 0.901 | 0.7 | n. a. | n. a. | 0.939 | 0.8 | n. a. | n. a. |
| [a-H2O]+ | 0.922 | 0.7 | 0.922 | 0.7 | 0.924 | 0.7 | 0.924 | 0.6 | 0.893 | 0.7 |
| [a-H2O]2+ | 0.969 | 1.2 | 0.887 | 0.6 | n. a. | n. a. | 0.954 | 0.5 | n. a. | n. a. |
| [a-NH3]+ | 0.914 | 0.8 | 0.944 | 0.9 | 0.961 | 1.0 | 0.908 | 0.8 | 0.932 | 1.1 |
| [a-NH3]2+ | 0.969 | 1.5 | 0.901 | 0.7 | n. a. | n. a. | 0.939 | 0.8 | n. a. | n. a. |
| total int. of b series | n. a. | 24.1 | n. a. | 19.2 | n. a. | 13.9 | n. a. | 19.1 | n. a. | 23.5 |
| [M-H2O]+ | 0 | n. a. | 0.002 | 0.1 | 0.448 | 0.3 | 0 | n. a. | 0.398 | 0.3 |
| [M-H2O]2+ | 0.114 | 0.2 | 0.314 | 0.3 | n. a. | n. a. | 0.435 | 0.8 | n. a. | n. a. |
| [M-NH3]+ | 0 | n. a. | 0.002 | 0.1 | 0.953 | 2.5 | 0 | n. a. | 0.893 | 1.2 |
| [M-NH3]2+ | 0.120 | 0.1 | 0.507 | 0.5 | n. a. | n. a. | 0.595 | 0.8 | n. a. | n. a. |
| immonium | 0.028 | 0.3 | 0.057 | 0.3 | 0.004 | 0.2 | 0.008 | 6.0 | 0.029 | 0.1 |
| x | 0.891 | 0.6 | 0.865 | 0.5 | 0.841 | 0.5 | 0.908 | 0.6 | 0.786 | 0.5 |
| c | 0.904 | 0.6 | 0.865 | 0.5 | 0.845 | 0.5 | 0.931 | 0.8 | 0.816 | 0.5 |
The peptides are longer in higher charge state datasets.
A significant portion of the spectra from triply-charged tryptic peptides and doubly-charged peptides without basic residues, which are the longest, is cut off due to the experimental cut-off at m/z 2000.
There is a considerable fraction of the total peaks and total ion intensity in ion trap spectra that cannot be labeled. This fraction is most significant in singly-charged tryptic peptides.
For a given number of basic residues in a peptide, cleavages are less selective (or more uniform) in peptides of higher charge states.
Internal ions, formed by two cleavages of the peptide backbone, encompass a significant portion of the total ion intensity in ion trap spectra. Their abundances are higher in spectra with higher charge states.
The fact that a significant portion of the spectra from triply-charged tryptic peptides are cut-off and the presence of abundant internal ions in these spectra are the main reasons for the lower identification rate of triply charged tryptic peptides.
The low resolution of ion trap causes ambiguity in peak labeling, which leads to multiple assignments to the same peak. This can create problems for sequencing algorithms.
Longer peptides have a larger number of possible fragment ions. Therefore, spectra of higher charge states have higher probabilities of multiple assignments to a single peak. The possible internal series ions in particular, increase exponentially with the peptide length. Multiple assignments are most significant among triply-charged tryptic peptides and doubly-charged peptides with no basic residues when internals are included in the labeling scheme.
Different ion types have different frequencies and abundances among different datasets.
The probability of randomly-matching a peak is high in low energy CID spectra. This probability increases with the charge state of the precursor ion. However, the intensity from such random matching is low.
Singly-charged fragments are more abundant than doubly charged fragments when the precursor ions are doubly-charged. Doubly-charged fragments become more abundant than singly-charged fragments when the precursor ions are triply-charged.
b+ and y+ (or b2+ and y2+ in triply-charged peptides) are the most abundant fragment ion types when internal ions are not included (Figure 2). Tryptic peptides have a preference of forming y series ions over b series ions, while among peptides without basic residues, abundances of b series ions are comparable to, if not more intense than, y series ions. The largest preference for formation of y series over b series ions is found in doubly-charged tryptic peptides.
Figure 2.

Relative abundances of different ion types in different spectral sets. Ion intensities are normalized to the total ion abundances in the spectrum and then summed together according to the ion types. Ion types listed from the left to right for each dataset are: b+, y+, b2+, y2+. “3+ tryptic”, “2+ tryptic”, “1+ tryptic” stand for triply-charged, doubly-charged, and singly-charged Arg- or Lys- ending peptides with 0 missed cleavages, respectively. “2+ no RKH” and “1+ no RKH” stand for doubly-charged and singly-charged peptides that do not contain any basic residues, respectively.
Fragmentation Maps of Different Spectral Sets
a. Nine sets of peptides with specific structural features and charge states
The spectra were sorted based on the structural features and charge states of the corresponding peptides. To understand the roles of Lys and Arg protonation, peptides with internal His were not included in most spectral sets. Table 3 shows a summary of 9 different spectral sets for which fragmentation maps are analyzed in this paper. These are I. 674 spectra from singly-charged tryptic peptides that contain one or more Pro, no His (indicated by H̶), and C-terminal Arg ([…P…H̶…R]+); II. 1,216 spectra from singly-charged tryptic peptides that contain one or more Pro, no His, and C-terminal Lys ([…P…H̶…K]+); III. 2,182 spectra from doubly-charged tryptic peptides that contain one or more Pro, no His, and C-terminal Arg ([…P…H̶…R]2+); IV. 1,834 spectra from doubly-charged tryptic peptides that contain one or more Pro, no His, and C-terminal Lys ([…P…H̶…K]2+); V. 201 spectra from doubly-charged peptides that contain one or more Pro, one or more acidic residues (Asp or Glu), no His or Lys, C-terminal Arg, and only one internal Arg N-terminal to the acidic residue ([…R…P…H̶…D/E…R]2+); VI. 230 spectra from doubly-charged peptides with the same structural motif as in V but substitute Arg by Lys ([…K…P…H̶…D/E…K]2+); VII. 1,978 spectra from singly-charged tryptic peptides that contain no Pro or His, and C-terminal Lys ([…P̶…H̶…K]+); VIII. 2,755 spectra from doubly-charged tryptic peptides that contain no Pro or His ([…P̶…H̶…R/K]2+); IX. 10,638 spectra from doubly-charged tryptic peptides that contain any combination of residues ([……R/K]2+). In the subsequent text, these spectral sets will be referred to by the Roman numeral preceding them. Note that dataset IX corresponds directly to the dataset previously reported in a communication17 but includes almost twice as many spectra (10,638 vs. 5,654), and is presented in the new visualization scheme with the current statistical methods.
b. Frequency of selective cleavage in 1+ R- vs. K-ending peptides
Selective cleavage has been noted for years in the literature, especially in peptides where the number of protons is less than or equal to the number of Arg.10, 13, 24–30 In spectra that show selective cleavages, certain cleavage sites become the preferred pathways for dissociation, while cleavages at other sites are diminished. Figure 3 is an example of a spectrum showing selective cleavage at the Asp-Pro peptide bond from a doubly-charged peptide LITSHLVDTDPEVDSIIKDEIER. Product ions b10 and y13 from such a selective cleavage dominate the spectrum, and encompass 23% of the total ion intensity in the spectrum. It is important to study spectra of this kind because they deviate the most from the uniform fragmentation model, and are usually classified as “low-information” content31 or sometimes “low quality” because the contiguous ion series are missing.
Figure 3.

Example of a spectrum showing selective cleavage from doubly-charged peptide LITSHLVDTDPEVDSIIKDEIER
To study how the identity of different basic residues influences the fragmentation statistics, spectral dataset I ([…P…H̶…R]+) is compared to II ([…P…H̶…K]+). The histidine residue is excluded because His is also a basic residue whose side-chain can serve as a “proton holder” and allow selective cleavage.14, 32 By excluding His, the main structural element that leads to the difference in basicity between these datasets is the C-terminal residue. An analysis was performed to see if these spectra fall into specific categories that involve non-selective vs. selective cleavage. The result shows that 53% of the spectra from Arg-ending peptides (dataset I) have 25% or more of the total fragment ion abundance contributed by the 2 most abundant fragment ion peaks; on average, these 2 most abundant peaks account for 52 ± 30% of the total abundance. However, only 26% of the spectra from peptides terminating in Lys (dataset II) have 25% or more of the total abundance contributed by the 2 most abundant peaks; on average, these 2 most abundant peaks account for 45 ± 24% of the total abundance.
Since the only difference in sequence motif between I and II is the terminal basic residue, one can conclude that the difference in the basicity between Arg and Lys results in different degrees of proton localization, thus leading to different degrees of selective cleavage. To find out which cleavages among the 400 residue combinations are selective, the fragmentation maps for these two datasets are generated.
c. Fragmentation maps for y ions from […P…H̶…R]+ vs. […P…H̶…K]+
Figures 4Iy and 4IIy show the maps for y ions from I ([…P…H̶…R]+) and II ([…P…H̶…K]+), respectively. For Arg- terminating peptides I, cleavage is very strong and concentrated C-terminal to Asp and Glu (rows labeled D and E), with the Asp cleavage stronger than Glu cleavage. Weak cleavage was observed N-terminal to Pro (column labeled P) and C-terminal to asparagine (Asn or N). Cleavages at other sites are minimal. For Lys-ending peptides II, the dominant cleavage is N-terminal to Pro, followed by C-terminal to Asp. Only weak cleavage is observed C-terminal to Glu. Weak cleavage is also observed N-terminal to Gly. While minimal cleavages are observed C-terminal to Gly and Pro, most residue combinations show more abundant cleavage in Figure 4IIy that in Figure 4Iy. Rows for Arg and Lys are missing because Arg and Lys only occur at the C-terminus in the peptides of these datasets, i.e., they are not located N-terminal to any other residues. Most of the column information for Arg and Lys is missing because y1 product ions are often below the low mass cut-off inherent to ion trap instruments.
Figure 4.

Pair-wise fragmentation maps showing median bond cleavage intensities at specific Xxx-Zzz residue combinations from I […P…H̶…R]+ and II […P…H̶…K]+. The ion intensities are normalized to the most abundant peak in b and y ions combined. Subscripts “b” and “y” correspond to the ion types. The single letter codes of AA residues listed in the leftmost column correspond to the N-terminal residue (Xxx) in an Xxx-Zzz pair while those listed along the topmost row correspond to the C-terminal residue (Zzz). The color scheme is shown on the right side of each map. The horizontal dimension of each ellipse is proportional to the count of such pair-wise cleavages. Illustrations of such proportion between the size and the count are shown under the color bar at the lower right corner. See Table 3 for the number of peptides in each set.
Based on previous studies, enhanced cleavage at acidic residues demands the absence of a proton at Asp-Xxx or Glu-Xxx.13 The observation that cleavages at Asp-Xxx and Glu-Xxx are stronger in Arg-ending than Lys-ending peptides corroborates the argument that the Arg side-chain is more effective in sequestering the ionizing proton than the side-chain of Lys.12, 14, 26 The fact that both datasets contain at least one Pro in their sequence, but cleavage at Xxx-Pro is enhanced only in Lys-ending peptides indicates that differences in proton localization causes the difference in Xxx-Pro cleavage patterns—cleavage at Xxx-Pro is charge dependant, i.e., requires a proton at the Xxx-Pro amide bond (see also results for III, IV).
For singly-charged Arg-ending peptides, the result suggests that only one dominant protonation form exists in which proton is completely “sequestered” by the guanidino side chain and not accessible to the peptide backbone. This is consistent with the observation that (1) no enhanced cleavage occurs at Xxx-Pro, even though Pro is present in all peptides and (2) cleavages at Asp-Xxx and Glu-Xxx are the dominant cleavage pathways, because these cleavages are “charge-remote”,13, 24 i.e., they do not involve the added proton. Lys-ending singly-charged peptides fragment at both Asp-Xxx and Xxx-Pro, cleavages previously suggested as being “charge-remote” and “charge-directed”,24 respectively. The strong cleavage at Xxx-Pro is detected in all cases where there is at least one proton in excess of the number of basic residues (See Table 3, datasets III, IV). Thus for Lys-ending peptides, the data suggest that the side-chain of Lys is not basic enough to completely sequester the ionizing proton. Therefore, when energy is added during the low energy CID process, the proton is able to leave the Lys side-chain and reach the peptide backbone. A heterogeneous population of two or more protonated forms exist in such peptides. The first protonation form is similar to that of Arg-ending peptides where the proton is localized by the basic side chain allowing charge-remote selective cleavage at Asp-Xxx. A second form leads to charge-directed selective cleavage at Xxx-Pro. In the subsequent text, “a partially mobile proton” will be used to denote the existence of multiple protonation forms, i.e., more facile intramolecular protein transfer. This terminology is a related but perhaps less rigid definition of “partially mobile” than used previously16 by Kapp et. al.. Rather than counting the number of charges vs. the number of basic residues, we base our definition on fragmentation maps presented in this paper. The difference in the definition of “a partially mobile proton” between ours and that used by Kapp et. al. will be further contrasted in Section f for dataset VI.
d. Fragmentation maps for b ions from […P…H̶…R]+ vs. […P…H̶…K]+
Fragmentation maps for b ions from I and II are shown in Figure 4Ib and 4IIb. Comparing the overall intensities in these b ion maps to those in the y ion maps from the same datasets (Figures 4Iy and 4IIy) shows that b ions are significantly less abundant than y ions, since each peak is normalized to the most abundant peak among all b and y ions. This correlates well with the statistics in Figure 2. Cleavages overall are more abundant in Lys-ending peptides than Arg-ending peptides. No enhanced cleavages C-terminal to acidic residues or N-terminal to Pro are observed in these b ion maps.
The absence of enhanced cleavages at Asp-Xxx and Xxx-Pro in these b ion maps can be explained by the location of the proton during and after the fragmentation process. In tryptic peptides, when selective cleavage occurs C-terminal to acidic residues, the proton is at the basic side chain of the C-terminal Arg or Lys. This proton retention is most likely to continue after the Asp-Xxx bond breaks which results in a y ion and a neutral N-terminal anhydride fragment. For selective cleavage N-terminal to Pro, the proton is likely at the carbonyl oxygen, or perhaps amide nitrogen, of the Xxx-Pro bond to initiate such cleavage. When the Xxx-Pro bond breaks, the C-terminal piece is most likely to retain the single charge. The N-terminal fragment, which would form a b ion if the charge were retained, cannot compete with the C-terminal fragment because of the large basicity difference: (1) Pro, with a secondary amine group, is at the N-terminus and (2) Lys is at the C-terminus of the forming C-terminal fragment. In order to see the corresponding b ions from these cleavages, an additional proton and an additional basic residue as the proton holder on the N-terminal side of the Asp-Xxx or Xxx-Pro bond may be needed. (See Section j for characterization of spectra from doubly-charged tryptic peptides with one internal basic residue on the N-terminal side of the Asp-Xxx or Xxx-Pro bond.)
e. Fragmentation maps for y ions from 2+ R-ending and K-ending peptides
Figures 5IIIy and 5IVy are the y ion fragmentation maps generated for III ([…P…H̶…R]2+) and IV ([…P…H̶…K]2+). In contrast to their singly-charged counterparts (Figure 4Iy and 4IIy), which differ for Arg- vs. Lys-ending peptides, these maps appear very similar. Our statistical similarity test gives a p-value of 0.0025 between these two maps, which is greater than the threshold 0.001. Therefore, these two maps do not display significant difference in their fragmentation patterns. Cleavage N-terminal to Pro is the dominant cleavage in both maps, but not as abundant as that in Figure 4IIy. Minimal cleavages are observed C-terminal to Gly and Pro, while weak cleavages are observed C-terminal to Ile, Val, Leu and N-terminal to Phe, Gly, and Ser.
Figure 5.

Pair-wise fragmentation maps from III […P…H̶…R]2+ and IV […P…H̶…K]2+. See caption for Fig. 4.
These two maps corroborate well with our earlier analysis17 and are expansions of it. In the earlier analysis published in a communication, there is no separation based on the terminal basic residue, His is not purged from the sequence, and that lead to greater variation of the basicity among the dataset. Also the statistical tools employed in the current study make the new plots richer in information and statistically more meaningful (a gradient is used for the color scheme instead of a step function, count information is imbedded in the current plots, and the FI threshold is used to validate the distribution for AA pairs that have lower occurrence). Since only one basic residue exists in these peptides, but two protons are available, these data represent the cases when one proton is “localized” at the basic side-chain, and the other proton is mobile, i.e., being transferred intra-molecularly along the peptide backbone, initiating cleavage at any one of a variety of sites for individual protonated molecules of the whole activated population. Clearly shown from these two maps are that even when a mobile proton is available, there are favored and unfavored cleavage sites. Chemical interactions between the side-chains and the backbone, as well as secondary structures of the peptides are the proposed main factors behind these patterns.
The b ion fragmentation maps for III and IV are also generated but not shown here. Preferential cleavage N-terminal to Pro is observed in both maps but its abundance is far less in b ion maps than those in the y ion maps. When these b ions are normalized to themselves, i.e., to the most abundant b ion, their fragmentation maps show similar patterns as those of y ions17 (See also Section i, Figures 8IXb and 8IXy). The overall cleavage intensities observed in these b ion maps are less than those of the b ion maps from singly-protonated Lys-ending peptides (Figure 4IIb).
Figure 8.

Pair-wise fragmentation maps from IX [……R/K]2+. The intensity of each ion is normalized to the most abundant peak of that ion type.
The fact that preferential cleavage occurs at Pro when a second charge is added to Arg- or Lys- ending tryptic peptides is consistent with the involvement of an added proton in the cleavage at Xxx-Pro. The preferential cleavage at Pro does not indicate localization of the added proton at Pro because fragmentation is a kinetic process (a Pro-protonated form may fragment faster even if other protonated forms exist). Other cleavages are also detected in the presence of Pro. A recent publication shows that for N-Acetyl OMe proline, proton can be transferred from carbonyl oxygen to amide nitrogen with assistance of an adjacent carbonyl.33 When there is only one proton available, preferential cleavage at Xxx-Pro was seen only for Lys-ending (Figure 4IIy) but not for Arg-ending peptides (Figure 4Iy). This is consistent with the lower basicity of Lys allowing the proton to migrate away from the Lys side-chain.
f. Fragmentation maps for b ions and y ions from […R…P…H̶…D/E…R]2+ vs. […K…P…H̶…D/E…K]2+
The y ions are dominant for the spectral sets presented above. This is consistent with the fact that these peptides all have only one basic residue, and that basic residue is at the C-terminus. However, in practical proteomics studies, tryptic peptides with missed cleavages are also common (Figure 1). For those peptides, basic residues are present in more than one location, which may change the b vs. y intensity patterns.15 Fragmentation maps of b and y ions from V ([…R…P…H̶…D/E…R]2+) and VI ([…K…P…H̶…D/E…K]2+) are generated (Figures 6Vb, 6Vy, 6VIb, and 6VIy). Since these two sets of spectra are from peptides with very specific structural motifs, the numbers of spectra that fit the criteria are limited. Hence for these two datasets, the occurrences are low (<10) for quite a few pair-wise cleavages. The FI threshold is particularly useful here to overcome the lower number of spectra and show statistically valid trends.
Figure 6.

Pair-wise fragmentation maps from V […R…P…H̶…D/E…R]2+ and IV […K…P…H̶…D/E…K]2+. See caption for Fig. 4.
The b and y ion maps (Figures 6Vb and 6Vy) from V ([…R…P…H̶…D/E…R]2+) are both similar to the y ion map (Figures 4Iy) from I ([…P…H̶…R]+). Enhanced cleavage is observed C-terminal to Asp and Glu; some weak cleavage was observed N-terminal to Pro; while cleavages at other AA pairs are suppressed. These results support our hypothesis that the reason enhanced cleavages at Asp-Xxx and Xxx-Pro were not observed in b ion maps of singly-charged tryptic peptides I and II is because there is only one charge and one proton holder at the C-terminal side of the cleavage bond, but no proton holder available at the N-terminal side. Once an additional proton is added and a basic residue exists at the N-terminal side of Asp or Pro, the b ions from cleavages at Asp-Xxx or Xxx-Pro show up. In addition, the b ion map (Figures 6Vb) shows more abundant cleavage at acidic residues than the y ion map (Figures 6Vy) and is more similar to Figure 4Iy. Similarity tests show that among all the maps present in this study, Vb has the shortest similarity distance to Iy (Table 4). This slight predominance of b ions over y ions correlates with our observation on cleavage from peptides without basic residues (Figure 2). When the basicity of the residues from either side of the cleavage is the same, the N-terminal amine is giving b ions preference over y ions. However, a similar b vs. y intensity pattern was not found in Lys-containing dataset VI.
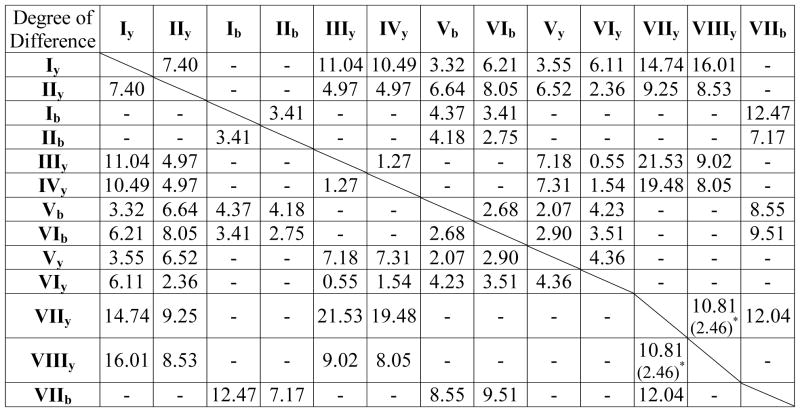
Table 4.
The degree of difference between selected pairs of fragmentation maps. A smaller number means the two sets compared are more similar. The Roman numerals (I, II, …, VIII) correspond to spectral sets described in Table 3. The subscripts “b” and “y” correspond to the ion types. Some pairs are not selected because they have very few or no common elements in their fragmentation maps shown in Figure 4–7.
|
The number in ( ) correspond to the comparison between VIIy and VIIIy with the rows of D and E purged.
The fragmentation maps from VI ([…K…P…H̶…D/E…K]2+) are shown in Figures 6VIb and 6VIy. According to the “relative proton mobility scale”16 by Kapp et al., “peptide ions” in VI should contain “partially mobile” protons. However, the fragmentation maps show that these peptides behave more similarly to peptides that have a mobile proton. Despite the fact that there is one Lys on the N-terminal side of the peptides, the y ions (Figure 6VIy) are significantly more abundant than the b ions (Figure 6VIb). The y ion map VIy shows patterns more similar to those from IIIy ([…P…H̶…R]2+) and IVy ([…P…H̶…K]2+), rather than IIy ([…P…H̶…K]+). In fact, our statistical similarity tests show a p-value of 0.0027 between VIy and IIIy, and a p-value of 0.00013 between VIy and IVy (as will be shown in Table 4 below, these two pairs of sets have two of the smallest degrees of difference between sets). The b ion map VIb does show some degree of similarity to IIy ([…P…H̶…K]+): cleavages at Asp-Xxx and Xxx-Pro are more abundant than cleavages at other places; however, their intensities are rather weak. The dominance of y ions in VI suggests that when Lys is present at the middle of the sequence rather than at the C-terminus, its ability to sequester the added proton is significantly hindered. In addition, cleavage at Asp-Xxx is significantly weaker in VI vs. V. Such a difference was not observed between the singly-charged peptides II vs I (Figures 4IIy and 4Iy). These observations suggest a possible interaction between the side-chain of the internal Lys and the side-chain of Asp among the majority of the peptide molecules in VI. A bridge structure may exist in these molecules that prevents the Lys side-chain from sequestering the proton, allowing a mobile proton to induce fragmentation similar to that in doubly-charged tryptic peptides without internal basic residues (III and IV). Whether or not such an interaction can form may depend on the distance between Lys and Asp, and the secondary structure of the peptide. When such interaction does not happen for a small population of the peptides, Lys then has a similar behavior in VI as that of Arg in V, initiating selective cleavage at Asp.
g. Fragmentation maps for y ions and b ions from tryptic peptides that do not contain Pro
Cleavage N-terminal to Pro dominates the y ion fragmentation maps from peptides that have a mobile or partially mobile proton (Table 3). When their no-Pro counterpart peptides VII ([…P̶…H̶…K]+) and VIII ([…P̶…H̶…R/K]2+) are selected, more abundant cleavages are observed in y ions at almost all residue combinations (Figures 7VIIy and 7VIIIy). Despite the difference in their charge states, VIIy and VIIIy show very similar patterns, except for the enhanced cleavage C-terminal to acidic residues. The similarity tests confirmed our observation: by excluding the cleavages C-terminal to acidic residues in the calculation, the similarity distance decreases from 10.81 to 2.46 between these two maps (Table 4). Enhanced cleavage C-terminal to branched aliphatic residues (Val, Ile, Lue) and suppression of cleavage C-terminal to Gly are observed in both maps. Relatively strong cleavages C-terminal or N-terminal to Tyr are also observed in both maps. The preference of Gly, Ser, Thr to cleave at their N-terminal sides rather than their C-terminal sides is more prominent in the map for singly-charged peptides (Figure 7VIIy). Dataset VIII has enough counts to show that Trp (W) can have relatively strong cleavage occurring at either its N- or C-terminal side (Figure 7VIIIy).
Figure 7.

Pair-wise fragmentation maps from VII […P̶…H̶…K]+ and VIII […P̶…H̶…R/K]2+. See caption for Fig. 4.
The dramatic change in fragmentation maps (Figure 4IIy vs. 7VIIy, Figures 5IIIy and 5IVy vs. 7VIIIy) shows that when Xxx-Pro is not available, other possible pathways take over. Figure 7VIIy also supports our conclusion that multiple protonation forms exist in singly-charged Lys-ending peptides. While enhanced cleavages at acidic residues account for one protonation form where the proton is at the basic side chain, similar to those observed for singly-charged Arg-ending peptides in Figure 4Iy, strong and weak cleavage patterns at other amino acid residues are similar to those observed for doubly-charged tryptic peptides (Figure 7VIIIy), in which one proton is transferred along the peptide backbone.
The b ion fragmentation maps for VII (Figure 7VIIb) and VIII (data not shown) are also prepared. While the b ions from VIII ([…P̶…H̶…R/K]2+), similar to the b ions from their Pro-containing counterparts III and IV, are much less abundant than the y ions from the same datasets, b ions from VII ([…P̶…H̶…K]+) show interesting patterns that have not been observed in other datasets. Similarity tests show VIIb is very different from any other b ion maps (Table 4). Enhanced cleavage N-terminal to Lys and branched aliphatic residues (Ile, Val, Leu) are observed in Figure 7VIIb. The degree of enhancement is higher at cleavage sites where the C-terminal residues are also aliphatic. Most patterns observed in the y ions from the same dataset are not observed in the b ions, e.g., no enhanced cleavage C-terminal to acidic residues or N-terminal to Gly, Ser and Thr.
Leaving Pro out from the singly-charged Arg-ending peptides without His did not change the fragmentation patterns. The b and y ion fragmentation maps from 829 singly-charged Arg-ending peptides without His or Pro ([…P̶…H̶…R]+, data not shown) are very similar to those from their Pro-containing counterparts (Figures 4Iy and 4Ib). This corroborates our earlier argument for a single protonation form among such peptides in which the proton is sequestered by the basic Arg side chain.
h. Similarity between fragmentation maps
Statistical similarity tests between the fragmentation maps from datasets I–VIII presented above were performed. Each map is compared to the rest to determine whether they exhibit similar fragmentation patterns. Except for pairs IIIy and IVy, IIIy and VIy, IVy and VIy, all other maps display unique fragmentation patterns that are significantly different from the rest (p-value < 1*10−14). Further assessment of the magnitude of difference was designed to determine if some maps are more similar to a specific map than to the rest. The degree of difference between selected pairs of fragmentation maps was calculated and the results are summarized in Table 4. The selection of the pairs of the maps to compare is based on whether the two maps display any common fragmentation patterns. Some pairs are not selected because they have very few or no common elements in their fragmentation patterns observed in Figure 4–7.
i. Fragmentation maps for doubly-charged tryptic peptides
We previously reported the fragmentation map for 5,654 doubly-charged tryptic peptides using a 10-scale color scheme and without the imbedded count information.17 Here, the fragmentation behavior of 10,638 doubly-charged tryptic peptides is shown in Figures 8IXb and 8IXy using the new visualization tools presented in this paper and twice as many unique peptides. A normalization scheme of the peak intensities similar to that in the communication,17 but different from those previously used in this paper, was applied for these two maps. Each ion is normalized to the most abundant peak of that ion type in that spectrum. The purposes for showing these two maps are: 1) to corroborate our previous results by using twice as many peptides and by using the new statistical visualization tools, and 2) to show the behavior of His in our dataset. The rest of the fragmentation maps presented in this paper do not contain the information for His, because His is excluded from the sequences to simplify interpretation of the possible chemical pathways.
The fragmentation patterns obtained in Figures 8IXb and 8IXy are almost identical to those previously reported,17 but more information is now provided. While b and y ions show very similar fragmentation patterns, the dominance of enhanced cleavage N-terminal to Pro indicates that one ionizing proton is at least partially mobile, if not fully mobile. His shows enhanced cleavages at its C-terminal side (His-Xxx) in both ion types. Compared to peptides without His (III and IV), IX shows slight enhancement of cleavage C-terminal to Asp in y ions, which can be attributed to those peptides that contain a His, and agrees with a previous study.14 In addition, cleavages C-terminal to aliphatic residues, especially β-branched Ile and Val, are more enhanced in both IXb and IXy than IIIy or IVy.
Conclusions
Peptide dissociation patterns in MS/MS spectra are a complex function of the charge state, residue identities, the order of the residues and the gas phase structure. The results from this study elaborate how a change in the number of protons or AA content can lead to dramatically different fragmentation patterns in low energy CID MS/MS of protonated peptides. In summary, analyses of a database of 28,330 spectra of unique sequence and charge states show that the most important factors influencing the fragmentation process are: the mobility of the proton, the position and the basicity of the most basic residue, and the presence of Pro. When the proton is localized, cleavage C-terminal to acidic residues dominates. When the proton is mobile or partially mobile, cleavage N-terminal to Pro dominates. Specific fragmentation patterns found in b ions and/or y ions are shown to depend on the location of the proton(s), or more specifically, the availability and the relative position of the basic residue(s). The pair-wise fragmentation map proves itself as a very useful tool in describing the different fragmentation behaviors from different sets of peptides. The overall statistical approach presented in this paper, including the computation of pair-wise fragmentation statistics, the visualization tool, the FI threshold, the similarity test and distance measurement, can be applied to any ion types from any given set of spectra, as long as the number of unique spectra is large enough to give statistically valid results.
The y ion fragmentation maps from singly- and doubly-charged tryptic peptides (Figures 4Iy, 4IIy, 5IIIy and 5IVy) explain why doubly-charged tryptic peptides are more readily identifiable by current sequencing algorithms than singly-charged tryptic peptides (Figure 1). The behavior of doubly-charged tryptic peptides resembles more closely the random cleavage model upon which the sequencing algorithms are based (At least modest cleavage happens at a variety of AA pairs). Singly-charged tryptic peptides deviate much more from such a model, with Arg-terminating peptides deviating more than Lys-ending peptides. This also explains why in singly-charged peptides, the number of identified spectra from Lys-ending peptides out-number Arg-ending peptides (Figure 1). The Lys-ending peptides have more overall cleavage, producing more information for the search algorithm to use in comparisons with candidate sequences. In doubly-charged peptides, this difference in number of identified spectra diminishes (Figure 1) because Arg-ending peptides have almost identical behavior to Lys-ending peptides.
The great variability in relative cleavage efficiencies between different AA residue combinations in almost all our fragmentation maps shows that the chemical properties of the side-chain play a significant role in determining how gas phase peptides fragment. As we noted previously for peptides that have a mobile proton, the variability is dominated by enhanced or suppressed cleavage at those residues (Gly, Pro, pre-Pro) that have Ramachandran phi, psi plots that differ from the general case, which suggests a steric influence on fragmentation.17 When Pro is not available in the sequence, those residues (Ile, Val) that occupy slightly lower percentages of total ψ, φ space than the other non-Pro residues34 dominates. High order computational molecular modeling studies are desirable to further elaborate the possible “cleaving” structures for these residue combinations.
Note that the sorting of the datasets presented in this paper is heavily based on assumptions derived from prior chemical knowledge of peptide dissociation. Spectra that do not fall into the categories specified were not included in the analyses. This problem will be overcome in another study35 using different data mining techniques, e.g., unsupervised clustering and decision tree, to present the overall fragmentation behavior of the 28,330 spectra.
It would be interesting to look at the fragmentation maps of b2+, y2+ from these datasets in a similar fashion. However, these doubly-charged fragment ions are not abundant from doubly-protonated precursor ions, and spectra from triply-protonated peptides where these ions are abundant are limited in number. Extensive sorting of the spectra to study b2+, y2+ fragmentation patterns often results in counts of pair-wise residue combinations too low to be statistically meaningful. Studies of other ion types would also be desirable in future, e.g., characterizing water loss and ammonia loss peaks from peptides containing specific structural motifs.
Results from this study expand our knowledge of peptide fragmentation chemistry and can guide experimental fragmentation studies of model peptides, e.g., mechanistic studies on Ser-containing and Gly-containing peptides will be pursued based on the observation that cleavage at Ser and Gly occurs preferentially at their N-terminal amide bond but is suppressed at their C-terminal amide bond, especially for peptides where the proton is partially mobile. The fact that peptides with different chemical motifs display different fragmentation patterns should be considered in the fragmentation models for sequencing algorithms to improve the success rate of the algorithms; this work is in progress in our laboratory. Pair-wise cleavage patterns will be utilized to allow the algorithms to predict fragment ion intensities given a candidate sequence.
Supplementary Material
Acknowledgments
We thank Li Ji in assisting spectra filtering This work was financially supported by NIH grant R01GM 51387 to V.H.W. and the 2003 Pfizer Graduate Research Fellowship in Analytical Chemistry to Y.H. Research at PNNL was partially supported by the U.S. DOE, Office of Biological and Environmental Research and the NIH National Center for Research Resources (RR018522). PNNL is operated by Battelle Memorial Institute for the U.S. DOE under contract DE-AC06-76RLO 1830. The collaboration between Y.H. and G.C.T was made possible by the UCLA Institute of Pure and Applied Mathematics and NSF, when Y.H. and G.C.T. participated in the IPAM spring 2004 Program “Proteomics: Sequence, Structure, Function”, from March 8 - June 11, 2004.
Footnotes
Supporting Information Available
Detailed discussion of the “Ion Statistics” results shown in Tables 1 and 2, as well as Figure 2.
References
- 1.Aebersold R, Goodlett DR. Chem Rev. 2001;101:269–295. doi: 10.1021/cr990076h. [DOI] [PubMed] [Google Scholar]
- 2.Aebersold R, Mann M. Nature. 2003;422:198–207. doi: 10.1038/nature01511. [DOI] [PubMed] [Google Scholar]
- 3.Fenyo D. Curr Opin Biotechnol. 2000;11:391–395. doi: 10.1016/s0958-1669(00)00115-4. [DOI] [PubMed] [Google Scholar]
- 4.Eng JK, McCormack AL, Yates JR. J Am Soc Mass Spectrom. 1994;5:976–989. doi: 10.1016/1044-0305(94)80016-2. [DOI] [PubMed] [Google Scholar]
- 5.Resing KA, Meyer-Arendt K, Mendoza AM, Aveline-Wolf LD, Jonscher KR, Pierce KG, Old WM, Cheung HT, Russell S, Wattawa JL, Goehle GR, Knight RD, Ahn NG. Anal Chem. 2004;76:3556–3568. doi: 10.1021/ac035229m. [DOI] [PubMed] [Google Scholar]
- 6.Tabb DL, Smith LL, Breci LA, Wysocki VH, Lin D, Yates JR. Anal Chem. 2003;75:1155–1163. doi: 10.1021/ac026122m. [DOI] [PMC free article] [PubMed] [Google Scholar]
- 7.Elias JE, Gibbons FD, King OD, Roth FP, Gygi SP. Nat Biotechnol. 2004;22:214–219. doi: 10.1038/nbt930. [DOI] [PubMed] [Google Scholar]
- 8.Smith LL. PhD Dissertation. University of Arizona; 2003. [Google Scholar]
- 9.Perkins DN, Pappin DJC, Creasy DM, Cottrell JS. Electrophoresis. 1999;20:3551–3567. doi: 10.1002/(SICI)1522-2683(19991201)20:18<3551::AID-ELPS3551>3.0.CO;2-2. [DOI] [PubMed] [Google Scholar]
- 10.Tsaprailis G, Nair H, Somogyi A, Wysocki VH, Zhong WQ, Futrell JH, Summerfield SG, Gaskell SJ. J Am Chem Soc. 1999;121:5142–5154. [Google Scholar]
- 11.Burlet O, Yang CY, Gaskell SJ. J Am Soc Mass Spectrom. 1992;3:337–344. doi: 10.1016/1044-0305(92)87061-3. [DOI] [PubMed] [Google Scholar]
- 12.Dongre AR, Jones JL, Somogyi A, Wysocki VH. J Am Chem Soc. 1996;118:8365–8374. [Google Scholar]
- 13.Gu CG, Tsaprailis G, Breci L, Wysocki VH. Anal Chem. 2000;72:5804–5813. doi: 10.1021/ac000555c. [DOI] [PubMed] [Google Scholar]
- 14.Huang Y, Wysocki VH, Tabb DL, Yates JR. Int J Mass Spectrom. 2002;219:233–244. [Google Scholar]
- 15.Tabb DL, Huang Y, Wysocki VH, Yates JR. Anal Chem. 2004;76:1243–1248. doi: 10.1021/ac0351163. [DOI] [PMC free article] [PubMed] [Google Scholar]
- 16.Kapp EA, Schutz F, Reid GE, Eddes JS, Moritz RL, O’Hair RAJ, Speed TP, Simpson RJ. Anal Chem. 2003;75:6251–6264. doi: 10.1021/ac034616t. [DOI] [PubMed] [Google Scholar]
- 17.Huang Y, Triscari JM, Pasa-Tolic L, Anderson GA, Lipton MS, Smith RD, Wysocki VH. J Am Chem Soc. 2004;126:3034–3035. doi: 10.1021/ja038041t. [DOI] [PubMed] [Google Scholar]
- 18.Tabb DL, Smith LL, Breci LA, Wysocki VH, Lin D, Yates JRI. Analytical Chemistry. 2003;75:1155–1163. doi: 10.1021/ac026122m. [DOI] [PMC free article] [PubMed] [Google Scholar]
- 19.Breci LA, Tabb DL, Yates JR, Wysocki VH. Anal Chem. 2003;75:1963–1971. doi: 10.1021/ac026359i. [DOI] [PubMed] [Google Scholar]
- 20.Smith RD, Anderson GA, Lipton MS, Pasa-Tolic L, Shen YF, Conrads TP, Veenstra TD, Udseth HR. Proteomics. 2002;2:513–523. doi: 10.1002/1615-9861(200205)2:5<513::AID-PROT513>3.0.CO;2-W. [DOI] [PubMed] [Google Scholar]
- 21.Aebersold R. IPAM Workshop on “Proteomics: Sequence, Structure, Function”. UCLA; Los Angeles, California, Keynote Talk: Mar 23, 2004. [Google Scholar]
- 22.Bickel PJ, Doksum KA. Mathematical Statistics: Basic Ideas and Selected Topics. 2. I. Prentice Hall; [Google Scholar]
- 23.Rice JA. Mathematical Statistics and Data Analysis. 2. Duxbury Press; 1994. [Google Scholar]
- 24.Wysocki VH, Tsaprailis G, Smith LL, Breci LA. J Mass Spectrom. 2000;35:1399–1406. doi: 10.1002/1096-9888(200012)35:12<1399::AID-JMS86>3.0.CO;2-R. [DOI] [PubMed] [Google Scholar]
- 25.Tsaprailis G, Somogyi A, Nikolaev EN, Wysocki VH. Int J Mass Spectrom. 2000;196:467–479. [Google Scholar]
- 26.Sullivan AG, Brancia FL, Tyldesley R, Bateman R, Sidhu K, Hubbard SJ, Oliver SG, Gaskell SJ. Int J Mass Spectrom. 2001;210:665–676. [Google Scholar]
- 27.Papayannopoulos IA. Mass Spectrom Rev. 1995;14:49–73. [Google Scholar]
- 28.Loo JA, Edmonds CG, Smith RD. Anal Chem. 1993;65:425–438. doi: 10.1021/ac00052a020. [DOI] [PubMed] [Google Scholar]
- 29.Reid GE, Wu J, Chrisman PA, Wells JM, McLuckey SA. Anal Chem. 2001;73:3274–3281. doi: 10.1021/ac0101095. [DOI] [PubMed] [Google Scholar]
- 30.Reid GE, Stephenson JL, McLuckey SA. Anal Chem. 2002;74:577–583. doi: 10.1021/ac015618l. [DOI] [PubMed] [Google Scholar]
- 31.Simpson RJ, Connolly LM, Eddes JS, Pereira JJ, Moritz RL, Reid GE. Electrophoresis. 2000;21:1707–1732. doi: 10.1002/(SICI)1522-2683(20000501)21:9<1707::AID-ELPS1707>3.0.CO;2-Q. [DOI] [PubMed] [Google Scholar]
- 32.Tsaprailis G, Nair H, Zhong W, Kuppannan K, Futrell JH, Wysocki VH. Anal Chem. 2004;76:2083–2094. doi: 10.1021/ac034971j. [DOI] [PMC free article] [PubMed] [Google Scholar]
- 33.Komaromi I, Somogyi A, Wysocki VH. Int J Mass Spectrom. 2005;76:315–323. [Google Scholar]
- 34.Kleywegt GJ, Jones TA. Structure. 1996;4:1395–1400. doi: 10.1016/s0969-2126(96)00147-5. [DOI] [PubMed] [Google Scholar]
- 35.Huang Y, Tseng GC, Yuan S, Pasa-Tolic L, Lipton MS, Smith RD, Wysocki VH. manuscript in preparation. [Google Scholar]
Associated Data
This section collects any data citations, data availability statements, or supplementary materials included in this article.