Abstract
Fourier transform ion cyclotron resonance (FT-ICR) mass spectrometry is becoming more widely used among the mass spectrometric techniques, and has excellent figures of merit. Ion activation and fragmentation via sustained off-resonance irradiation (SORI) collision-induced dissociation (CID) is commonly used in FT-ICR. However, one of the limitations of SORI-CID is that only low energy processes are typically observed in the product ion spectra. Here we present another option for performing CID in FT-ICR, a combination of SORI and on-resonance excitation (RE), termed SORI-RE. In comparison to SORI, this method enables more efficient formation of product ions resulting from higher energy fragmentation pathways. The result is the observation of a significant abundance both higher and lower energy fragmentation pathways in the same mass spectrum. The comparison of SORI, RE, and SORI-RE spectra may lead to mechanistic insights as the relative abundances of certain fragment ions change as a function of internal energy deposition. This technique is simple to incorporate in existing instruments, does not require hardware or software modification, and requires only an additional 20-40 ms acquisition time. The technique is illustrated for a peptide (YGGFL), two disaccharides differing in the position of the glycosidic linkage (2α-mannobiose and 3α-mannobiose), an oligosaccharide (Alditol XT), a small protein (ubiquitin), and an inorganic cation (UO2+). Examples of higher energy fragmentation pathways enhanced by SORI-RE include the formation of immonium ions and oligosaccharide cross-ring cleavages.
II. Introduction
Fourier transform ion cyclotron resonance (FT-ICR) mass spectrometry (MS) is a well-established high sensitivity and accurate mass technique that can be successfully applied in single and multiple stage (MSn) modes to gain sequence and structural information about biopolymers such as proteins, peptides, and carbohydrates.1, 2 FT-ICR is routinely coupled to matrix-assisted laser desorption/ionization3 (MALDI) and electrospray ionization4 (ESI) for the study of large biomolecules.
Ion dissociation techniques for the fragmentation of biomolecules in FT-ICR include infrared multiphoton dissociation (IRMPD),5-7 blackbody infrared radiative dissociation (BIRD),8, 9 sustained off-resonance irradiation collision-induced dissociation (SORI-CID),10, 11 on-resonance excitation CID (RE-CID),12-14 electron capture dissociation (ECD),15-17 surface-induced dissociation (SID),18, 19 electron detachment dissociation (EDD),20 and UV photodissociation.21-23 Information about the primary structure of a biomolecule is obtained through sequence-specific fragmentation. This includes fragmentation between basic building blocks, such as amino acid residues, and fragment ions characteristic of building blocks (i.e., amino acid immonium ions, which define the presence of a corresponding amino acid in a peptide and can be used to eliminate candidate sequences during peptide identification searches). This fragmentation should be as non-selective as possible to maximize the structural information gained. IRMPD, BIRD, and SORI-CID can be considered “gentle” ion activation techniques and are characterized by fragment ions resulting mainly from low energy processes. SORI-CID and RE-CID are analogous fragmentation techniques differing in application by the frequency, amplitude, and time of the energy pulse applied to translationally excite the ions.
During SORI-CID, ions are excited by application of an rf electric field pulse with a frequency “off-resonance” with the ion's natural cyclotron frequency, ωc. This frequency pulse results in a maximum translational energy, Etr, given by
| (1) |
where E is the amplitude of the rf pulse, e is the electric charge, ω is the excitation frequency, and t is the duration of the rf pulse.24 The “off-resonance” pulse results in the ion undergoing some number, n, of acceleration-deceleration cycles given by24:
| (2) |
A result of these acceleration-deceleration cycles is that an ion will be confined in the cell for a sustained period of irradiation (>500 ms). In the presence of a low-mass gas target (e.g., N2 or Ar) at a pressure of approximately 10−6 torr, SORI results in many sequential, low energy inelastic collisions, which activates the molecules slowly. This “slow activation” results in dissociation occurring mainly through the lowest energy fragmentation channels.11, 25
Fragmentation in an FT-ICR cell can also be accomplished by applying a short (<500 μs) rf pulse whose frequency is on-resonance (termed “RE” for “on-resonance excitation”) with the cyclotron frequency of the ion (e.g., ω = ωc). In this case, the maximum translational energy of the ion is given by26:
| (3) |
The formation of ions off-axis is a disadvantage of RE-CID resulting in a radial, diffusional loss of product ions, limited subsequent stages of fragmentation, and reduced resolving power.27 RE is, in practice, more time consuming to optimize than SORI. These shortcomings have lead to SORI-CID as the preferred method of fragmentation, although RE-CID excitation is sometimes more efficient at producing ions resulting from higher-energy fragmentation pathways.
In certain instances, it is advantageous from structural and analytical points of view to obtain fragment ions resulting from both low and high-energy fragmentation pathways. However, certain fragmentation pathways may be particularly facile when a low energy collisional activation technique such as SORI-CID is used, causing higher energy pathways to be suppressed.11 This is especially true in the fragmentation of carbohydrates in which the cleavage of the glycosidic linkages occurs generally at lower fragmentation thresholds and cross-ring cleavages occur at higher fragmentation thresholds. Another example is the fragmentation of protonated peptides. Statistical analyses and mechanistic studies of peptide fragmentation have revealed residue-specific preferential cleavage N-terminal to proline (Pro) in the presence of a mobile proton, and C-terminal to aspartic acid (Asp) and glutamic acid (Glu) in the absence of a mobile proton.28-36 Under certain conditions, the dominance of these preferential cleavages may lead to a loss of fragmentation information because other fragment peaks may be of very low abundance or not present.
Here, we introduce the combination of SORI-CID and RE-CID, termed SORI-RE, which often enhances the observation of higher-energy fragmentation product ions. In SORI-RE, a low energy SORI pulse is followed by a comparatively short and high-energy RE pulse. The application of the SORI pulse increases the internal energy of the ions so that some portion of the ions has enough internal energy to dissociate, mainly through the lowest energy dissociation pathways. The undissociated but activated ions remain below the fragmentation threshold. The subsequent application of a RE pulse causes the internal energy of the remaining precursor ions to rise significantly above the fragmentation threshold. This results in an enhancement of higher energy fragment ions, which appear along with the lower energy fragment ions produced in the SORI step. In certain instances, the ion population is not homogeneous, but exists as a heterogeneous mixture with several subpopulations containing different protonated forms and/or conformations, as demonstrated by ion mobility and gas phase H/D exchange.37-39 The increased internal energy produced in SORI-RE does not simply initiate higher energy fragmentation, but may also alter these heterogeneous populations. The experiment described here is related to a so-called “pump-probe” experiment, described before.40 In the previous experiment, BIRD was used to raise the internal energy of the precursor ion to a well-defined value. Next, CID was used to probe the amount of additional energy needed to reach a particular, final internal energy distribution. In the present experiment, SORI is used to pump energy into the precursor ion so that some portion of the precursor ions fragment through low energy pathways and RE is used to induce higher energy fragmentation of the remaining activated ion population. The internal energy is more well-defined in BIRD than in SORI, and so BIRD-CID is therefore more appropriate for fundamental energy deposition studies. However, the SORI-RE experiment represents a practical method for the enhancement of fragment ions resulting from higher energy pathways. This technique is both rapid and easy to apply in existing FT-ICR instruments equipped to perform SORI-CID because no hardware or software modification is required and the acquisition time is increased by only 20-40 ms. The information SORI-RE provides is complementary to SORI alone and can also provide additional structural/mechanistic information.
III. Experimental
Alditol XT, an O-linked oligosaccharide isolated from frog egg jelly5 was provided by the Carlito Lebrilla research group at the University of California, Davis. Uranyl nitrate hexahydrate was purchased from Aldrich (St. Louis, MO) and recrystallized before use. Methanol (CH3OH) was purchased from J.T. Baker (Phillipsburg, NJ) and used as received. 18 MΩ Milli-Q water was prepared (Millipore Corp., Bedford MA). All other chemicals were purchased from Sigma-Aldrich (St. Louis, MO) and used without further purification.
An IonSpec (Lake Forest, CA) 4.7 Tesla Fourier transform ion cyclotron resonance (FT-ICR) instrument was used for all fragmentation studies. Ions were generated using an Analytica (Branford, CT) second generation electrospray (ESI) source. All samples were introduced into the instrument by infusion at a flow rate of 2-3 μL/min through a stainless steel microelectrospray needle (0.004″ i.d.). Leucine enkephalin and ubiquitin solutions were prepared at a concentration of approximately 10-30 μM in 1:1 methanol:water with 1% acetic acid. 2α-mannobiose and 3α-mannobiose were prepared in a similar manner, except Li2CO3 was added at a concentration of approximately 30μM to induce formation of the lithiated molecules. Alditol XT was prepared at a concentration of 10-30μM in 1:1 methanol:water. The sodiated alditol XT ion was the main ion observed, although sodium ions were not added to the solution. Solutions 1 mM in UO 2+2 and 2 mM in NO3− were prepared in water and diluted three fold with 2:1 methanol:water. The glass capillary temperature was kept at 60°C, and 3.8 kV was applied to the electrospray needle.
The electrosprayed ions pass through a skimmer, and are collected in an external rf-only hexapole, where they are allowed to accumulate for 300-1000 ms before being passed into the analyzer through a shutter. An rf-only quadrupole guides the ions into the cylindrical ICR cell. Once the precursor ions are trapped inside the ICR cell, all other mass-to-charge value are ejected from the cell via a frequency sweep isolating the desired ion. Monoisotopic isolation was used for this study (except for ubiquitin) because RE tends to deplete the monoisotopic precursor ion peak (especially for singly charged precursor ions) while SORI may excite the 13C isotopic ion (with a +1000 Hz offset, for example). The absolute signal intensity of the precursor ion after isolation varied by less than ±10% when electrospray conditions were kept constant. After isolation, fragmentation was accomplished by SORI, RE, SORI-RE, or RE-SORI. SORI pulses varied in time from 50 ms to 3000 ms, and SORI voltages varied from 0.5 V to 6.0 V. Likewise, RE pulses varied in time from 10 μs to 25 μs, and RE voltages varied from 50 V to 400 V. Either nitrogen or argon gas was used as the collision gas at a pressure of approximately 2 × 10⁻⁶ torr in the ICR cell. The gas pulse was controlled through a pulse valve held open for the desired amount of time. For all SORI-CID experiments, the gas pulse started with the beginning of the SORI pulse and was applied for the same duration as the SORI pulse plus 50 ms. The SORI offset frequency was +1000 Hz. Changing the offset polarity had no observable effect on spectral appearance. As expected, as absolute offset frequency was reduced, the spectrum became more similar to a RE spectrum. For all RE-CID experiments, a RE pulse was applied 20 ms (minimum gap time required by hardware) after a 0 V “blank” SORI pulse. In addition, the gas was pulsed into the cell at the same time and for 50 ms longer than the 0 V “blank” SORI pulse (i.e., 550 ms total gas pulse). For all SORI-RE experiments, the gas pulse started with the beginning of the SORI pulse and ended 50 ms after the end of the SORI pulse. For all RE-SORI experiments, the gas pulse started 500ms before the RE pulse and ended with the end of the SORI pulse. During the SORI-RE experiments, the RE pulse was applied 20 ms after the end of the SORI pulse. In a few additional experiments, the time gap between SORI and RE (and also between RE and SORI) was varied between 20 and 500 ms.
An RF sweep with a width of 2 ms and amplitude of 120 V was used to excite the ions before detection. Broadband detection with an ADC rate of 2 MHz and 512 K samples was used. Three spectra were collected for each data point during the systematic measurement of the effect of SORI and RE time and amplitude on the fragmentation of leucine enkephalin. The B-spline standard routine in the Origin graphing software was used to connect the points. All spectra shown are the result of one acquisition; however, the acquisition was repeated at least three times to ensure reproducibility. Variation in ion abundances was generally less than ±10%.
Theoretical modeling has been performed by the MassKinetics 1.5 software program.41 This is a reaction kinetic model based on RRKM rate theory, and has been described elsewhere.42 The program uses known experimental parameters (e.g., voltages, time-scales, gas pressure), calculated molecular parameters (e.g., vibrational frequencies as calculated by quantum chemistry at the B3LYP 6-31 G* level) and reaction parameters such as critical energy and preexponential factors. To model fragmentation of leucine enkephalin, the well-known fragmentation scheme of peptides was used.43 The preexponential factor and critical energy corresponding to leucine enkephalin b4 ion formation was used as measured experimentally.44 In order to avoid over-fitting, a simple fragmentation model with a minimum number of adjustable parameters was used. All preexponential factors were 1011, which is close to the value for b4 formation. Critical energies for the formation of a4, b3, y2 and Y (equal to F) and for the mean collisional energy transfer value were optimized, altogether five adjustable parameters. The optimization criterion was to yield minimum root-mean-square error between calculated and experimentally determined SORI, RE, SORI-RE spectra. Identical parameters were used to calculate energy distributions, and time- and energy-dependent SORI, RE and SORI-RE spectra. Using additional adjustable parameters, such as optimizing the preexponential factors, would yield better agreement between experimental and theoretical spectra, but this was not attempted.
IV. Results and Discussion
Leucine Enkephalin: Relative energy of fragment ion formation
Leucine enkephalin contains five amino acids with the sequence tyrosine-glycine-glycine-phenylalanine-leucine (YGGFL). In general, protonated peptides tend to cleave at the amide bonds along the peptide backbone when CID is used as the ion activation method. Assuming a singly protonated peptide, if the charge remains on the N-terminal side of the peptide, the product ion is termed bn, where n refers to the number of amino acid residues counting from the N-terminus. Likewise, if the charge remains on the C-terminal side of the peptide, the fragment is identified as a yn ion, where n is determined by counting amino acid residues from the C-terminus.45 The formation of an ions commonly occurs via a loss of CO from bn ions.46-49
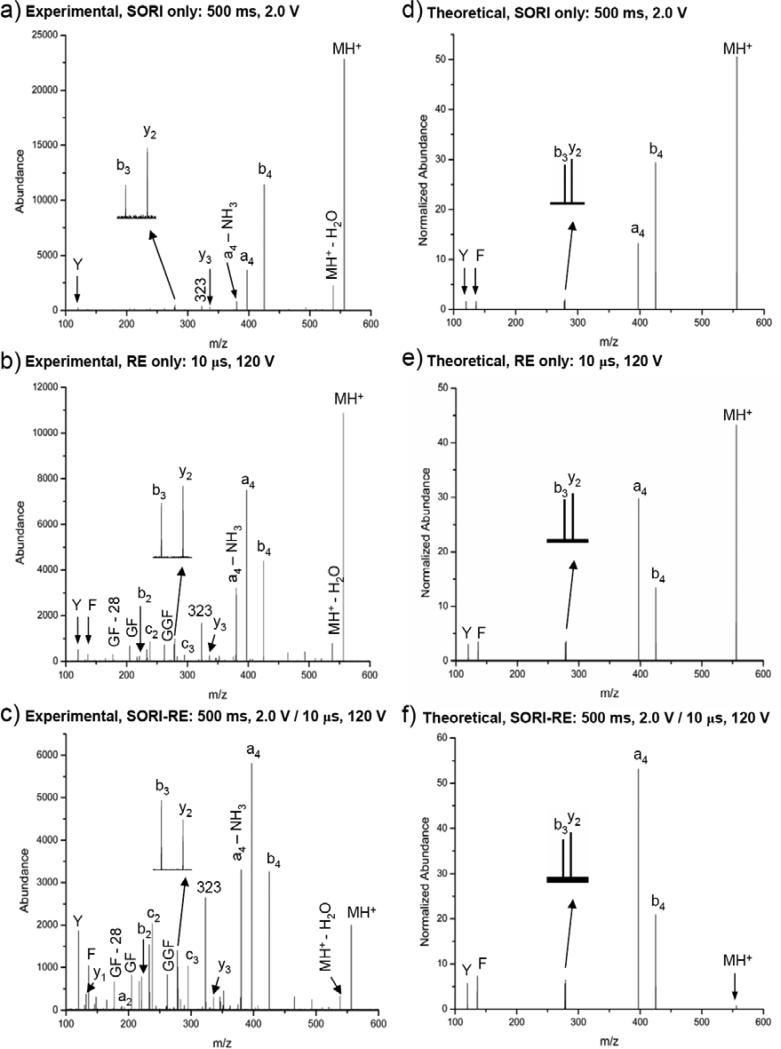
In the case of leucine enkephalin, the lowest energy fragmentation process is formation of b4; this is typically the most intense fragment in the case of SORI-CID and BIRD studies44 (m/z = 425.2, Figure 1a). Medium energy fragments include the a4 ion (m/z = 397.2, Figure 1a), which can be formed by the loss of CO from b4. The a4/b4 ratio is sometimes used to characterize the degree of excitation.50, 51 Other medium energy fragments are the b3 (m/z = 278.1) and y2 (m/z = 279.2) ions. Alexander and Boyd52 first suggested the use of the b3/y2 ratio as a sensitive measure for internal energy deposition into the precursor ions, and this ratio has been used elsewhere.51 The b3 ion results from a higher energy fragmentation pathway, therefore an increasing b3/y2 ratio indicates increasing energy content in the molecule.
Figure 1.
Experimental and calculated spectra for the monoisotopic selection and fragmentation of the YGGFL(H+) ion using argon as the collision gas (550 ms pulse): a) Experimental SORI: time = 500 ms, amplitude = 2.0 V b) Experimental RE: time = 10 μs, amplitude = 120 V c) Experimental SORI-RE: SORI time = 500 ms, amplitude = 2.0 V, 20 ms time gap, RE time = 10 μs, amplitude = 120 V d) Theoretical SORI: time = 500 ms, amplitude = 2.0 V e) Theoretical RE: time = 10 μs, amplitude = 120 V f) Theoretical SORI-RE: SORI time = 500 ms, amplitude = 2.0 V, 20 ms time gap, RE time = 10 μs, amplitude = 120V.
Formation of immonium ions is characteristic of high energy processes (i.e., greater energy requirements than any of the ions, b4, a4, b3, y2, considered here), and these immonium ions are only rarely observed with high abundance in FT-ICR CID.53-59 In the case of leucine enkephalin, immonium ions derived from phenylalanine (F) (m/z = 120.1) and tyrosine (Y) (m/z = 136.1) are expected. These immonium ions are indeed observed in SORI-RE (Figure 1c), while they are of very low abundance in the SORI-CID spectrum (Figure 1a). The abundance of a4 + b4 ions compared to that of the Y + F ions is an excellent measure of the degree of excitation in leucine enkephalin, e.g. SID and keV CID spectra contain abundant immonium ions.
Leucine Enkephalin: Comparison of SORI-CID, RE-CID, and SORI-RE-CID, and RE-SORI-CID spectra
Figure 1a-c shows the spectra obtained experimentally by SORI, RE, and SORI-RE CID fragmentation of the monoisotopically selected YGGFL(H+) ion using argon as the collision gas. When the YGGFL(H+) ion is fragmented via a 2.0 V, 500 ms SORI pulse (Figure 1a), the a4 and b4 ions are the most abundant fragment ions and these ions are present at an a4/b4 ratio of approximately 0.3. By contrast, when a 120 V, 10 μs RE pulse is applied (Figure 1b), the a4 ion becomes more abundant than the b4 ion. Also, the F and Y immonium ions, which result from higher energy fragmentation processes, are barely detectable in the SORI spectrum but are observable as ions of low abundance in RE. The b3 and y2 ions are present at a similar ratio in both the SORI and RE spectra.
The enhancement of higher energy fragmentation processes occurs when the 120 V, 10 μs RE pulse is applied 20 ms after the completion of the 2.0 V, 500 ms SORI pulse (Figure 1c). First, the a4 and b4 ions, while still very abundant, are not the only main fragment ions present. The F and Y immonium ions are much more abundant in the SORI-RE spectrum than in either the SORI or the RE spectra. The b3 and y2 ions are also enhanced as compared to SORI and RE alone. In contrast to the SORI and RE spectra, the SORI-RE spectrum has a y2 ion less intense than the b3 ion, also indicating a change in energy deposition. In addition, the singly charged ion at m/z 323 is enhanced compared to either SORI or RE. In the previously reported multistep mechanism for the formation of the m/z 323 ion, the a4 ion loses NH3 and undergoes a cyclic rearrangement. The rearranged ion has a previous internal residue (glycine) at the new N-terminus, and this glycine residue is readily lost, forming the ion at m/z 323.60 Therefore, it appears that combining SORI with RE has a synergistic effect, i.e., SORI-RE is not a simple linear combination of SORI and RE. Fragment ions resulting from higher energy channels are enhanced as compared to RE alone. In addition, the abundance of low energy fragment ions common in SORI spectra is maintained. A further advantage of SORI-RE is that it is easy to optimize and to perform.
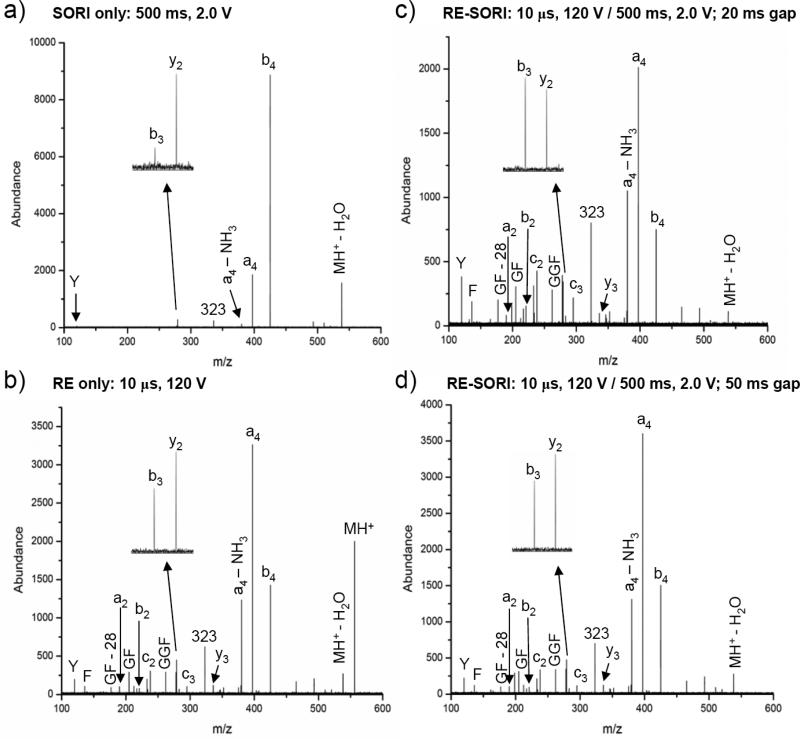
Changing the sequence of ion activation and performing RE first followed by a SORI cycle is also possible, but in such a case the results depend significantly on the time gap between the RE and SORI pulses.. Figure 2c-d shows the RE-SORI spectra when the gap between RE and SORI pulses is 20 ms and 50 ms, respectively, along with the corresponding SORI and RE spectra for comparison (Figure 2a-b). The collision gas valve was opened 500 ms before the RE pulse and closed at the end of the SORI pulse, resulting in an overall pulse time of 1020 ms – 1050 ms, depending on the time gap (compared to 550 ms for SORI-RE). This is necessary during RE-SORI due to the short duration of the RE pulse. Therefore, the precursor ion is depleted to a greater extent in the SORI and RE spectra shown in Figure 2a-b than in Figure 1a-b due to the higher collision gas pressure in the ICR cell. As expected, the highest abundance SORI fragment ions observed (i.e., a4, b4) with a 2.0 V, 500 ms pulse are those resulting from lower energy fragmentation processes (Figure 2a). In addition, the b3/y2 and a4/b4 ion ratios are both approximately 0.2. Figure 2b shows the result of a 10 μs, 120 V RE pulse. In this spectrum, a4 and b4 remain the highest abundance fragment ions. However, the F immonium, b3, and y2 ions are present at a higher abundance than in the SORI spectrum. The Y immonium ion, absent in the SORI spectrum, is also observed with RE. In addition, the b3/y2 and a4/b4 ion ratios have increased to 0.4 and 2.3. Figure 2c-d shows the result of combining the SORI and RE pulses from Figure 2a-b, with RE preceeding SORI. In Figure 2c, there is a 20 ms gap between the activation pulses, the shortest time gap allowed by the software. In this spectrum, the F immonium, Y immonium, m/z 323, b3, and y2 ions are enhanced as compared to SORI or RE alone. The b3/y2 and a4/b4 ion ratios are 1.1 and 2.7, respectively, indicating a higher level of energy deposition By contrast, the RE-SORI spectrum shown in Figure 2d with a 50 ms gap between activation pulses looks more similar to Figure 2c. First, the F immonium, Y immonium, m/z 323, b3, and y2 ion abundances are very similar to the RE spectrum in Figure 2b and less than the RE-SORI spectrum in Figure 2c (20 ms gap). Second, the b3/y2 and a4/b4 ion ratios are 0.7 and 2.4. While these ratios are somewhat higher than the ion ratios for RE alone, they are significantly smaller than the RE-SORI spectrum with a 20 ms gap between activation pulses. The spectral differences shown in Figures 2c and 2d illustrate that the precursor ions undergo collisional cooling when the gap between the RE and SORI pulses is 50 ms or greater. Also, when the gap between the RE and SORI pulses is short (i.e, 20 ms), more precursor ions may remain off-axis than with a longer time gap. It is important to note that the timing between the SORI and RE pulses when SORI is performed first is also important, although not as critical. If RE is performed 200 ms or less after SORI (data not shown), the spectrum is similar to that shown in Figure 1c. One advantage to performing SORI before RE is the lesser amount of collision gas that needs to be pumped away before detection. If RE is performed before SORI, the gas must be pulsed in several hundred milliseconds before the RE pulse. Also, when RE is performed first, off-axis ions lead to a radial loss of product ions, as well as precursor ions for the subsequent SORI stage.
Figure 2.
Experimental spectra for the monoisotopic selection and fragmentation of the YGGFL(H+) ion using argon as the collision gas (1050 ms pulse): a) SORI: time = 500 ms, amplitude = 2.0 V b) RE: time = 10 μs, amplitude = 120 V c) RE-SORI: RE time = 10 μs, amplitude = 120 V, 20 ms time gap, SORI time = 500 ms, amplitude = 2.0 V d) RE-SORI: RE time = 10 μs, amplitude = 120 V, 50 ms time gap, SORI time = 500 ms, amplitude = 2.0 V.
SORI, RE and SORI-RE spectra of YGGFL(H+) were also studied by theoretical modeling using MassKinetics.42 The three spectra were calculated as described in the Experimental section using only 5 adjustable parameters, most of these to account for the unknown activation energies of several fragmentation processes. The main spectral features of the calculated spectra (Figure 1d-f) correspond closely to those experimentally observed (Figure 1a-c): the a4/b4 ratio characterizes the medium-high excitation energy range, showing increasing excitation in the order of SORI, RE and SORI-RE. The a4 and b4 ion abundances follow the same trend in the experimental and theoretical spectra. The abundance of Y and F ions is characteristic of a high degree of excitation by SORI-RE, and the experimental and theoretical spectra show reasonable agreement. The medium energy y3 and b2 ions are of small abundance in both the observed and calculated spectra. The modeling results are quite promising, showing that the experimental and theoretical spectra follow the same trend, and the observed results are in reasonable agreement with theoretical expectations, even using only a few adjustable parameters. The theoretical results confirm that differences among SORI, RE and SORI-RE spectra are due to internal energy variations using the three different excitation methods.
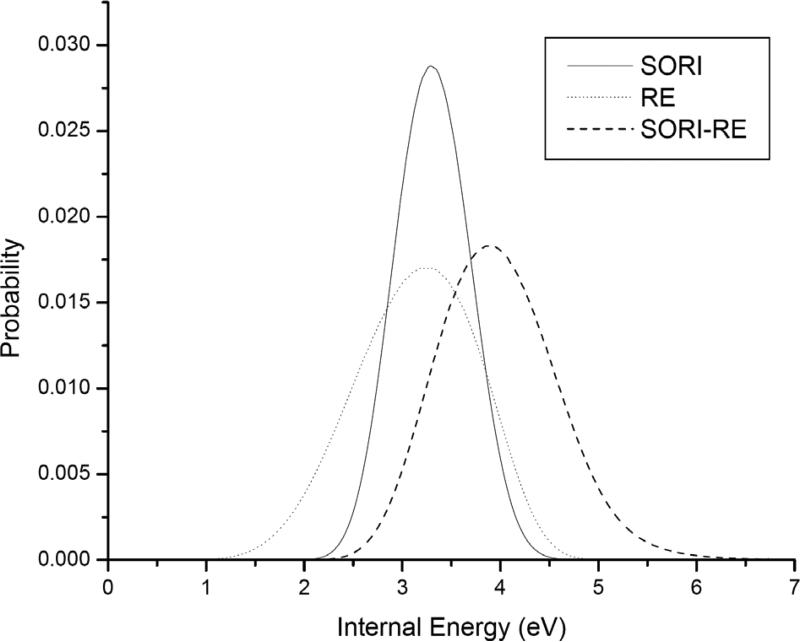
Differences in the spectra of SORI, RE and SORI-RE are relatively easily to explain using internal energy distributions. The average internal energy distribution changes with time. This time dependence is due to an increase in the average internal energy during excitation and a decrease when excitation stops because of fragmentation, and collisional and radiative cooling. Figure 3 shows the internal energy distributions at the time when the average internal energy is at its maximum value (i.e., immediately following the excitation period). These internal energy distributions were calculated using experimental conditions as specified for Figure 1. The collisions in RE are higher in kinetic energy as compared to SORI. However, the number of collisions is much smaller in RE. This results in a slightly higher mean internal energy in SORI than in RE, although RE is capable of producing high internal energy ions (but in low abundance only). This explains the higher abundance of the a4 ion (note especially the a4/b4 ratio, as discussed in detail below) and the increased abundance of the medium (b3, y2), and the high-energy ions (Y and F). Note also that the internal energy distribution increases only slightly if SORI is performed for a long time (as may be expected from a ‘slow heating’ technique, data not shown). Figure 3 is an excellent illustration why SORI-RE is capable of producing abundant high-energy fragments: the tail of the internal energy distribution extends far higher than would be obtainable by SORI only, and the average internal energy deposited by SORI-RE is also higher.
Figure 3.
Calculated internal energy distribution of YGGFL(H+) using experimental conditions as specified in Figue 1 for: a) SORI (corresponding to 90% parent ion decomposition) b) RE (at maximum average internal energy, see text) c) SORI-RE (at maximum average internal energy, see text).
Leucine Enkephalin: Effect of SORI and RE time and amplitude on the relative abundances of the a4, b4, F, Y, and MH+ ions
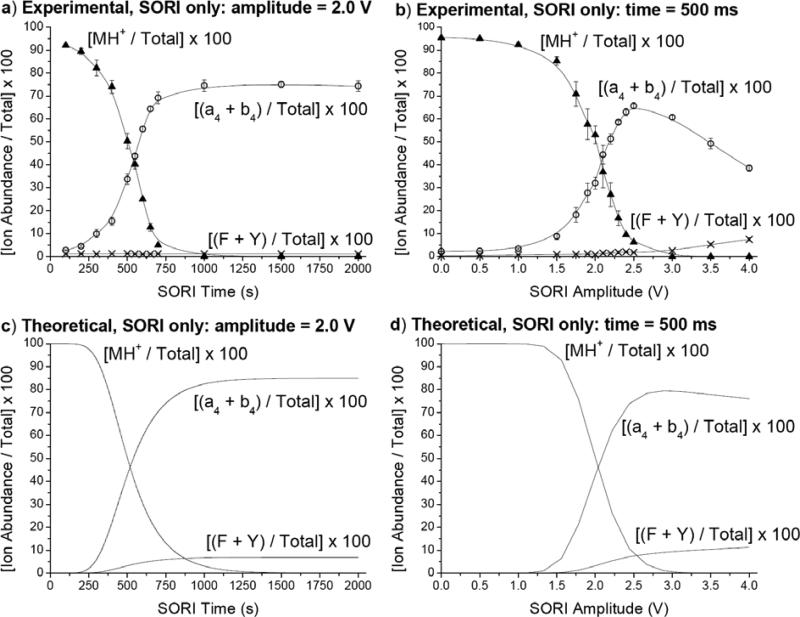
Systematic measurements have been performed to study the effect of SORI and RE excitation time and voltages. Figure 4 shows the experimental and theoretical relative ion abundances of the precursor ion, two low energy fragment ions (a4 + b4), and two high energy fragment ions (F + Y) when SORI is used in conjunction with argon as the collision gas to fragment the monoisotopically selected YGGFL(H+) precursor ion. When SORI amplitude is held constant at 2.0 V and time is varied from 50 - 2000 ms (Figure 4a), the precursor ion is almost completely depleted after 700 ms. The (a4 + b4) abundance levels off at approximately 75% of the total ion abundance after 700 ms. The (F + Y) abundance is insignificant and never rises above 1.3% of the total ion abundance. These results indicate that even though MH+ fragments completely, most of the fragmentation of the parent ion is occurring through low energy channels leading to the formation of the a4 and b4 ions. In Figure 4b, SORI time is held constant at 500 ms while SORI amplitude is varied from 0 - 4.0 V. Similar to the case in which SORI voltage is kept constant, the a4 and b4 ions are the most significant. However, increasing the SORI amplitude beyond 2.5 V results in a decline of the (a4 + b4) relative abundance as other fragment ions (i.e., b4 – NH3, b3, y2) gain in prominence. Also, the (F + Y) relative ion abundance is not insignificant in this case, but rather begins to increase after 3.0 V and reaches approximately 7% of the total ion abundance by 4.0 V. Therefore, as SORI amplitude is increased, more energy is deposited into the precursor ion leading to higher energy fragment ions. However, this is not extremely useful for the detection of higher energy fragment ions in this case because signal is rapidly lost as amplitude is increased beyond 4.0 V, presumably due to excitation of the precursor ion beyond the dimensions of the ICR cell.
Figure 4.
Experimental and theoretical relative ion abundances of the (a4 + b4), (F + Y) immonium, and MH+ ions resulting from the monoisotopic selection and fragmentation of YGGFL(H+) using argon as the collision gas: a) Experimental, SORI amplitude = 2.0 V, vary time b) Experimental, SORI time = 500 ms, vary amplitude c) Theoretical, SORI amplitude = 2.0 V, vary time d) Theoretical, SORI time = 500 ms, vary amplitude.
The dependence of SORI spectra on excitation time and on excitation amplitude has also been studied by theoretical (MassKinetics) modeling. Using the same parameters used to calculate the spectra shown in Figure 1d-e, time and excitation amplitude dependent ion ratios were also calculated, and the results are shown in Figure 4c-d. The survival yield of the precursor ion and the relative abundances of the a4 and b4 ions are good indications for increasing internal energy content, and these are in satisfactory agreement with the curves obtained experimentally (Figure 4a-b). The abundance of the high energy Y and F ions is somewhat higher in the calculated spectra than that observed experimentally, but the trend with increasing SORI time and increasing SORI amplitude is similar. This suggests that there is a general agreement of trends but not in absolute values of ion abundances between experimental and theoretical spectra. The “saturation-type” curve suggests that SORI itself is not capable of producing high energy ions in large abundance even if done for a long time or at a higher amplitude.
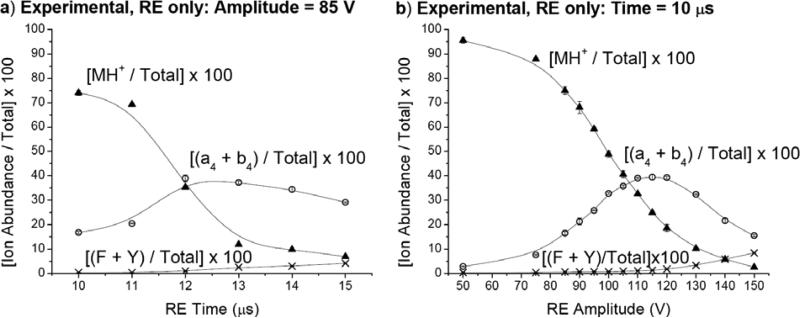
Systematic measurements have also been performed to examine the effect of RE amplitude and time. Figure 5a shows the relative abundances of the parent, (a4 + b4), and (F + Y) ions when RE amplitude is kept constant at 85 V and RE excitation time is varied from 10 – 15 μs. The precursor ion's signal steadily decreases and is <7% of the total ion abundance by 15 μs. The relative abundance of the (a4 + b4) ions reaches a maximum of approximately 40% around 12 μs and is less dominant than in the SORI spectra. By 15 μs, the abundance of the (F + Y) ions has risen to approximately 5% of the total ion abundance, but is not much more significant than in the SORI ion abundance curves (Figure 4a-b).
Figure 5.
Experimental relative ion abundances of the (a4 + b4), (F + Y) immonium, and MH+ ions resulting from the monoisotopic selection and fragmentation of YGGFL(H+) using argon as the collision gas: a) RE amplitude = 85 V, vary time b) RE time = 10 μs, vary amplitude.
In Figure 5b, RE time is held constant at 10 μs while RE amplitude is increased from 50-150 V. Spectral appearance is quite similar to the case in which RE amplitude is held constant and time varied. The precursor ion signal steadily decreases and is <3% of the total ion abundance at 150 V. The (F + Y) immonium ions reach a relative abundance of approximately 9% at 150 V. Also, the abundance of the (a4 + b4) ions first increases, reaches a maximum of approximately 40% at 115 V, and then declines to <16% by 150 V. It is likely that 10 μs RE pulses below 115 V are not energetic enough to allow the parent ion to extensively access higher energy fragmentation pathways, and so activation results mainly in the a4 and b4 ions. At 100 V, the parent ion relative abundance is still 50%. Beyond 115 V, higher fragmentation channels are accessible and the a4 and b4 ions decline in relative abundance as higher energy fragment ions become more dominant.
Leucine Enkephalin: Effect of SORI and RE time and amplitude on the ratios of the a4/b4 and b3/y2 ions
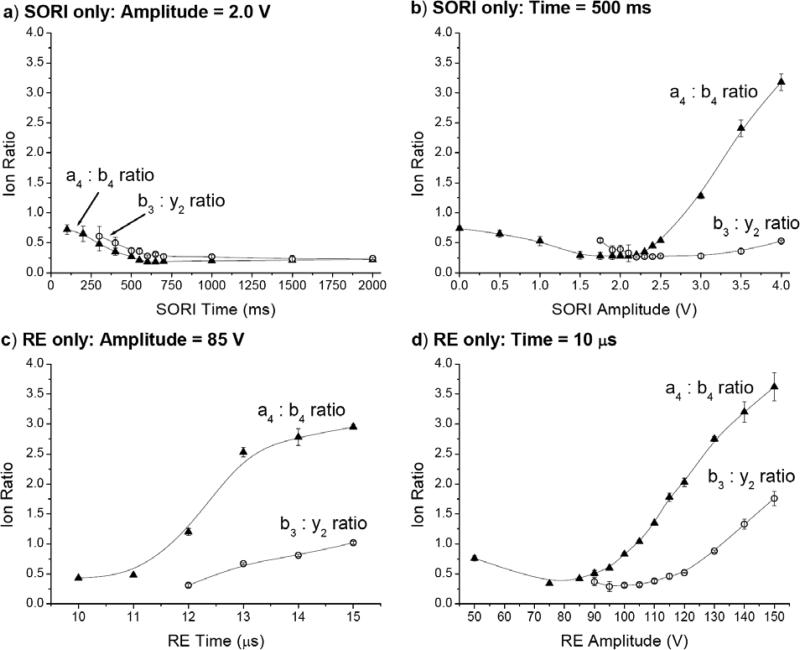
Figure 6 shows the ratios of a4/b4 and b3/y2 ions for SORI and RE activation. As mentioned earlier, a4 and b3 ions are considered as resulting from higher energy fragmentation channels than b4 and y2 ions, respectively. A ratio greater than one is therefore an indication of the fragment ion resulting from the higher energy channel occurring more frequently than the corresponding lower energy fragment ion. One notable feature of these plots is that for the case in which SORI voltage is held constant at 2.0 V and SORI time varied (Figure 6a), both a4/b4 and b3/y2 ratios are small, indicating low excitation. Therefore, increasing SORI time does not deposit greater amounts of internal energy but rather leads to the lower energy fragment ions because energy deposition occurs in small, sequential steps. In a similar manner to holding SORI amplitude constant, when SORI duration is held constant at 500 ms and amplitude varied from 0 - 4.0 V (Figure 6b), both ratios initially remain below one and increase as a function of amplitude. By 4.0 V, the a4/b4 ratio reaches 3.2 and the b3/y2 ratio reaches 0.5. Increasing SORI amplitude can clearly allow access to higher energy fragmentation channels as larger packets of energy are deposited into the parent ion. However, as discussed previously, increasing SORI amplitude high enough to observe intense fragment ions resulting from higher energy pathways leads to the rapid loss of signal due to excitation of the precursor ion beyond the dimensions of the ICR cell.
Figure 6.
Experimental ratios of a4/b4 and b3/y2 ions resulting from the monoisotopic selection and fragmentation of YGGFL(H+) using argon as the collision gas: a) SORI amplitude = 2.0 V, vary time b) SORI time = 500 ms, vary amplitude c) RE amplitude = 85 V, vary time d) RE time = 10 μs, vary amplitude.
Figure 6c-d shows the effect of on-resonant excitation of YGGFL(H+) on the a4/b4 and b3/y2 ratios. Whereas both ratios were, in general, below one for SORI activation, they are more often above one for RE. When RE amplitude is held constant at 85 V and time varied from 10 – 15 μs (Figure 6c), the a4/b4 and b3/y2 ratios are greater than one by 12 μs and 15 μs, respectively. When RE duration is held constant at 10 μs and amplitude increased from 50 – 150 V (Figure 6d), the a4/b4 ratio initially decreases slightly, but then steadily increases and reaches 3.6 at 150 V. The b3/y2 ratio reaches 1.8 at 150 V. This data demonstrates that, if excitation time and amplitude are large enough, RE alone is able to deposit larger amounts of energy at once than SORI alone, causing higher abundances of fragment ions that result from higher energy fragmentation channels.
2α-Mannobiose and 3α-Mannobiose: Comparison of SORI, RE and SORI-RE CID spectra
Common fragment ions resulting from the CID of oligosaccharides include cleavage at the glycosidic linkage and cross-ring cleavages. Cleavage at glycosidic linkages, in general, results from lower energy fragmentation pathways. The SORI, RE, and SORI-RE CID spectra for two simple lithium-cationized disaccharides differing only in the position of the glycosidic linkage, 2α-mannobiose and 3α-mannobiose, are shown in Figure 7. The surface-induced dissociation (SID) spectra of these disaccharides, along with 4α- and 6α-mannobiose, have been previously reported.61 In this study, Dongre et al. used the presence of specific cross-ring product ions to characterize the position of the glycosidic linkage.
Figure 7.
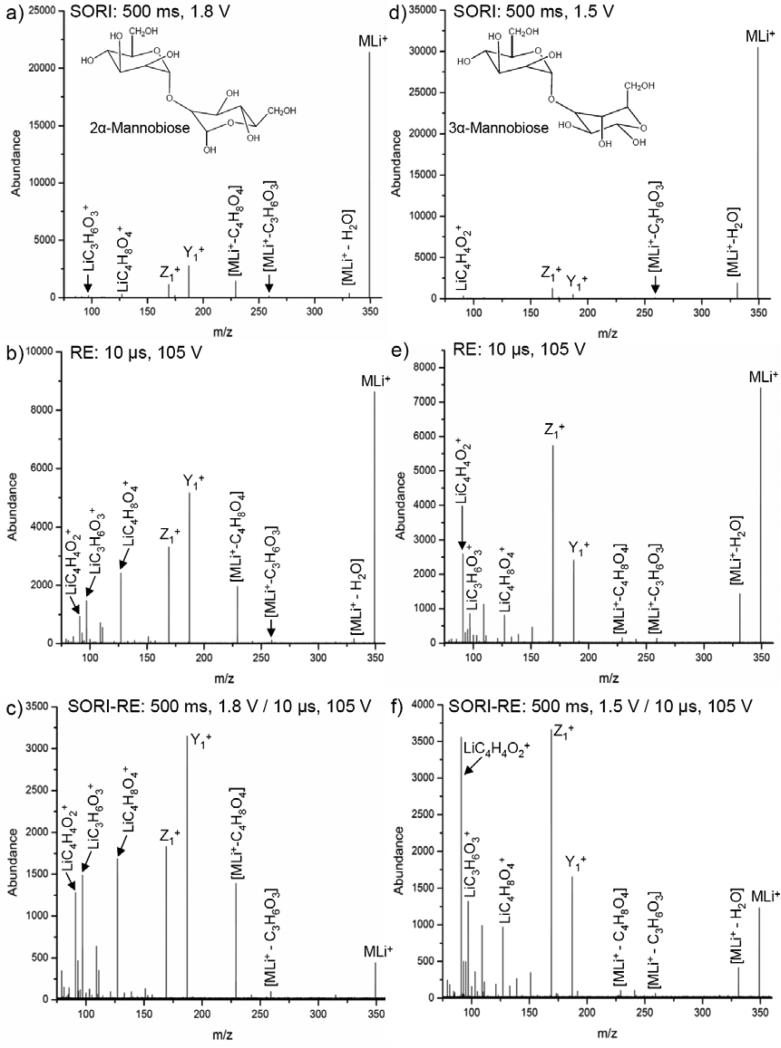
Experimental spectra for the monoisotopic selection and fragmentation of lithium-cationized 2α-mannobiose and 3α-mannobiose using argon as the collision gas (550 ms pulse): a) 2α-mannobiose, SORI: time = 500 ms, amplitude = 1.8 V b) 2α-mannobiose, RE: time = 10 μs, amplitude = 105 V c) 2α-mannobiose, SORI-RE: SORI time = 500 ms, amplitude = 1.8 V, 20 ms time gap, RE time = 10 μs, amplitude = 105 V d) 3α-mannobiose, SORI: time = 500 ms, amplitude = 1.5 V e) 3α-mannobiose, RE: time = 10 μs, amplitude = 105 V f) 3α-mannobiose, SORI-RE: SORI time = 500 ms, amplitude = 1.5 V, 20 ms time gap, RE time = 10 μs, amplitude = 105 V.
As shown in Figure 7, two fragment ions result from the cleavage of the glycosidic linkage, labeled Z1+ (m/z 169.1) and Y1+ (187.1). The Y1+ ion contains one of the hexose rings with the glycosidic linkage oxygen plus a hydrogen, while the Z1+ ion corresponds to the Y1+ ion by a formal loss of H2O. The 500 ms, 1.8 V SORI-CID spectrum of 2α-mannobiose is shown in Figure 7a. The most abundant fragment ions are Y1+, Z1+, and m/z 229.1. The ion at m/z 229.1 is the result of a cross-ring cleavage and corresponds to a loss of C4H8O4 from the precursor ion. This ion was used previously in the SID spectrum to characterize the position of the glycosidic linkage.61 Three additional ions at m/z 97.0 (LiC3H6O3+), m/z 127.1 (LiC4H8O4+), and m/z 259.1 (loss of C3H6O3 from precursor ion) also result from cross-ring cleavages and are present at low abundances. In Figure 7b, 2α-mannobiose is fragmented via a 10 μs, 105 V RE pulse. The Y1+ and Z1+ ions remain the most abundant. The cross-ring cleavage ion at m/z 127.1, which was of very low abundance in the SORI spectrum, is now more abundant than the cross-ring cleavage ion at m/z 229.1. A cross-ring cleavage ion at m/z 91.0 (LiC4H4O2+), absent in the SORI spectrum, is observed in the RE spectrum. Also, the abundance of the cross-ring cleavage ion at m/z 259.1 in the RE spectrum is very low and similar to the SORI spectrum. Figure 7c shows the result of applying the 10 μs, 105 V RE pulse 20 ms after the 500 ms, 1.8 V SORI pulse. In this spectrum, the cross-ring cleavage ion at m/z 127.1 is now almost as abundant as the Z1+ ion. Cross-ring cleavage ions at m/z 91.0 and m/z 97.0 are also enhanced. As in the SORI and RE spectra, the cross-ring cleavage ion at m/z 259.1 remains of low abundance relative to the other fragment ions discussed.
The SORI, RE, and SORI-RE CID for 3α-mannobiose results in the observation of the same fragment ions as for 2α-mannobiose, but in different relative abundances. In Figure 7d, the 500 ms, 1.5 V SORI spectrum is shown for 3α-mannobiose with argon as the collision gas. As expected, the glycosidic linkage cleavage ions, Y1+ and Z1+, are two of the most abundant fragment ions. However, unlike the SORI spectrum for 2α-mannbiose, the loss of H2O from the precursor ion is the most abundant fragment ion in the spectrum. Also, the Z1+ ion is more abundant than the Y1+ ion. The cross-ring cleavage ions at m/z 91.0 and m/z 259.1 are present at very low abundances, while the cross-ring cleavage ions at m/z 97.0, m/z 127.1, and m/z 229.1 are absent. Figure 7e shows the 10 μs, 105 V RE spectrum of 3α-mannobiose. While the Z1+ ion remains the most abundant fragment ion, the cross-ring cleavage ion at m/z 91.0 is more abundant than the Y1+ ion. The cross-ring cleavage ions at m/z 97.0, m/z 127.0, and m/z 229.1, absent in the SORI spectrum, are clearly observed. The 500 ms, 1.5V / 10μs, 105V SORI-RE CID spectrum of 3α-mannobiose is shown in Figure 7f. The cross-ring cleavage ion at m/z 91.0 is now almost as abundant as the Z1+ ion, and significantly more abundant than the Y1+ ion. The relative abundances of the cross-ring cleavage ions at m/z 91.0, m/z 97.0 and m/z 127.1 follow the trend: m/z 91.0 > m/z 97.0 > m/z 127.1. However, in the 2α-mannobiose SORI-RE spectrum, this trend is reversed with the relative abundances in the order: m/z 127.1 > m/z 97.0 > m/z 91.0. Also, the relative abundance of the cross-ring cleavage ions at m/z 229.1 and m/z 259.1 is low and shows no significant change in Figure 7f as compared to the RE spectrum in Figure 7e.
The comparison of the SORI, RE, and SORI-RE spectra for 2α-mannobiose and 3α-mannobiose demonstrates that the relative abundances of the glycosidic linkage and cross-ring cleavage ions change as the internal energy of the precursor ion is increased. In particular, some cross-ring cleavage ions become enhanced as compared to cleavage at the glycosidic linkage. However, the abundances of other cross-ring cleavage ions remain relatively unchanged. As also demonstrated for 2α-mannobiose and 3α-mannobiose, the location of the glycosidic linkage effects the relative abundances of different fragment ions observed, and these ion abundances show different amounts of enhancement as the internal energy of the precursor ion is increased. These differences may lead to insights into fragmentation mechanisms and relative energy requirements for fragmentation pathways.
Alditol XT: Comparison of SORI, RE and SORI-RE CID spectra
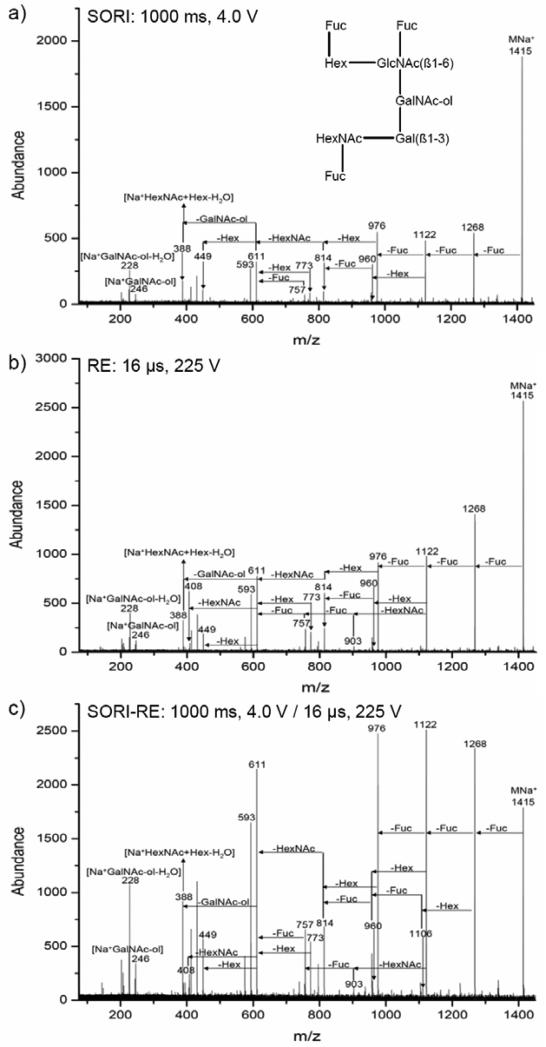
SORI, RE, and SORI-RE CID are demonstrated in Figure 8 for the sodiated ions of an oligosaccharide, alditol XT. The SORI-CID (MS2 and MS5, m/z 1415 / 1268.5 / 1122.4 / 976.3) and IRMPD spectra of this sodiated oligosaccharide have been previously reported by Lebrilla and co-workers.5 In their study, IRMPD was capable of producing low relative abundance lower mass fragment ions (i.e., m/z 228.1, 388.1, 408.1, 449.1, identified in Figure 8) that were observed with a slightly higher relative abundance but with a lower overall signal intensity during MS5. The authors also report that these fragment ions are observed using energetic SORI conditions during MS2, but that signal intensity and the abundance of the higher mass fragment ions are depleted. The loss of one, two, and three fucose units from the sodiated alditol XT (MNa+) ion results in fragment masses of m/z 1268.5, m/z 1122.4, and m/z 976.3, respectively. These are the most abundant fragment ions observed in the SORI, RE, and SORI-RE spectra in Figure 8. Other fragment ions resulting from the cleavage of multiple glycosidic linkages are identified in Figure 8. Figure 8a shows the 1000 ms, 4.0 V SORI spectrum with nitrogen as the collision gas. In this spectrum, the fragment ions resulting from the loss of one to three fucose rings are present at less than 30% relative abundance, while all other fragment ions are 20% relative abundance or less. In the 16 μs, 225 V RE spectrum shown in Figure 8b, the ions corresponding to the loss of one to three fucose rings are less than 50% relative abundance while all other fragment ions are less than 30% relative abundance. However, when the SORI and RE pulses are combined, as shown in Figure 8c, many fragment ions are present at a relative abundance of greater than 50% and the overall extent of fragmentation is much greater as compared to Figure 8a-b. It is important to note the extent of fragmentation observed in the SORI-RE spectrum shown in Figure 8c is not achieved, due to a loss of signal, even when SORI or RE alone is used with a longer and/or higher amplitude pulse. In addition, the extent of fragmentation observed with the SORI-RE technique is much greater than that reported by Lebrilla and co-workers for either SORI-CID (MS2 and MS5) or IRMPD.5 In this alditol XT example, SORI-RE provides an improvement in fragmentation efficiency and signal-to-noise ratio over SORI and RE alone, as well as the reported SORI-CID MS2 and MS5, and IRMPD spectra.5 .
Figure 8.
Monoisotopic selection and fragmentation of the Alditol XT + Na+ ion using nitrogen as the collision gas: a) SORI: time = 1000 ms, amplitude = 4.0 V b) RE: time = 16 μs, amplitude = 225 V c) SORI-RE: SORI time = 1000 ms, amplitude = 4.0 V, 20 ms time gap, RE time = 16 μs, amplitude = 225 V.
SORI, RE and SORI-RE CID fragmentation of [Ubiquitin + 10H+]10+
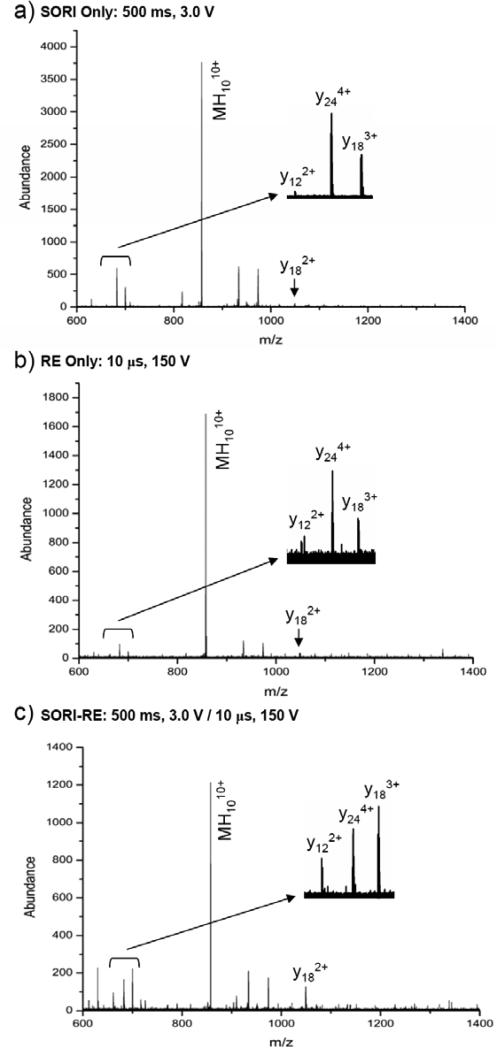
Figure 9a-c shows the SORI, RE and SORI-RE CID fragmentation spectra of ubiquitin with ten protons. Argon was used as the collision gas in these experiments. These spectra show some similarities to those obtained by BIRD by Williams and coworkers.62 By comparison of the SORI and SORI-RE spectra in Figure 9a,c it is seen that the y183+, y182+ 2+, and y12 ions are more abundant in the SORI-RE spectrum than in the SORI spectrum. This indicates that the amide bond cleavage between the amino acids Asp58-Tyr59 (y18n+) and Glu64-Ser65 (y122+) is more efficient when a RE pulse is applied after the SORI excitation. Furthermore, the ratio of y183+ / y244+ ions is greater than one in the SORI-RE spectrum, but less than one in the SORI and RE spectra. This result indicates that the amide bond cleavage at Asp58-Tyr59 (y18n+) increases relative to Asp52-Gly53 (y244+) at higher internal energies. We also note that the abundances of several ions in the m/z 1100-1400 region increase with increasing internal energy (i.e., in the SORI-RE spectrum relative to the SORI spectrum). Although the differences among the SORI, RE, and SORI-RE spectra do not allow us to directly derive mechanistic information, this information does provide insight into relative energy requirements for specific bond cleavages (i.e., y18 formation appears to have greater energy requirements than y24 formation).
Figure 9.
Fragmentation of the non-monoisotopically selected [Ubiquitin+10H+]10+ ion using argon as the collision gas: a) SORI: time = 500 ms, amplitude = 3.0 V b) RE: time = 10 μs, amplitude = 150 V c) SORI-RE: SORI time = 500 ms, amplitude = 3.0 V, 20 ms time gap, RE time = 10 μs, amplitude = 150 V.
SORI, RE and SORI-RE CID fragmentation of the singly charged uranyl cation (UO2+)
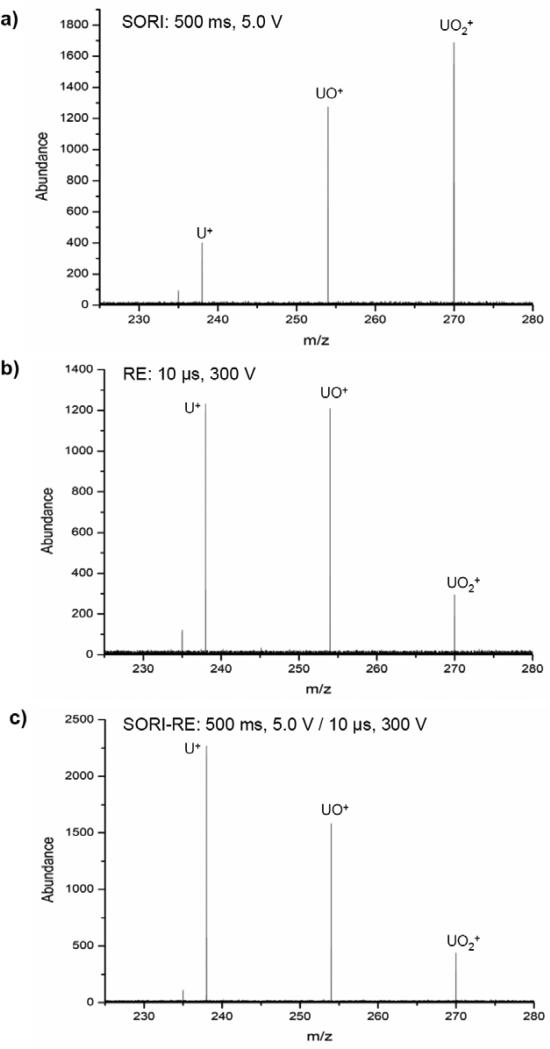
Finally, we show another example to demonstrate the changes in MS/MS spectra produced by SORI, RE, and their combination, SORI-RE. Figure 10a-c shows the SORI, RE and SORI-RE CID (Ar) fragmentation of the singly charged uranyl cation (UO2+, m/z 270.0). This is a stable cation that requires relatively high SORI amplitude to fragment. A 5.0 V SORI excitation amplitude was needed in order to observe the fragments UO+ (m/z 254.0) and U+ (m/z 238.1) with the abundances shown in Figure 9a. Note that the abundance of UO+ was always larger than that of U+ even at a higher SORI voltage (7 V) at which the parent ion was completely depleted (data not shown). The application of a 10 μs, 300 V RE pulse resulted in the same fragments but with different relative abundances (Figure 9b). This suggests that higher internal energy was deposited by the RE pulse than by the SORI pulse. This energy deposition can be further increased when the SORI pulse is followed by the RE pulse (Figure 9c) as indicated by the reverse U+/UO+ (> 1) abundance ratio.
Figure 10.
Fragmentation of the singly charged uranyl cation (UO2+) using argon as the collision gas: a) SORI: time = 500 ms, amplitude = 5.0 V b) RE: time = 10 μs, amplitude = 300 V c) SORI-RE: SORI time = 500 ms, amplitude = 5.0 V, 20 ms time gap, RE time = 10 μs, amplitude = 300 V.
V. Conclusions
SORI-RE CID is an excitation method for FT-ICR based on a combination of SORI and resonant excitation. The purpose is to enhance the efficiency of higher energy fragmentation while maintaining low energy processes. In addition, relative energy requirements of fragmentation mechanisms may be studied with this method. This concept is similar to the pump-probe experiments used to study fundamentals of collision energy transfer in FT-ICR.40 SORI is applied initially to pump energy in small steps into the molecule until a portion of the precursor ions dissociate while the remaining precursor ions maintain an internal energy below the fragmentation threshold. For large molecules (i.e., greater than 10 kDa) this fragmentation threshold may be far higher than the activation energy. Shorty following the SORI pulse (20 ms gap), a RE pulse is applied which increases the internal energy of the remaining activated but undissociated precursor ions significantly above the fragmentation threshold by also pumping energy into the activated molecules, but in a larger step. As demonstrated in Figure 3, this makes it possible to raise the internal energy much higher than would be possible by SORI alone. Utilizing RE only, especially for large molecules, would not be efficient because all or most of the large energy step would be ‘wasted’ to heat up the molecule from thermal energy to the fragmentation threshold. These theoretical expectations are supported by the experimental results, as described above. Illustrative SORI-RE CID fragmentation examples include the observation of high energy immonium ions in large quantities for leucine enkephalin (Figure 1c) and the enhancement of cross-ring cleavages for 2α-mannobiose and 3α-mannobiose (Figure 7c,f). It is important to note that different fragment ions observed may be due to higher energy fragmentation as well as the conversion of heterogeneous populations to different protonated forms and/or conformations. The inter-conversion of heterogeneous forms as it relates to the relative abundance of different fragment ions may also be mechanistically interesting.
One of the most important advantages of SORI-RE is its simplicity. It does not require hardware of software modification on existing FT-ICR instruments, and method optimization is very simple. The best results are obtained with a SORI precursor ion survival yield of approximately 40-90%, and can be adjusted by varying either SORI excitation amplitude or excitation time. The RE pulse is applied shortly following SORI (i.e., 20 ms gap as required by the hardware) with the collision gas still in the cell. The amplitude and duration of the RE pulse should be chosen so that a significant amount of fragmentation is observed without signal extinction. It is most efficient to determine the RE pulse amplitude at which the signal begins to be depleted, and then use approximately 80% of that amplitude for the resonant excitation step of SORI-RE. The SORI-RE technique is also quite robust: using a standard setup, typically both low and higher energy fragments are observed. In our experience, time-consuming experiment optimization is usually NOT required. Adding a ‘standard’ RE pulse after the SORI cycle has a high probability of improving the spectra.
The results discussed in the paper serve to illustrate the usefulness of SORI-RE in diverse cases: peptides (leucine enkephalin, an extensively studied model peptide), disaccharides with differing glycosidic linkages (2α-mannobiose and 3α-mannobiose), oligosaccharides (Alditol XT), proteins (ubiquitin), and inorganic ions (UO2+). In each studied case SORI-RE, compared to simple SORI, has been shown produce more efficient fragmentation and to enhance higher energy fragmentation processes.
Acknowledgements
This research was supported by NIH grant R01 GM051387 to V.H. Wysocki. This work was also supported by the Hungarian Research Fund (OTKA) No. T 043538 and the QLK2-CT-2002-90436 project of the European Union for Center of Excellence in Biomolecular Chemistry. The authors thank the Carlito Lebrilla research group at the University of California, Davis for providing the alditol XT sample.
References
- 1.Amster IJ. Journal of Mass Spectrometry. 1996;31:1325–1337. [Google Scholar]
- 2.Hakansson K, Cooper HJ, Hudgins RR, Nilsson CL. Current Organic Chemistry. 2003;7:1503–1525. [Google Scholar]
- 3.Karas M, Hillenkamp F. Analytical Chemistry. 1988;60:2299–2301. doi: 10.1021/ac00171a028. [DOI] [PubMed] [Google Scholar]
- 4.Fenn JB, Mann M, Meng CK, Wong SF, Whitehouse CM. Science. 1989;246:64–71. doi: 10.1126/science.2675315. [DOI] [PubMed] [Google Scholar]
- 5.Zhang JH, Schubothe K, Li BS, Russell S, Lebrilla CB. Analytical Chemistry. 2005;77:208–214. doi: 10.1021/ac0489824. [DOI] [PubMed] [Google Scholar]
- 6.Woodin RL, Bomse DS, Beauchamp JL. Journal of the American Chemical Society. 1978;100:3248–3250. [Google Scholar]
- 7.Little DP, Speir JP, Senko MW, Oconnor PB, McLafferty FW. Analytical Chemistry. 1994;66:2809–2815. doi: 10.1021/ac00090a004. [DOI] [PubMed] [Google Scholar]
- 8.Dunbar RC, McMahon TB. Science. 1998;279:194–197. [Google Scholar]
- 9.Price WD, Schnier PD, Williams ER. Analytical Chemistry. 1996;68:859–866. doi: 10.1021/ac951038a. [DOI] [PubMed] [Google Scholar]
- 10.Senko MW, Speir JP, McLafferty FW. Analytical Chemistry. 1994;66:2801–2808. doi: 10.1021/ac00090a003. [DOI] [PubMed] [Google Scholar]
- 11.Gauthier JW, Trautman TR, Jacobson DB. Analytica Chimica Acta. 1991;246:211–225. [Google Scholar]
- 12.Cody RB, Burnier RC, Cassady CJ, Freiser BS. Analytical Chemistry. 1982;54:2225–2228. [Google Scholar]
- 13.Cody RB, Freiser BS. Analytical Chemistry. 1982;54:1431–1433. [Google Scholar]
- 14.Cody RB, Burnier RC, Freiser BS. Analytical Chemistry. 1982;54:96–101. [Google Scholar]
- 15.McLafferty FW, Horn DM, Breuker K, Ge Y, Lewis MA, Cerda B, Zubarev RA, Carpenter BK. Journal of the American Society for Mass Spectrometry. 2001;12:245–249. doi: 10.1016/S1044-0305(00)00223-3. [DOI] [PubMed] [Google Scholar]
- 16.Zubarev RA, Horn DM, Fridriksson EK, Kelleher NL, Kruger NA, Lewis MA, Carpenter BK, McLafferty FW. Analytical Chemistry. 2000;72:563–573. doi: 10.1021/ac990811p. [DOI] [PubMed] [Google Scholar]
- 17.Zubarev RA, Kelleher NL, McLafferty FW. Journal of the American Chemical Society. 1998;120:3265–3266. [Google Scholar]
- 18.Laskin J, Denisov E, Futrell JH. International Journal of Mass Spectrometry. 2002;219:189–201. [Google Scholar]
- 19.Chorush RA, Little DP, Beu SC, Wood TD, McLafferty FW. Analytical Chemistry. 1995;67:1042–1046. doi: 10.1021/ac00102a004. [DOI] [PubMed] [Google Scholar]
- 20.Budnik BA, Haselmann KF, Zubarev RA. Chemical Physics Letters. 2001;342:299–302. [Google Scholar]
- 21.Williams ER, Furlong JJP, McLafferty FW. Journal of the American Society for Mass Spectrometry. 1990;1:288–294. doi: 10.1016/1044-0305(90)85003-5. [DOI] [PubMed] [Google Scholar]
- 22.Hunt DF, Shabanowitz J, Yates JR. Journal of the Chemical Society-Chemical Communications. 1987:548–550. [Google Scholar]
- 23.Bowers WD, Delbert SS, McIver RT. Analytical Chemistry. 1986;58:969–972. doi: 10.1021/ac00295a066. [DOI] [PubMed] [Google Scholar]
- 24.Beaucham Jl. Annual Review of Physical Chemistry. 1971;22:527–561. doi: 10.1146/annurev.pc.22.100171.000245. [DOI] [PubMed] [Google Scholar]
- 25.McLuckey SA, Goeringer DE. Journal of Mass Spectrometry. 1997;32:461–474. [Google Scholar]
- 26.Grosshans PB, Marshall AG. International Journal of Mass Spectrometry and Ion Processes. 1990;100:347–379. [Google Scholar]
- 27.Guan SH, Marshall AG, Wahl MC. Analytical Chemistry. 1994;66:1363–1367. doi: 10.1021/ac00080a024. [DOI] [PubMed] [Google Scholar]
- 28.Breci LA, Tabb DL, Yates JR, Wysocki VH. Analytical Chemistry. 2003;75:1963–1971. doi: 10.1021/ac026359i. [DOI] [PubMed] [Google Scholar]
- 29.Huang YY, Wysocki VH, Tabb DL, Yates JR. International Journal of Mass Spectrometry. 2002;219:233–244. [Google Scholar]
- 30.Grewal RN, El Aribi H, Harrison AG, Siu KWM, Hopkinson AC. Journal of Physical Chemistry B. 2004;108:4899–4908. [Google Scholar]
- 31.Gu CG, Tsaprailis G, Breci L, Wysocki VH. Analytical Chemistry. 2000;72:5804–5813. doi: 10.1021/ac000555c. [DOI] [PubMed] [Google Scholar]
- 32.Tsaprailis G, Somogyi A, Nikolaev EN, Wysocki VH. International Journal of Mass Spectrometry. 2000;196:467–479. [Google Scholar]
- 33.Wattenberg A, Organ AJ, Schneider K, Tyldesley R, Bordoli R, Bateman RH. Journal of the American Society for Mass Spectrometry. 2002;13:772–783. doi: 10.1016/S1044-0305(02)00414-2. [DOI] [PubMed] [Google Scholar]
- 34.Leymarie N, Berg EA, McComb ME, O'Connor PB, Grogan J, Oppenheim FG, Costello CE. Analytical Chemistry. 2002;74:4124–4132. doi: 10.1021/ac0255835. [DOI] [PubMed] [Google Scholar]
- 35.Yu W, Vath JE, Huberty MC, Martin SA. Analytical Chemistry. 1993;65:3015–3023. doi: 10.1021/ac00069a014. [DOI] [PubMed] [Google Scholar]
- 36.Qin J, Chait BT. Journal of the American Chemical Society. 1995;117:5411–5412. [Google Scholar]
- 37.Frietas M, Hendrickson CL, Emmett MR, Marshall AG. Journal of the American Society for Mass Spectrometry. 1998;9:1012–1019. doi: 10.1016/S1044-0305(97)00287-0. [DOI] [PubMed] [Google Scholar]
- 38.Valentine SJ, Clemmer DE. Journal of the American Chemical Society. 1997;119:3558–3566. [Google Scholar]
- 39.Herrmann KA, Wysocki VH, Vorpagel ER. Journal of the American Society for Mass Spectrometry. 2005;16:1067–1080. doi: 10.1016/j.jasms.2005.03.028. [DOI] [PubMed] [Google Scholar]
- 40.Heeren RMA, Vekey K. Rapid Communications in Mass Spectrometry. 1998;12:1175–1181. [Google Scholar]
- 41.Drahos L, Vekey K. MassKinetics. 2001 doi: 10.1002/jms.142. www.chemres.hu/ms/masskinetics. [DOI] [PubMed]
- 42.Drahos L, Vekey K. Journal of Mass Spectrometry. 2001;36:237–263. doi: 10.1002/jms.142. [DOI] [PubMed] [Google Scholar]
- 43.Paizs B, Suhai S. Mass Spectrometry Reviews. 2005;24:508–548. doi: 10.1002/mas.20024. [DOI] [PubMed] [Google Scholar]
- 44.Schnier PD, Price WD, Strittmatter EF, Williams ER. Journal of the American Society for Mass Spectrometry. 1997;8:771–780. doi: 10.1016/S1044-0305(97)84129-3. [DOI] [PMC free article] [PubMed] [Google Scholar]
- 45.Biemann K. 1988;16:99. doi: 10.1002/bms.1200160119. [DOI] [PubMed] [Google Scholar]
- 46.Farrugia JM, O'Hair RAJ, Reid GE. International Journal of Mass Spectrometry. 2001;210:71–87. [Google Scholar]
- 47.Ambihapathy K, Yalcin T, Leung HW, Harrison AG. Journal of Mass Spectrometry. 1997;32:209–215. [Google Scholar]
- 48.Yalcin T, Csizmadia IG, Peterson MR, Harrison AG. Journal of the American Society for Mass Spectrometry. 1996;7:233–242. doi: 10.1016/1044-0305(95)00677-X. [DOI] [PubMed] [Google Scholar]
- 49.Yalcin T, Khouw C, Csizmadia IG, Peterson MR, Harrison AG. Journal of the American Society for Mass Spectrometry. 1995;6:1165–1174. doi: 10.1016/1044-0305(95)00569-2. [DOI] [PubMed] [Google Scholar]
- 50.Thibault P, Alexander AJ, Boyd RK, Tomer KB. Journal of the American Society for Mass Spectrometry. 1993;4:845–854. doi: 10.1016/1044-0305(93)87002-T. [DOI] [PubMed] [Google Scholar]
- 51.Vachet RW, Glish GL. Journal of the American Society for Mass Spectrometry. 1996;7:1194–1202. doi: 10.1016/S1044-0305(96)00109-2. [DOI] [PubMed] [Google Scholar]
- 52.Alexander AJ, Boyd RK. International Journal of Mass Spectrometry and Ion Processes. 1989;90:211–240. [Google Scholar]
- 53.Falick AM, Hines WM, Medzihradszky KF, Baldwin MA, Gibson BW. Journal of the American Society for Mass Spectrometry. 1993;4:882–893. doi: 10.1016/1044-0305(93)87006-X. [DOI] [PubMed] [Google Scholar]
- 54.Biemann K. Methods in Enzymology. 1990;193:455–479. doi: 10.1016/0076-6879(90)93433-l. [DOI] [PubMed] [Google Scholar]
- 55.Madden T, Welham KJ, Baldwin MA. Organic Mass Spectrometry. 1991;26:443–446. [Google Scholar]
- 56.Johnson RS, Biemann K. Biomedical and Environmental Mass Spectrometry. 1989;18:945–957. doi: 10.1002/bms.1200181102. [DOI] [PubMed] [Google Scholar]
- 57.Biemann K, Scoble HA. Science. 1987;237:992–998. doi: 10.1126/science.3303336. [DOI] [PubMed] [Google Scholar]
- 58.Biemann K, Martin SA. Mass Spectrometry Reviews. 1987;6:1–75. [Google Scholar]
- 59.Lippstreufisher DL, Gross ML. Analytical Chemistry. 1985;57:1174–1180. [Google Scholar]
- 60.Vachet RW, Bishop BM, Erickson BW, Glish GL. Journal of the American Chemical Society. 1997;119:5481–5488. [Google Scholar]
- 61.Dongre AR, Wysocki VH. Organic Mass Spectrometry. 1994;29:700–702. [Google Scholar]
- 62.Jockusch RA, Schnier PD, Price WD, Strittmatter EF, Demirev PA, Williams ER. Analytical Chemistry. 1997;69:1119–1126. doi: 10.1021/ac960804q. [DOI] [PMC free article] [PubMed] [Google Scholar]


