

Abstract
Glycogen synthase kinase 3 (GSK‐3) has been linked to regulation of kinesin‐dependent axonal transport in squid and flies, and to indirect regulation of cytoplasmic dynein. We have now found evidence for direct regulation of dynein by mammalian GSK‐3β in both neurons and non‐neuronal cells. GSK‐3β coprecipitates with and phosphorylates mammalian dynein. Phosphorylation of dynein intermediate chain (IC) reduces its interaction with Ndel1, a protein that contributes to dynein force generation. Two conserved residues, S87/T88 in IC‐1B and S88/T89 in IC‐2C, have been identified as GSK‐3 targets by both mass spectrometry and site‐directed mutagenesis. These sites are within an Ndel1‐binding domain, and mutation of both sites alters the interaction of IC's with Ndel1. Dynein motility is stimulated by (i) pharmacological and genetic inhibition of GSK‐3β, (ii) an insulin‐sensitizing agent (rosiglitazone) and (iii) manipulating an insulin response pathway that leads to GSK‐3β inactivation. Thus, our study connects a well‐characterized insulin‐signaling pathway directly to dynein stimulation via GSK‐3 inhibition.
Keywords: axon transport, centrosome, cytoplasmic dynein, insulin, Ndel1/Nde1, retrograde transport
Two types of processive motors transport cargo along microtubules in animal cells. Kinesins are mainly plus end directed, and cytoplasmic dynein is the primary motor for minus end‐directed transport. Defective dynein‐dependent transport may contribute to neurological diseases, cancer and diabetes 1, 2, 3, 4. Our interest is in elucidating the signaling pathways triggered by extracellular signals to regulate cytoplasmic dynein motility. While understanding how dynein is regulated has been a goal of many laboratories over the years, the focus has been mainly on understanding basic mechanisms of regulating ATP‐dependent processivity 5, 6, 7 and elucidating how motors ‘select’ specific cargo 8. These areas are interrelated, at least in mammalian dynein, which is not motile unless it is associated with cargo or components of cargo adaptor complexes 9, 10, 11. There is growing evidence that transport requires the coordination between multiple motors on individual cargo 12, and dynein regulatory proteins such as Ndel1 (or its homolog, Nde1), Lis1, dynactin and BICD work cooperatively to regulate force production 7. Ndel1 and Lis1 contribute to dynein‐dependent transport of at least some cargo in mammalian axons 13, 14. Dynein itself is ferried to microtubule plus ends by kinesin 15, 16. At plus ends, dynein may be non‐motile, but poised for activation. The sheer diversity of dynein cargos, coupled with the multitude of potential subcellular destinations, suggests that mechanisms must be in place to regulate the timing and whereabouts of motor activation by extracellular cues.
Some progress has been made in demonstrating a link between extracellular signaling and dynein‐dependent transport in neurons. Neurotrophins acting on receptors in growth cones or synapses stimulate the dynein‐dependent transport of signaling endosomes carrying survival signals to the cell body 17. Similarly, calcium entry after nerve injury triggers the dynein‐dependent transport of an injury signal to cell bodies 18. More recently, a role for glycogen synthase kinase (GSK‐3) in kinesin‐dependent axonal transport in Drosophila larval segmental nerves and squid axoplasm has been demonstrated 19, 20, 21. This suggests that pathways regulating GSK‐3 have the potential to regulate motors. However, these reports point to some degree of species and organelle variability, and are inconclusive regarding possible dynein regulation by GSK‐3. Moreover, the previous studies do not address a role in axon transport in mammalian species, nor do they measure effects on transport in non‐neuronal cells. Our study now adds significantly to the understanding of dynein regulation by demonstrating that a well‐characterized insulin pathway stimulates dynein via GSK‐3 inhibition in mammalian systems, both in axons and non‐neuronal cells. Increasing insulin signaling or directly inhibiting GSK‐3 activates dynein motility. Moreover, GSK‐3β directly phosphorylates dynein, and this negatively affects its interaction with Ndel1, suggesting a mechanism by which the kinase inhibits dynein‐dependent transport.
Results
Inhibition of GSK‐3 stimulates retrograde transport of acidic organelles in mammalian axons
To ascertain whether dynein‐dependent transport is influenced by GSK‐3 in mammalian axons, we examined organelle transport in axons of adult dorsal root ganglion (DRG) neurons, which can extend many hundreds of microns in culture. These processes have uniformly polarized microtubules with minus ends oriented toward the cell body 22. We used Lysotracker dye to visualize axon transport of acidic organelles because this was extensively characterized in a previous study from our laboratory 14. In that study, we calculated the percentage of organelles that fell into each of the four groups: (i) organelles that moved only anterogradely toward the growth cone, (ii) those that moved only retrogradely toward the cell body, (iii) those that switched directions and (iv) organelles that remained static during the entire recording interval 14. A large percentage of acidic organelles moved retrogradely, and interfering with dynein, Lis1 or Ndel1 produced more static organelles at the expense of retrogradely moving organelles.
In this study, DRG neurons were exposed to the specific GSK‐3 inhibitor CT990221, or LiCl, a less specific inhibitor, but one that is in clinical use for psychiatric disorders 23, 24. These inhibitors block the activity of both GSK‐3α and GSK‐3β. The drugs were allowed to remain on the cells for 12 h and remained present during subsequent time‐lapse imaging of axonal organelles in 100 µm segments of 11–30 axons for each condition. Figure 1A,B shows representative kymographs from dimethyl sulfoxide (DMSO)‐ and CT99021‐treated axons. The absolute number of organelles analyzed for each condition ranged from 160 to 429. Reducing GSK‐3 activity increased transport, causing a shift toward more retrogradely moving organelles relative to static organelles, and had little if any effect on anterograde trafficking (Figure 1C–F). These experiments demonstrate that GSK‐3 can influence retrograde transport in mammalian axons.
Figure 1.
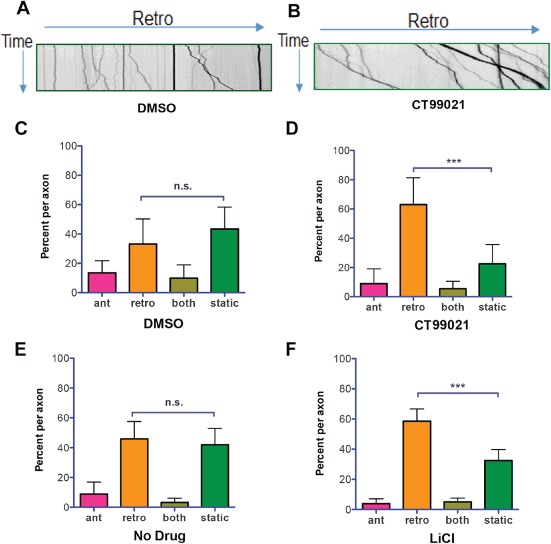
Inhibition of GSK‐3β stimulates retrograde transport in adult rat DRG neurons. Time‐lapse movies of Lysotracker‐labeled organelles moving in living DRG axons exposed to GSK‐3 inhibitors were converted to kymographs using NIH image J software. A and B) Representative kymographs for axons exposed to DMSO or CT99021 for 12 h are shown. The horizontal arrow indicates the retrograde direction (toward the cell body for the 100‐µm axon segment). The vertical arrow indicates time (2‐min total recording time). Sixteen axons in cultures from two different rats were analyzed for each condition. Organelle movement was categorized as anterograde (ant), retrograde (retro), both or static and the average percentage of organelles per axon in each category was determined. C and D) A significantly higher percentage of organelles moved retrogradely, and fewer were static following CT99021 exposure (mean ± 95% CI, n.s., p > 0.05, ***p < 0.0001, one‐way anova). E and F) Similar results were obtained with LiCl (mean ± 95% CI, n.s., p > 0.05, ***p < 0.0001, one‐way anova).
Cytoplasmic dynein interacts with GSK‐3β in vivo and is phosphorylated by GSK‐3β in vitro
Several observations support the possibility that dynein is directly targeted by GSK‐3β. First, GSK‐3β coprecipitated with adult mouse brain dynein indicating that these proteins can exist in a complex in vivo (Figure 2A). Although the amount of coprecipitated GSK‐3 is not extensive, this is reasonable given the potentially transient and spatially restricted nature of kinase‐substrate reactions. Second, phosphate was detected in purified bovine brain dynein after exposure to human glutathione S‐transferase (GST)‐tagged GSK‐3β (Figure 2B, left panel). Three dynein subunits incorporated γ‐32P‐ATP (heavy chains, HCs; intermediate chains, ICs; light intermediate chains, LICs). A labeled band apparent in the ‘no dynein’ sample was likely auto‐phosphorylated GSK‐3β which has been described by others 25. This was confirmed using a histidine‐tagged GSK‐3β (Figure 2B, right panels). Although the phosphorylation of HC and LIC is interesting and worth pursuing in the future, for this study, we chose to focus our attention on ICs because they interact directly with several regulatory proteins including Ndel1 26, which has been studied in our laboratory for many years 14, 27, 28.
Figure 2.
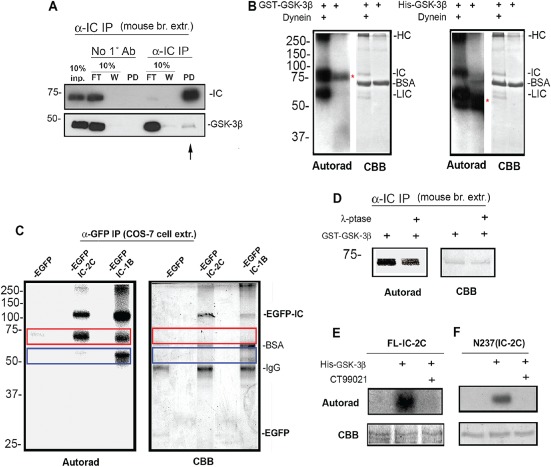
Direct phosphorylation of dynein by GSK‐3β. A) Cytoplasmic dynein was immunoprecipitated from mouse brain using an IC antibody (α‐IC IP). A No 1° antibody pulldown served as a control. GSK‐3β was specifically pulled down by dynein (arrow). FT = 10% of flow through, W = 10% of first wash, PD = pull down. B) Purified bovine dynein was incubated with GST‐GSK‐3β (left panel) or His‐GSK‐3β (right panel). HC, IC and LIC subunits were phosphorylated. Auto‐phosphorylated GST‐GSK‐3β (∼73 kDa) and His‐GSK‐3β (∼48 kDa) were also detected (red asterisks). C) An anti‐GFP antibody was used to isolate EGFP‐IC‐2C and EGFP‐IC‐1B expressed in Cos‐7 cells. Both proteins were phosphorylated by GSK‐3β. The phosphorylated bands in the red box are likely endogenous ICs in the complex. Bands in the blue box may be endogenous LICs interacting with IC‐1B. D) Mouse brain ICs that had been stripped of endogenous phosphates by lambda phosphatase could still be phosphorylated by GSK‐3β, indicating that one or more sites do not require priming. E and F) Bacterially expressed full‐length His‐tagged IC‐2C (FL‐IC‐2C) and an N‐terminal fragment (N237 IC‐2C) were phosphorylated by GSK‐3β in vitro and phosphorylation was blocked by the specific GSK‐3β inhibitor, CT990221, confirming the presence of sites that do not require priming phosphorylation.
Mammalian ICs are encoded by two genes, DYNC1I1 and DYNC1I2, that share about 70% protein identity 29. Both are highly conserved among mammalian species. We will refer to the proteins as IC‐1 and IC‐2. Each has a number of splice variants. For much of the work described here, we used the IC‐2C isoform, which is fairly ubiquitous, and the IC‐1B isoform, which plays a prominent role in axon transport in neurons 29, 30. To examine which of the two ICs are phosphorylated by GSK‐3β, enhanced green fluorescent protein (EGFP)‐tagged rat IC‐1B and mouse IC‐2C expressed in Cos‐7 cells and immunoprecipitated with a green fluorescent protein (GFP) antibody were tested in an in vitro kinase assay. Both ICs were phosphorylated by GSK‐3β, but IC‐1B appeared to be a better substrate (Figure 2C). Interestingly, bands of the size of HC and untagged IC were present and phosphorylated, indicating that EGFP‐ICs can interact with endogenous dynein. A phosphorylated band that could be LIC was detected in the EGFP‐IC‐1B IP, but not in the EGFP‐IC‐2C IP.
Some GSK‐3β substrates require a priming phosphorylation at a serine or threonine residue four amino acids C‐terminal to the GSK‐3β target residue (S/TXXXS/Tp) 31. Other substrates do not require priming. In the latter case, the target S/T is often followed by a proline. These mammalian IC proteins contain between 9 and 11 potential priming consensus sites and 8–10 S/TP sites, depending on the species (bovine sequences are shown in Figure S1A,B). Several sites are located in the N‐termini, which contain binding domains for regulatory proteins, including Ndel1 32, 33. Potential sites in the bovine LIC1 and LIC2 and in the human HC sequence are also shown (Figures S1C,D and S2). Two experiments indicate that one or more sites in IC do not require a priming phosphorylation. First, phosphates were ‘stripped’ from immobilized mouse brain dynein by incubation with λ‐phosphatase. After extensive washing to remove residual phosphatase, a GSK‐3β kinase assay was performed. Some phosphorylation occurred even after stripping, indicating that the endogenous phosphates are not required for phosphorylation by GSK‐3β (Figure 2D). Second, bacterially expressed full‐length IC‐2C or an N‐terminal fragment of mouse IC‐2C (N237), which are unlikely to have any priming phosphorylation, were also phosphorylated by GSK‐3β (Figure 2E,F).
Two conserved residues in the amino terminus of both IC‐2C and IC‐1B are phosphorylated by GSK‐3β
In order to identify N‐terminal phosphorylation sites in dynein ICs, mass spectrometry (MS) of phosphorylated and un‐phosphorylated N237 were compared (Figures 3A–C and S3A). Three phosphorylated residues were identified, S88, T89, and T154. T154 is not present in human IC‐2C or IC‐1B, so we focused our attention on S88 and T89, both of which are highly conserved and also present in IC‐1B (Figure 3D). In order to examine phosphorylation of S88/T89 more specifically, we used a shorter peptide, mouse N106, which does not contain T154. Wild‐type (WT) N106 was phosphorylated by GSK‐3β in vitro, and a non‐phosphorylatable mutant (S88A/T89V) largely prevented phosphate incorporation (Figure 3E). That these sites are targeted was further confirmed by site‐directed mutations in full‐length EGFP‐IC‐2C (Figure 3F). Interestingly, S88 and T89 are located within the reported binding domain for Ndel1 (Figure 3G). We next examined full‐length rat EGFP‐IC‐1B exposed to GSK‐3β in vitro. Analysis of the MS/MS spectra identified S87 and T88 as phosphorylated sites (Figures 4A, B and S3B). A non‐phosphorylatable mutant of EGFP‐IC‐1B (S87A/T88V) reduced phosphate incorporation in a GSK‐3β kinase assay (Figure 4C). In both IC‐2C and IC‐1B MS/MS spectral analyses, no phosphopeptide was detected having both residues phosphorylated. This suggests that phosphorylation of either residue hinders phosphorylation of the adjacent residue. S87/T88 was also identified as phosphorylated when ICs immunoprecipitated from mouse brain extract were exposed to GSK‐3β (not shown).
Figure 3.
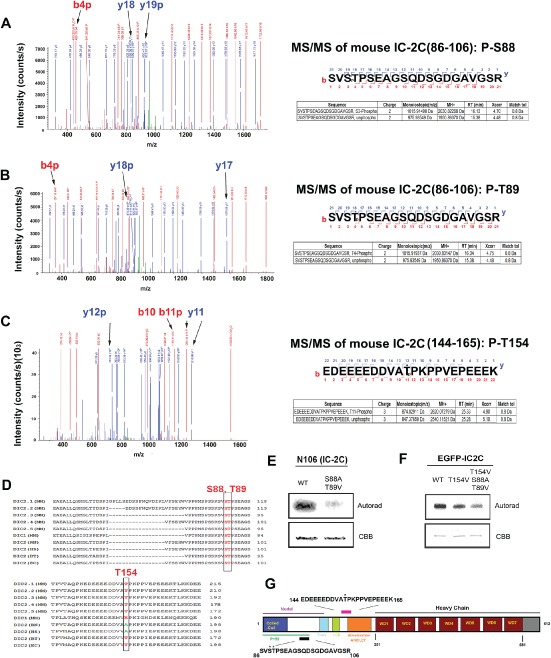
Identification of GSK‐3β‐targeted residues in mouse IC‐2C . A–C) CID‐based LC/MS/MS analyses of phosphorylation in a 237 amino acid, N‐terminal fragment of IC‐2C. A) An MS/MS spectrum of a phosphorylated peptide (SVS*TPSEAGSQDSGDGAVGSR) was acquired on a doubly charged ion at m/z 1015.9. The precursor mass (2030.82268 Da) is consistent with one phosphate in the peptide. MS/MS fragmentation of this peptide indicates a single phosphorylation of fragments y19 and b4, thus placing the modification unambiguously on S3, corresponding to S88 in IC‐2C. Furthermore, MS/MS fragmentation eliminates all five C‐terminal S/T sites (T4, S6, S10, S13 and S20) by showing that y3–y18 fragments are not phosphorylated. B) Another MS/MS spectrum of a phosphorylated peptide (SVST*PSEAGSQDSGDGAVGSR) was acquired on a doubly charged ion at m/z 1015.9. MS/MS fragmentation of this peptide indicates a single phosphorylation of fragment y18 and b4 indicates that T4, corresponding to T89 in IC‐2C, is phosphorylated. MS/MS fragmentation eliminates four C‐terminal S/T sites (S6, S10, S13 and S20) because y3–y17 fragments have no phosphate. C) MS/MS spectrum of a phosphorylated peptide (EDEEEEDDVAT*PKPPVEPEEEK) was acquired on a triply charged ion at m/z 874.0. The precursor mass, 2620.07279 Da, indicates one phosphate in the peptide. The b11/y12 and b10/y11 fragments enable the conclusive assignment of T11 (T154 in IC‐2C) as the phosphorylated residue. D) S88 and T89 are conserved across mammalian species (mouse‐MM, rat‐RN, human‐HS, bovine‐BT and horse‐EC) and isoforms of IC‐2, and both are found in mouse IC‐1. T154 is not present in human or rat IC‐2 or in mouse IC‐1. E) Double site‐directed mutagenesis (S88A and T89V) in a 106 amino acid N‐terminal fragment of IC‐2C significantly reduced phosphorylation by GSK‐3β in vitro. F) Full‐length mouse EGFP‐IC‐2C and two mutants (T154V and S88A/T89V/T154V) were expressed in Cos7 cells, immunopurified using an EGFP antibody and exposed to GSK‐3β. Less phosphate was incorporated into the triple mutant, indicating that S88/T89 sites are targeted in the full‐length protein. G) Schematic of IC showing previously identified interaction domains. S88 and T89 (black bar, asterisks) are near Nde1/Ndel1 and P150Glued interacting regions. T154 (pink bar, asterisk) is near the dimerization and LC7‐binding domains.
Figure 4.
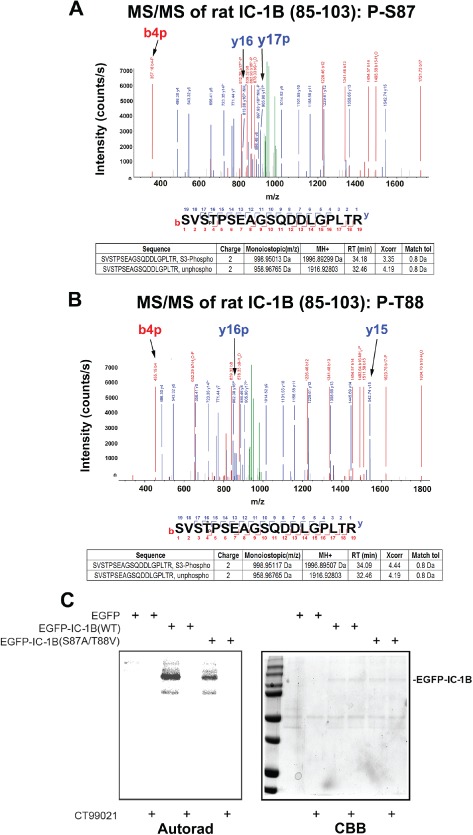
Detection of GSK‐3β‐targeted residues in rat IC‐1B . CID‐based LC/MS/MS analyses of phosphorylation in full‐length rat IC‐1B. A) An MS/MS spectrum of a phosphorylated peptide (SVS*TPSEAGSQDDLGPLTR) was acquired on a doubly charged ion at m/z 998.95 Da. The precursor mass (1996.89299 Da) is consistent with one phosphate in the peptide. MS/MS fragmentation of this peptide indicates a single phosphorylation in fragments y17 and b4, thus placing the modification unambiguously on S3, corresponding to S87 in IC‐1B. B) Another MS/MS spectrum of a phosphorylated peptide (SVST*PSEAGSQDDLGPLTR) was acquired on a doubly charged ion at m/z 998.95117 Da. Single phosphorylation of fragments y16 and b4 indicates that T4, corresponding to T88 in IC‐1B, is phosphorylated. MS/MS fragmentation eliminates four C‐terminal S/T sites (S6, S10, S13 and S20) by showing that y4–y15 fragments have no phosphorylation. C) Two‐point mutations, S87A and T88V, were introduced into GFP‐IC‐1B [EGFP‐IC1B (S87A/T87V)]. WT and mutant constructs were expressed in Cos‐7 cells, immunoprecipitated with a GFP antibody and then exposed to GSK‐3β in an in vitro kinase assay. Less 32P was incorporated into the mutant construct.
GSK‐3β phosphorylation modulates the Ndel1–dynein interaction
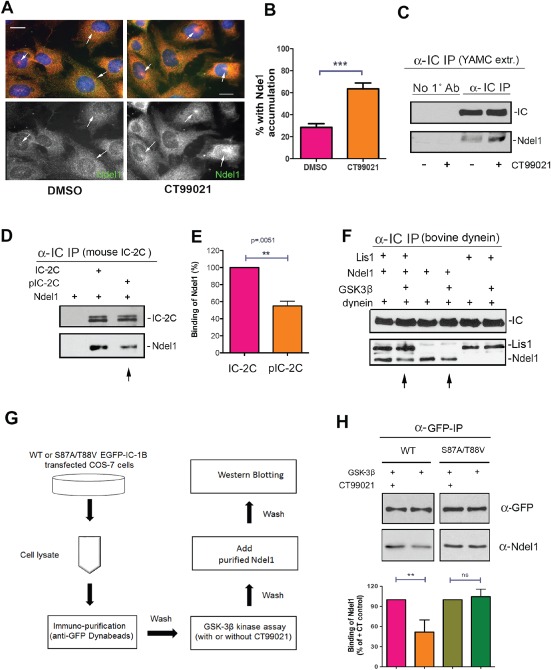
Several experiments indicate that GSK‐3 can affect the interaction between Ndel1 and dynein. First, exposing young adult mouse colon (YAMC) cells (a mouse colon cell line) to CT99021 for 12 h (after a 12 h serum starvation period) altered Ndel1 and dynein distribution so that they appeared to have accumulated at a perinuclear location that is likely the centrosome (Figure 5A). The amount of Ndel1 that was present at these sites was measured and was significantly higher in cells exposed to the drug (Figure 5B). Furthermore, GSK‐3 inhibition resulted in more Ndel1 coprecipitating with dynein (Figure 5C), while phosphorylating purified mouse IC‐2C by GSK‐3β in vitro resulted in significantly less coprecipitation of purified Ndel1 (Figure 5D,E). Similarly, less Ndel1 was coprecipitated with purified bovine dynein that was pre‐phosphorylated by GSK‐3β (Figure 5F). The presence or absence of Lis1 in this latter assay did not alter the reduction in Ndel1 binding. Together, these findings indicate that GSK‐3 phosphorylation of dynein negatively regulates the interaction with Ndel1 in a Lis1‐independent fashion.
Figure 5.
Dynein phosphorylation by GSK‐3β affects Ndel1 interaction. A) Dynein and Ndel1 distribution were evaluated in YAMC cells by IC (red) and Ndel1 (green) immunofluorescence. Cells were serum starved for 12 h and then exposed to CT99021 or vehicle alone (DMSO) for 12 h in medium supplemented with FBS and ITS. Representative images for each treatment are shown. B) The percentage of cells with Ndel1 accumulation at apparent centrosomes increased with exposure to CT99021 (N = 225 cells for each treatment, mean ± 95% CI, ***p < 0.0001 by t‐test). C) More Ndel1 coprecipitated with IC immunoprecipitated from YAMC cells that had been exposed to CT99021. D and E) Less recombinant Ndel1 coprecipitated with purified FL‐IC‐2C that had been phosphorylated with GSK‐3β (N = 3, mean ± 95% CI, **p < 0.01 by t‐test). F) Less recombinant Ndel1 coprecipitated with purified bovine brain dynein that had been previously phosphorylated by GSK‐3β (arrows). This was not affected by the presence or absence of Lis1. G) Workflow for assessing the contribution of S87/T88 phosphorylation to Ndel1 binding. An anti‐GFP antibody was used to isolate GFP‐IC‐1B or the S87A/T89V mutant expressed in Cos‐7 cells. The proteins were exposed to GSK‐3β in the presence or absence of CT99021. Recombinant Ndel1 was added, and the amount that remained bound to the IC was determined by western blotting. H) Exposing the WT IC‐1B, but not S87A/T88V, to GSK‐3β in the absence of CT99021 significantly reduced the Ndel1 binding (N = 3, mean ± 95% CI, **p < 0.01 by t‐test).
Phosphorylation at S87/88 in IC‐1B contributes to the reduced Ndel1 binding
A non‐phosphorylatable mutant (S87A/T88V) or WT EGFP‐IC‐1B was expressed and immunopurified from Cos‐7 cells using a GFP antibody. The IPs from each set was divided into two equal samples, and an in vitro GSK‐3β kinase assay was performed in the presence or absence of CT99021 (Figure 5G). The beads were washed extensively, and then incubated with recombinant Ndel1. As expected, less Ndel1 bound to WT GFP‐IC‐1B if no CT99021 was included in the reaction (Figure 5H). However, this did not affect Ndel1 binding to the mutant, presumably because S87/T89 was not phosphorylated in either sample. This indicates that phosphorylation of these residues by GSK‐3β reduces Ndel1 binding to IC.
GSK‐3β inhibition causes accumulation of dynein at centrosomes and reduction of dynein from the cell edge
In cultured cells with a radial microtubule array, the centrosome is rich in microtubule minus ends. Therefore, dynein accumulation at centrosomes has been used as a marker for increased minus end motility 11, 34. This appeared to be occurring dynein in cells treated with CT99021, and this was confirmed by costaining with the centrosomal protein CDK5RAP2 in both YAMC and HCT116 cells (Figure 6). To quantify the change, IC intensity was measured in a circular area drawn around the CDK5RAP2 signal in treated and control cells (Figure 7A,B). If they passed a threshold of 60 arbitrary fluorescence units (afu), cells were scored as having dynein accumulation at centrosomes. A dramatic increase in dynein accumulation relative to controls was observed following CT99021 exposure (Figure 7C). LiCl had a similar effect on dynein distribution (Figure 7D), as did transient expression of a dominant‐negative GSK‐3β construct (GSK‐3β K85A; Figure 7E). At the cell periphery, dynein immunofluorescence was punctate, possibly representing sites of motors primed for stimulation 35. The puncta appeared less intense in CT990221‐treated cells. To quantify this observed change, peripheral regions of control and CT990221‐treated cells (Figure 8A,B) were analyzed for differences using imagej particle analysis software. While control and treated cells typically had similar numbers of dynein puncta (Figure 8C), the puncta in the CT990221‐treated cells were on average smaller (0.087 µm2 compared with 0.178 µm2 in control cells; Figure 8D). Thus, GSK‐3 inhibition altered the steady‐state distribution of dynein, reducing the amount at the cell periphery and increasing the amount at the centrosome.
Figure 6.
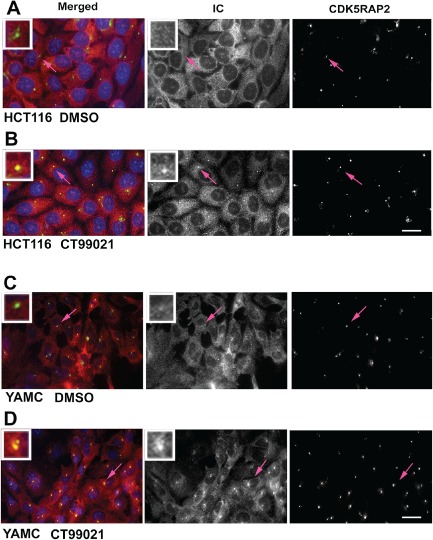
Pharmacological inhibition of GSK‐3β causes dynein to accumulate at centrosomes in colon cell lines. A and B) HCT116 human colon cancer cells were serum starved for 12 h and then exposed to DMSO or CT99021 in medium with FBS and ITS for an additional 12 h. Dynein distribution was assessed by IC immunofluorescence (red, and middle panels). Centrosomes were labeled with a CDK5RAP2 antibody (green, and right panels). Nuclei are stained with Hoechst dye (blue). Insets show digitally enlarged images of centrosomes indicated by the pink arrows. C and D) The same response was observed in YAMC cells derived from adult mouse colon.
Figure 7.
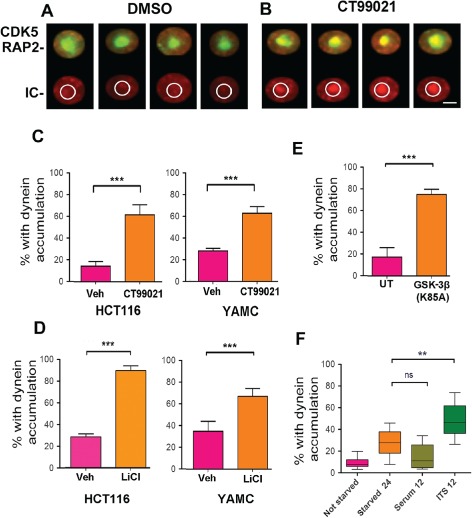
GSK‐3β inhibition is responsible for the dynein accumulation at centrosomes. A and B) IC intensity (red) was determined within a circle drawn around the centrosome (green). C) Cells with IC intensity equal to or greater than 60 afu were considered to have dynein accumulation. N = 400 cells measured for each condition. CT99021 exposure for 12 h caused a significant increase in the percentage of HCT116 or YAMC cells with dynein accumulation (mean ± 95% CI, ***p < 0.0001, t‐test). D) LiCl produced a similar result (mean ± 95% CI, ***p < 0.0001, t‐test). E) Transient expression of a dominant‐negative GSK‐3β (K85A) caused dynein accumulation when compared with untransfected cells (UT). Over 200 cells were analyzed for each group (mean ± 95% CI, ***p < 0.0001, t‐test). F) Simply adding insulin (INS) in the absence of FBS (serum) to starved cells was sufficient to produce an increase in the percentage with dynein accumulation at the centrosome. FBS alone did not induce accumulation (N = 100 cells measured for each condition; **p < 0.01, t‐test).
Figure 8.
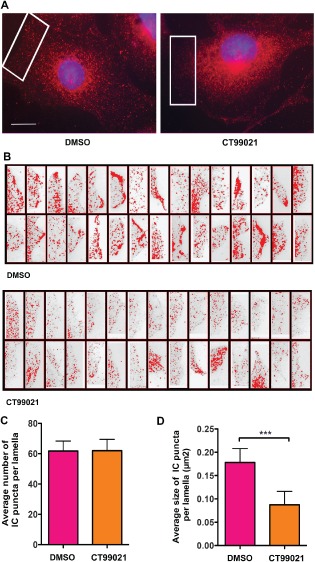
Dynein is released from peripheral/cortical sites in response to GSK‐3β inhibition. A) YAMC cells were treated with or without CT99021 for 12 h after serum starvation. Cells were fixed and immunostained with IC antibodies (red) and Hoechst dye to label nuclei. B) Thirty images of lamella of DMSO control and CT99021‐treated interphase cells were acquired for each condition using the same exposure times. All of the images were adjusted together in image j using the image j threshold controls to select pixels between 150 and 200 afu, a good fit for the data. image j was used to quantify the number and size of dynein puncta. C) The average number of dynein puncta did not change (∼60 per lamella). D) The average size of dynein puncta in CT99021‐treated cells was significantly reduced compared to control cells (mean ± 95% CI, ***p < 0.0001, t‐test). A total of 1852 puncta were measured in the control images and 1861 puncta in the CT99021‐treated images.
Both insulin and an insulin‐sensitizing drug cause centrosomal dynein accumulation
We used the dynein accumulation assay to explore upstream events that might regulate dynein via inhibition of GSK‐3 activity. GSK‐3 is inhibited by insulin in many cell types, so we exposed serum‐starved YAMC or HCT116 cells to a supplement containing a high level of insulin (ITS‐insulin, transferrin, selenium), like CT99021 insulin caused accumulation of dynein at centrosomes (Figure 7F). Serum alone was not sufficient to induce the change, possibly because FBS has 10‐fold lower insulin concentration than the ITS supplement. We next tested rosiglitazone (ROZ), a drug that is used to treat type‐2 diabetes by acting as an insulin sensitizer 36, 37. ROZ caused dynein accumulation at centrosomes, similar to that observed with both insulin and GSK‐3 inhibition (Figure 9A). The mechanism underlying insulin sensitization is not completely understood, but is related to the fact that the drug is a peroxisome proliferator‐activated receptor gamma (PPARγ) agonist. PPARs are nuclear hormone receptors, so we asked if PPARγ was present in our cell lines, which turned out to be the case (Figure S4A). Moreover, dynein redistribution was prevented by transient expression of a dominant‐negative PPARγ mutant or a transcription inhibitor 5, 6‐dichloro‐1‐β‐D‐ribofuranosylbenzimidazole (DRB) (Figure S4B,C). ROZ required the presence of either insulin or FBS for dynein accumulation at the centrosome (Figure 9B). Thus, while there was insufficient insulin in FBS to stimulate dynein accumulation in the absence of ROZ, ROZ was able to sensitize cells to this amount of insulin present in FBS. ROZ did not change the expression levels of dynein or several dynein‐associated proteins (Figure S4D).
Figure 9.
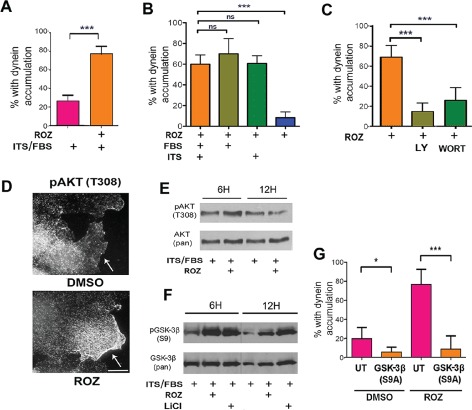
An insulin‐sensitizing drug, ROZ , causes centrosomal dynein accumulation via GSK‐3β inactivation. A) ROZ exposure resulted in IC accumulation at centrosomes (N = 150 cells for each treatment, mean ± 95% CI, ***p < 0.0001, t‐test). B) Starved YAMC cells were exposed to ROZ in the presence or absence of FBS and/or ITS. The absence of FBS and ITS prevented the dynein response to ROZ, while ITS or FBS alone was sufficient to permit the response (N = 150 cells for each treatment, mean ± 95% CI, ***p < 0.0001, by one‐way anova). C) YAMC cells were co‐treated with ROZ with or without the PI3K inhibitor, LY294002 (LY) and wortmannin (Wort). Both inhibitors blocked dynein accumulation at centrosomes (N = 150 cells for each treatment, mean ± 95% CI, ***p < 0.0001 by one‐way anova). D) Immunostaining of YAMC cells after exposure to DMSO or ROZ with pAkt (T308) antibodies. pAkt appeared enriched at the plasma membrane with ROZ treatment. Scale bar = 10 µm. E) Western blot of YAMC cells after exposure to ROZ were probed with pAkt (T308) and Pan‐AKT antibodies. ROZ increased pAKT levels by 6 h. F) Exposure of starved YAMC cells to ROZ or LiCl for 6 or 12 h in the presence of FBS/ITS also increased S9 (GSK‐3β‐S9) levels relative to total kinase levels (pan‐GSK‐3β). G) Transient expression of a constitutively active GSK‐3β construct, HA‐GSK‐3β (S9A), prevented dynein accumulation in response to ROZ. HA‐negative cells in the same cultures were considered un‐transfected (UT). (N = 100 cells for each condition, mean ± 95% CI, *p < 0.05, ***p < 0.0001 by one‐way anova).
The PI3K/AKT/GSK‐3 pathway contributes to the dynein response to ROZ
A well‐documented early response to insulin signaling in many cells is activation of phosphoinositide‐3 kinase (PI3K) 38. Auto‐phosphorylation of insulin receptors promotes binding and phosphorylation of IRS proteins (insulin receptor substrate family). This leads to activation of PI3K and production of phosphatidylinositol‐3, 4, 5‐trisphosphate (PIP3) on the cytoplasmic side of the plasma membrane. PIP3 recruits AKT/protein kinase B (AKT/PKB), which is then stimulated by other kinases at the plasma membrane, where it phosphorylates and inactivates GSK‐3β on serine 9 (S9). This canonical pathway is likely involved in the response to ROZ because pharmacological inhibition of PI3K by either LY294002 or wortmannin blocked dynein redistribution (Figure 9C). Also, phospho‐AKT (Thr308) became prominently localized at the plasma membrane in starved cells exposed to ROZ in the presence of insulin and FBS (Figure 9D). The percentage of cells with this staining pattern increased from ∼10% to over 30% by 12 h (mean ± 95% CI, ***p < 0.0001, t‐test). Phospho‐AKT levels increased in cells by 6 h after ROZ exposure, but were reduced by 12 h (Figure 9E). ROZ also induced S9 phosphorylation of GSK‐3β, and centrosome accumulation of dynein was blocked by transient expression of a constitutively active GSK‐3β isoform (Figure 9F,G). Thus, the ROZ response involves inactivation of GSK‐3β.
Dynein redistribution is not secondary to S/G2 arrest, but is instead a direct effect on dynein motility
Dynein normally accumulates at centrosomes as cells enter the S/G2 phase in cycling cells 39, so it was possible that dynein accumulated in the cells because our treatments were inducing an S/G2 arrest indirectly affecting dynein. However, ROZ exposure did not increase the number of cells with nuclear centromere protein F (CENPF‐not shown), which becomes detectable in the nucleus in late S/G2 and is degraded after mitosis 40, 41. Also, most of the cells with enriched centrosomal dynein were not CENPF positive (Figure 10A), so S/G2 arrest was unlikely to be the underlying cause of dynein accumulation at centrosomes. Rather, changes in dynein motility appear to be involved, as two different manipulations known to reduce dynein‐dependent processivity – Lis1 RNAi or dynactin p50 overexpression – prevented dynein accumulation (Figure 10B,C) 7, 13, 34, 42, 43. Dynactin subunits also became enriched at the centrosome in response to the insulin sensitizer, suggesting that the dynein that moved toward centrosomes was coupled with both Ndel1 and dynactin (Figure 10D,E). In support of increased dynein motility, acidic organelles moved more rapidly inward and were enriched near the nucleus (Figure 10F–H). Finally, ROZ increased retrograde transport of acidic organelles in adult rat DRG axons (Figure 10I,J).
Figure 10.
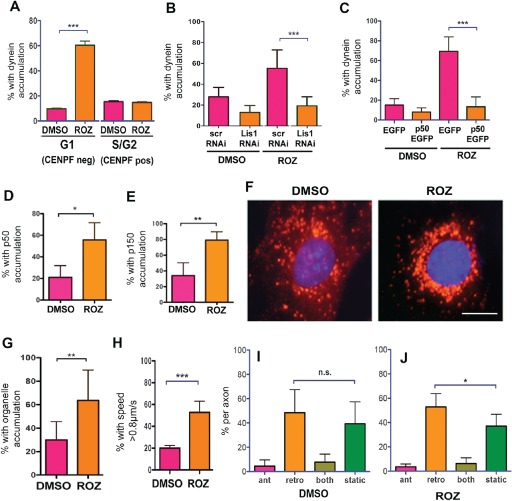
Dynein accumulation at centrosomes in response to ROZ is due to increased motor transport activity. A) YAMC cells were costained for the late‐S/G2 marker, CENPF, and IC after ROZ exposure to determine if cells were arresting at S/G2. Accumulation does not correlate with entry into S/G2 (mean ± 95% CI, ***p < 0.0001, one‐way anova). B) A Lis1 shRNA construct (Lis1 RNAi), but not a scrambled sequence (scr), prevented ROZ‐induced dynein accumulation (mean ± 95% CI, ***p < 0.0001 by one‐way anova). C) Overexpression of the GFP‐p50 also blocked the accumulation (mean ± 95% CI, ***p < 0.0001 by one‐way anova). D and E) ROZ induces accumulation of the dynactin subunits p50 and p150glued (p150) in HCT‐116 cells (mean ± 95% CI, *p < 0.05, **p < 0.0029, t‐test). F and G) ROZ exposure resulted in perinuclear accumulation of Lysotracker‐labeled organelles in YAMC cells (mean ± 95% CI, **p < 0.0021, t‐test, scale bar = 10 µm). H) The percent of organelles with average speeds over 0.8 µm/second was higher in cells treated with ROZ (mean ± 95% CI, ***p < 0.0001, t‐test). I and J) ROZ increased the percentage of organelles moving retrogradely in living adult DRG axons. The neurons were not serum starved prior to drug exposure (mean ± 95% CI, *p < 0.05, one‐way anova).
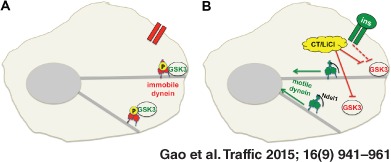
Model for insulin pathway regulation of dynein
We advance a model in which GSK‐3 inhibition serves as an activating switch for dynein motors in response to extracellular cues (Figure 11). In an unstimulated cell, constitutively active GSK‐3β phosphorylates dynein motors, helping to maintain a steady‐state equilibrium between phosphorylated and unphosphorylated dynein. The phosphorylated pool of dynein is prevented from interacting with Ndel1, and remains paused on microtubules or docked at the cell cortex (Figure 11A). When the cell is stimulated by insulin, PI3K/AKT signaling shuts down GSK‐3β at the plasma membrane. This shifts the equilibrium between phosphorylated and dephosphorylated dynein, so that Ndel1 can bind to and stimulate this pool of dephosphorylated dynein motors (Figure 11B). When cells are treated with GSK‐3 inhibitors such as CT99021 (CT) or LiCl, it is likely that GSK‐3 is inhibited throughout the cell, and the equilibrium shifts more toward active dynein motors (Figure 11C). This may explain why we observed a greater increase in retrograde transport in axons when GSK‐3 was inhibited directly (compare Figure 1 with Figure 10I, J).
Figure 11.
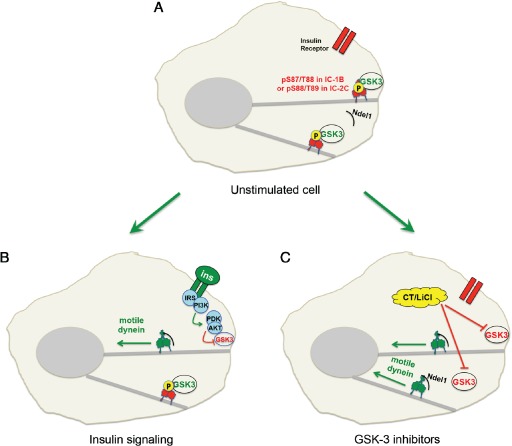
A model for GSK‐3β regulation of dynein‐dependent retrograde organelle transport. A) In control cells, GSK‐3β can phosphorylate IC at S87/T88, decreasing its interaction with Ndel1 and reducing dynein motility toward microtubule minus ends. B) When the cell is stimulated by insulin, PI3K/AKT signaling is initiated and GSK‐3β is shut off. As cortical dynein loses phosphate at S87/T88 on ICs, it interacts more efficiently with Ndel1. Ndel1 can increase dynein force production, leading to increased retrograde transport of cargo and accumulation of dynein and cargo at minus ends near the centrosome. C) Inhibition of GSK‐3β by pharmacological inhibitors such as CT99021 (CT) or LiCl bypasses the need for insulin signaling and stimulates transport.
Discussion
This study is, to our knowledge, the first showing direct phosphorylation of cytoplasmic dynein by GSK‐3. We demonstrate that this affects dynein's interaction with Ndel1, and show that GSK‐3 activity (i) alters dynein and Ndel1 distribution and (ii) affects retrograde transport of acidic organelles in both mammalian axons and in non‐neuronal cells. Our findings also add significantly to earlier reports by defining an insulin‐dependent regulation of dynein.
Both IC‐1B and IC‐2C can be phosphorylated by GSK‐3β, and phosphorylation reduces their capacity to interact with Ndel1. MS/MS spectral analyses provide strong evidence that S87/T88 in IC‐1B and the conserved residues (S88/T89) in IC‐2C are targeted by the kinase. The threonine residue has been studied previously and is targeted by other proline‐directed kinases such as PLK‐1 and p38‐MAPK 44, 45. However, S87/88 has not been described previously. It is interesting to speculate that different kinases may regulate dynein in a temporally or spatially distinct manner, or in response to different cues. The specific importance of these residues in insulin signaling will require knock‐in based approaches. This will be important as other GSK‐3 targets, including HC and LIC, could contribute to motor regulation. In addition, several microtubule‐associated proteins, including tau, CLASP, MAP1B and MAP2C 31, are also potentially targets of this pathway. In most cases, phosphorylation regulates their microtubule binding, which could affect dynein motility in any number of ways.
We reported previously that Ndel1 regulates dynein‐dependent axon transport of acidic organelles and also regulates dynein‐dependent prophase nuclear invagination in neural stem cells 14, 27. Others used single molecule studies in vitro to show that a homolog of Ndel1, Nde1, modulates dynein force production 7. Thus, a mechanism for regulating the interaction of Ndel1 with dynein is likely to act as an important modulator of dynein function. Our current finding supports the idea that GSK‐3 modulates an activating role of Ndel1 with respect to dynein movement toward minus ends, but does not rule out regulation of other Ndel1‐dependent processes such as its reported role in facilitating plus end‐directed transport of dynein motors by kinesin 46. One interesting aspect of our study is that the GSK‐3‐dependent changes in Ndel1 binding to dynein are not ‘all‐or‐nothing’. While the significance of this is not known, it is plausible that a twofold increase or decrease in the interaction would result in a significant change in the number of active motors. Alternatively, if Ndel1 binds to ICs with higher or reduced affinity, it could modulate dynein's capacity for force production or maintained processivity. Others have demonstrated a role for GSK‐3 in axon transport. In contrast to earlier studies, we observed the most substantial effect on retrograde transport. We restricted our study to a specific organelle pool (acidic organelles) and analyzed transport in mammalian cells, either of which might be relevant to the observed differences. There are some differences in the previous studies concerning whether GSK‐3 regulates motors directly or by regulating their membrane association 19, 21. Our study does not distinguish between these possibilities with respect to dynein, but because Nde1 has been linked to direct modulation of force generation in single molecule studies 7, the most parsimonious interpretation of our data is that phosphorylation of dynein by GSK‐3 modulates Ndel1 binding to affect dynein force production.
Linking dynein behavior to a known insulin signaling pathway is relevant to human health in several ways. Insulin is clearly important in metabolic disorders. There is also increasing evidence that type 2 diabetes causes age‐related dementia, and this has been linked to alterations in insulin signaling 47. Neurodegenerative diseases have frequently been associated with the onset of insulin resistance, and many of these are also associated with altered dynein‐dependent transport 48. The GSK‐3β inhibitor LiCl has been widely used to treat mood disorders, but whether this involves alterations in dynein remains to be determined 24. More recently, it was reported that a mutation in dynein HC in mice resulted in glucose intolerance in aged animals 49.
We used dynein redistribution and lysosome motility as a measure of dynein activation. The reason for dynein activation in response to insulin signaling is not known. However, others have reported that ROZ stimulates trafficking of a glucose transporter, GLUT4, in adipocytes 50, and it has been speculated that acute 20‐min insulin exposure prevents GLUT4 internalization by dynein 51. Our studies examined the effect on minus end‐directed transport after 12 h of insulin (or drug) exposure following a 12 h serum starvation in several cell types. It is possible that in this longer term treatment, GLUT4 needs to be moved away from the plasma membrane to restore glucose homeostasis. Alternatively, or perhaps concomitantly, insulin receptors might be internalized. Finally, there may be previously undiscovered roles for retrograde transport following insulin exposure. This could include cell‐type specific functions or gene expression changes.
ROZ is sold by GlaxoSmithKline under the trade name Avandia 52 and is proving beneficial for treating cognitive dysfunction in diabetes models and neuroinflammation in Alzheimer's disease models 53, 54. The exact mechanism by which ROZ sensitizes cells to insulin is not well understood, and may be cell and context dependent. The link to dynein activation will be of interest to many research laboratories running clinical and pre‐clinical trials with Avandia and related compounds. Similarly, the finding that ROZ stimulates retrograde axonal transport in adult neurons may provide a framework from which to understand how insulin resistance contributes to cognitive dysfunction.
Insulin signaling is important in other situations as well, such as colorectal cancer 55. Insulin signaling may stimulate survival and proliferation of cancer cells, and there is a higher incidence of colorectal cancer among diabetics 56. Cells in the mammalian colon express PPARγ protein 57, 58 and confusingly, ROZ and similar drugs have been reported to be both chemopreventive and carcinogenic in rodent models, which has garnered substantial interest in these compounds 57, 58. Dynein and its regulators function during mitotic events that require force generation including nuclear envelope breakdown, spindle orientation and chromosome segregation 27, 59, 60, 61, and PI3K and GSK‐3 activities have been linked to many of the same processes 62, 63, 64, 65, 66, 67, 68, 69. Our studies indicate that ROZ and insulin can regulate dynein in mouse and human colon cell lines. Our studies will therefore prove useful in interpreting outcomes of pre‐clinical and clinical trials in cancer treatments involving insulin‐related drugs.
Many questions need to be answered to fully understand dynein regulation by extracellular signals. Can other ligands that lead to GSK‐3 inhibition stimulate dynein? Neurotrophins clearly stimulate retrograde transport of signaling endosomes in DRG axons 70. It would be interesting if specific pools of dynein or transport of specific cargos are regulated by different signals. This could be envisioned if there are spatially restricted signaling pathways or pockets of dynein associated with specific cargos. What is the significance of phosphorylation of other dynein subunits? Do phosphatases play a role? How are different kinase pathways coordinated in the cell to regulate dynein? It is interesting to speculate that different combinations of signals lead to different dynein‐dependent processes (i.e. transport versus mitosis). For example, we showed previously that phosphorylation of Ndel1 by Cdk5 increases its interaction with Lis1, while phosphorylation by both CDK5 and CDK1, but not by either kinase alone, inhibited Ndel1 binding to dynein 27. Finally, how do spatial restraints contribute to signaling? In our cultured cell lines, most microtubule plus ends are positioned near the cell periphery so that dynein activation results in cargo being transported toward minus ends near the nucleus. In axons, microtubule minus ends are oriented toward the cell bodies, so a similar polarity of transport was detected. Cells within tissues can have very different microtubule arrays and receptor ligand interactions can occur at specific cellular domains so this mechanism could be spatially controlled in situ. Our work provides a platform from which to launch these investigations.
Materials and Methods
Cell lines
The human colon cancer cell line, HCT‐116, and the green monkey kidney cell line, Cos‐7, were maintained in DMEM supplemented with glutamine (2 mm), 10% FBS, penicillin (100 U/mL) and streptomycin (100 µg/mL). The murine YAMC epithelial cell line was derived from the colonic mucosa of a transgenic mouse generated by the introduction of a temperature‐sensitive, interferon‐inducible, SV40 T Ag, tsA58, the Immortomouse 71. YAMC cells were maintained at the permissive temperature (33°C) in RPMI 1640 media supplemented with glutamine (2 mm), 10% FBS, penicillin (100 U/mL), streptomycin (100 µg/mL), murine gamma interferon (5 U/mL) and 1% ITS Invitrogen.
Pharmaceutical reagents
The following pharmaceutical reagents were used: CT99021 (3 µm, Selleck) and LiCl (10 mm, Sigma‐Aldrich), ROZ (10 µm, Biomol), DRB (80 µm, Fisher, Inc.), LY294002 (10 µm, Cell Signaling) and Wortmannin (0.5 µm, Biomol). Cultures exposed to vehicle alone (DMSO or H2O) served as controls. For drug treatments, YAMC or HCT116 cells were serum starved for 12 h prior to drugs exposure in full medium for an additional 12 h (or as indicated). The starvation was designed to increase insulin receptor trafficking to the cell surface and/or to lower exposure to natural ligands of PPARγ to increase sensitivity to ROZ. DRG neurons did not undergo serum starvation, but were maintained in culture for 24 h with 10% horse serum prior to addition of drugs.
Expression vectors
EGFP‐C1 IC‐2C, PRSET‐A IC‐2C and PRSET‐A N237 expression vectors were described previously 72. The EGFP‐N1 IC‐1B vector was provided by K. Pfister (University VA). Non‐phosphorylatable mutants of IC‐2C and IC‐1B were generated from their related WT vector using the QuickChange II site‐directed mutagenesis kit (Agilent Technologies) and confirmed by DNA sequencing. For IC‐2C, S88A/T89V was generated using the polymerase chain reaction (PCR) primer 5′‐CTTCCAGCTTCACTTGGCACGGCCACCGACTTGGAGGATGG‐3′, and T154V was generated using PCR primer 5′‐ATGAGGAGGAGGAAGATGATGTAGCAGTTCCTAAACCTCCTG‐3′. For IC‐1B, S87A/T88V was generated using 5′‐GGCTTCCAGCTTCACTGGGAACGGCCACTGATTTCGAAGAGGGAG‐3′. HA‐GSK‐3β K85A and HA‐GSK‐3β S9A expression vectors were from Addgene (plasmid ID 14755 and 14754). The p50‐EGFP plasmid was provided by T. A. Schroer (Johns Hopkins). Complementary hairpin sequences for Lis1 (1062–1080 bp; GAGTTGTGC‐TGATGACAAG) were synthesized and cloned into pSilencer under the control of the U6 promoter (version 2.0; Ambion) 14. The flag‐tagged, dominant‐negative human PPARγ expression vector (dnPPARγ) was provided by V. K. Chatterjee (Oxford University). This mutant retains ligand and DNA binding, but exhibits markedly reduced transactivation and impaired corepressor interaction, which is thought to produce the dominant‐negative effect 73. When indicated, cells were transiently transfected using Lipofectamine 2000 reagent (Invitrogen).
Antibodies
The 74.1 dynein IC mouse mAb, H100 PPARγ1 rabbit polyclonal Ab, H‐3 His‐probe rabbit polyclonal Ab and IRβ mouse mAb were from Santa Cruz Biotechnology. The 3D10 GSK‐3β mouse mAb, 5B3 S9 Phospho‐GSK‐3β rabbit mAb, 11E7 Akt rabbit mAb, D25E6 T308 pAkt rabbit mAb and D9E S473 p‐Akt rabbit mAb were from Cell Signaling, Inc. The EB1, p150, p50 and β‐catenin mouse mAbs were from BD Biosciences. The CDK5RAP2 rabbit polyclonal Ab was from Millipore. The α‐tubulin mouse mAb was from Sigma‐Aldrich. The rabbit polyclonal CENPF Ab was from Novus Biologicals. Lis1 and Ndel1 rabbit polyclonal antibodies were described previously 14, 27.
Analysis of acidic organelle movement in DRG axons
Forty eight hours after sciatic nerve crush to induce a regenerative response, adult rat DRG neurons were plated for 16–24 h onto laminin and poly‐D‐lysine‐coated German glass coverslips and maintained in Hamm's F12 medium supplemented with 10% horse serum 14. Neurons were exposed to 100 nmol Lysotracker Red (Invitrogen) for 30 min prior to imaging. Coverslips were transferred into fresh medium containing 25 mm HEPES, pH 7.4 and OxyFluor (Oxyrase, Inc.) in a water‐heated custom‐built microscope stage warmed to 37°C. Cells expressing a relatively low level of Lysotracker Red were selected for time‐lapse imaging using an Axiovert 200 inverted microscope (Carl Zeiss, Inc.). Fluorescent images were acquired every 2 seconds for 4 min using a Plan‐Apo 63×/1.2 W/0.17 water objective. Kymographs were generated from time‐lapse movies using NIH imagej software. The kymographs were generated such that the direction toward the cell body was always to the right, so lines that sloped toward the right at any point with a net displacement of >5 µm were categorized as retrograde organelles. Lines that sloped toward the left >5 µm at any time during the recording interval were considered anterograde organelles. Lines that zigzagged were categorized as bidirectional, and lines that showed <5 µm lateral displacement in any direction during the recording interval were categorized as static.
Protein purification
Bovine brain cytoplasmic dynein was purified as described previously 74, 75. Recombinant dynein and Ndel1 proteins were expressed in BL‐21 cells. Cells were grown at 37°C to an OD600 of 0.4, and then 0.1 mm isopropyl‐D‐thiogalactoside was added to induce protein expression. Bacteria were lysed in His‐tagged protein purification‐binding buffer (Invitrogen) with protease inhibitors. The cells were sonicated and the pelleted by centrifugation at 10 000 × g at 4°C for 30 min. Ni‐NTA beads (Invitrogen) were added into the cell supernatant and incubate at 4°C for 1 h. The protein was washed three times and then eluted from beads. His‐tagged recombinant Lis1 was expressed in Sf9 insect cells using a baculovirus kindly provided by A. Musacchio. His‐tagged Lis1 was purified using Ni‐NTA beads.
Cell and brain extract preparation
For preparation of cell extract, cells at 90% confluency were lysed in buffer containing 50 mm Tris (pH 7.5), 0.1% NP‐40, 100 mm NaCl, 1 mm MgCl2, 5 mm EDTA, protease inhibitor cocktail (Fisher) and Halt phosphatase inhibitor cocktail (Fisher) on ice for 30 min. Cell lysates were sonicated for 10 pulses at level 1 with 10% output for three times. The lysates were incubated on ice for another 10 min and then centrifuged at 17 000 × g for 20 min at 4°C. For preparation of mouse brain extract, brains were quickly dissected and dounce‐homogenized in the above lysis buffer. The lysates were incubated on ice for 30 min and then centrifuged at 17 000 × g for 30 min at 4°C. Concentrations of extracts were determined by a BCA (bicinchoninic acid) protein assay (Pierce).
Protein kinase assays
The GST‐GSK‐3β Kinase Enzyme System and SignalChem GST‐GSK‐3β or His‐GSK‐3β purified kinases (Promega) were used for all kinase assays. Lambda protein phosphatase was purchased from New England BioLabs. For some assays, purified dynein was first immobilized on 74.1 mouse monoclonal IC antibody‐conjugated agarose (Santa Cruz Biotechnology, Inc.). Potential substrates were incubated with 50 ng GSK‐3β and 0.03 μCi/μL γ32P‐ATP for 30 min at 37°C. The reaction was stopped by the addition of sample buffer. In one experiment, brain dynein was pre‐incubated with 1000 U Lambda phosphatase to remove preexisting phosphates. Some reactions also included 3 µm of the GSK‐3 inhibitor CT99021. Proteins were separated by SDS–PAGE and the wet min‐gel was sealed in saran wrap and exposed to X‐ray film overnight at −80°C. After exposure, gels were stained with coomassie brilliant blue to visualize proteins.
Immunoprecipitation and western blot
For IPs from cell or brain extracts, 1 µg 74.1 IC antibodies were first incubated with 30 μL Protein‐A dynabeads (Invitrogen) for 2 h at room temperature and washed with lysis buffer twice. The antibody‐conjugated dynabeads were incubated with 1 mg extracts at 4°C overnight. Dynabeads were subjected to two washes of lysis buffer and then two washes of PBS‐T (PBS with 0.1% Tween 20) at 4°C. For IPs from purified bovine brain dynein or IC‐2C, proteins were first incubated with 74.1 mouse monoclonal IC antibody‐conjugated agarose (Santa Cruz Biotechnology, Inc.) in PBS‐T with protease and phosphatase inhibitors overnight. Beads were spun down and washed with PBS‐T twice and then with PHM‐T buffer (60 mm PIPES, 25 mm HEPES, 4 mm MgSO4 and 0.1% Tween 20, pH 6.9). Beads then were incubated with Lis1 or Ndel1 or both in PHM‐T buffer with protease and phosphatase inhibitors for 1 h at room temperature. Beads were washed three times with PHM‐T buffer and eluted in 60 μL PBS plus 20 μL 6× sample buffer and boiled for 3 min before samples were loaded onto SDS–PAGE gels. For western blots, samples were transferred to PVDF (polyvinylidene fluoride) or nitrocellulose membranes and subjected to standard protocols to identify proteins.
MS analysis of IC
Purified N237‐IC‐2C or immunopurified EGFP‐IC‐1B exposed to GSK‐3β (or incubated in a mock kinase assay without the kinase) was separated by SDS–PAGE and visualized by coomassie blue staining. The target protein bands were excised, destained with 25 mm NH4HCO3/50% ACN, reduced with DTT, alkylated with iodoacetamide and digested overnight at 37°C using sequencing grade Trypsin (12.5 ng/μL; Promega) in 25 μL of 25 mm NH4HCO3. In‐gel digested peptides were extracted with 50% ACN/5% formic acid and dried down via SpeedVac (SVC100, Savant) and reconstituted in 15 μL of 5% formic acid. One microliter of each sample was introduced via a Dionex Ultimate 3000 RSLC nano liquid chromatograph (nanospray ionization) into an Orbitrap Velos Pro (Thermo Fisher Scientific). An Acclaim® PepMap™ RSLC C18 column (Dionex, 15 cm length, 75 µm diameter, 2 µm particle sizes, 100 Å pore sizes) was used for peptide separation. Peptides were analyzed in the Orbitrap with one full MS scan at a resolution of 7500 (a mass range of 200–2000 m/z) followed by six collision‐induced dissociation (CID) data‐dependent MS2 scans (35.0 normalized collision energy, 0.250 activation Q and 10 millisecond action time). The raw data were searched using sequest against a database of the cytoplasmic dynein 1 IC generated from the uniprot database using thermo scientific proteome discoverer software (1.4). Search parameters were set as follows: variable modifications of oxidation (at methionine residues) and phosphorylation (at serine, threonine and tyrosine); allowed missed cleavages 2; a precursor mass tolerance at 10 ppm; a fragment mass tolerance at 0.1 Da.
General immunofluorescence
For p50, p150glued and pAKT immunofluorescence, cells were fixed in 3% paraformaldehyde followed by permeabilization with 0.2% Triton‐X‐100 for 10 min. Nuclei were visualized using Hoechst dye (33258; Sigma‐Aldrich). Coverslips were mounted on glass slides using ProLong Gold Antifade (Invitrogen). Cells were visualized with an Axiovert 200 inverted microscope (Carl Zeiss, Inc.) using Plan‐Neo 100×/1.30 or Plan‐Apo 63×/1.40 oil‐immersion objectives (Immersol 518F; Carl Zeiss, Inc.). In some cases, optical sections were deconvolved using axiovision combined iterative algorithm to obtain confocal images.
Analysis of dynein accumulation at centrosomes
After treatment, cells were fixed in 100% ice‐cold methanol for 2 min. The accumulation of dynein at centrosomes was determined by measuring the mean pixel intensity of immunofluorescence (afu) in a fixed circular area (0.008 inches2) encompassing the centrosome visualized by CDK5Rap2. Intensities were determined using imagej software. For most experiments, dynein enrichment was considered positive if it was greater than or equal to 60 afu (this was typically three times higher than randomly selected regions of the cell). The analysis of dynein puncta at cell periphery is described in Figure 3.
Analysis of dynein at the cell periphery
After treatment, cells were fixed in 100% ice‐cold methanol for 2 min and processed for dynein immunofluorescence with the 74.1 antibody. A total of 30 images of lamella of DMSO control and CT99021‐treated interphase cells were acquired for each condition at the same exposure times using an Axiovert 200 inverted microscope (Carl Zeiss, Inc.). All of the images were adjusted together in image j using the image j threshold controls to select pixels between 150 and 200 afu, a good fit for the data. image j particle analysis software was used to quantify the number and size of dynein puncta.
Analysis of acidic organelle movement in YAMC cells
YAMC cells were incubated with 100 nmol Lysotracker Red for 30 min prior to imaging. Coverslips were transferred into fresh medium containing 25 mm HEPES, pH 7.4 and OxyFluor in a water‐heated custom‐built microscope stage warmed to 37°C. Cells expressing a relatively low level of Lysotracker Red were selected for imaging. Fluorescent images were acquired every 2 seconds for 4 min using a Plan‐Apo 63×/1.2 W/0.17 water objective. Velocities and run lengths of retrograde, minus end‐directed organelle movement (toward the nucleus) were measured using the ‘particle tracking’ plugin for imageJ software.
Statistics
All analyses were carried out using graphpad prism version 5.00 for mac osx. In all figures, error bars represent ±95% CI (confidence interval). One‐way anova with Tukey's multiple comparison test or an unpaired, two‐tailed student's t‐test was used and described in each figure legend.
Supporting information
Figure S1. GSK‐3β consensus (S/TXXXS/T) sites and proline‐directed sites on bovine dynein IC‐1 (A), IC‐2 (B), LIC‐1 (C) and LIC‐2 (D). Consensus sites are colored in red and proline‐directed sites are highlighted with yellow.
Figure S2. GSK‐3β consensus (S/TXXXS/T) sites and proline‐directed sites on human dynein HC‐1. Consensus sites are colored in red and proline‐directed sites are highlighted with yellow.
Figure S3. A) Sequence coverage of the IC‐2C N237 fragment by MS. The sequences identified are shown in red, covering 70.4% of the 237 amino acids. The fragments with identified phosphorylated residues are underlined, and the residues are indicated by (*). B) Sequence coverage of full‐length murine IC‐1B by MS. The sequences identified are shown in red, covering 69.7% of the 626 amino acids. The fragments with identified phosphorylated residues are underlined, and the residues are indicated by (*).
Figure S4. A) Western blots of both HCT116 and YAMC cell extracts show that they express PPARγ and ROZ treatment for 12 h does not change PPARγ expression. B) Expression of dominant‐negative, flag‐tagged PPARγ construct significantly reduces ROZ induced accumulation of IC at the centrosome in HCT116. C) YAMC cells were co‐incubated with 500 µm DRB (a potent transcription inhibitor) and ROZ and stained for IC. ROZ‐induced IC accumulation only happened when DRB was not present, which indicated that dynein accumulation at centrosomes requires new transcription. D) Treatment with 10 µm ROZ for 12 h did not alter protein expression of IC, p150 and Lis1.
Acknowledgments
We thank T. A. Schroer for p50GFP, K. Pfister for EGFP‐IC‐1B, V. K. Chatterjee for dnPPARγ, L. H. Tsai for Lis1 siRNA and T. Hines and L. Shi for critical review of the manuscript. This study was funded by the Cancer Research and Prevention Foundation (S. H.), and NIH (DSS‐5P20RR017698 and NS056314, SJK‐NS048501).
References
- 1. Baptista FI, Pinto MJ, Elvas F, Martins T, Almeida RD, Ambrosio AF. Diabetes induces changes in KIF1A, KIF5B and dynein distribution in the rat retina: implications for axonal transport. Exp Eye Res 2014;127:91–103. [DOI] [PubMed] [Google Scholar]
- 2. Franker MA, Hoogenraad CC. Microtubule‐based transport ‐ basic mechanisms, traffic rules and role in neurological pathogenesis. J Cell Sci 2013;126:2319–2329. [DOI] [PubMed] [Google Scholar]
- 3. Hirokawa N, Niwa S, Tanaka Y. Molecular motors in neurons: transport mechanisms and roles in brain function, development, and disease. Neuron 2010;68:610–638. [DOI] [PubMed] [Google Scholar]
- 4. Liu X, Gong H, Huang K. Oncogenic role of kinesin proteins and targeting kinesin therapy. Cancer Sci 2013;104:651–656. [DOI] [PMC free article] [PubMed] [Google Scholar]
- 5. Gennerich A, Vale RD. Walking the walk: how kinesin and dynein coordinate their steps. Curr Opin Cell Biol 2009;21:59–67. [DOI] [PMC free article] [PubMed] [Google Scholar]
- 6. Huang J, Roberts AJ, Leschziner AE, Reck‐Peterson SL. Lis1 acts as a "clutch" between the ATPase and microtubule‐binding domains of the dynein motor. Cell 2012;150:975–986. [DOI] [PMC free article] [PubMed] [Google Scholar]
- 7. McKenney RJ, Vershinin M, Kunwar A, Vallee RB, Gross SP. LIS1 and NudE induce a persistent dynein force‐producing state. Cell 2010;141:304–314. [DOI] [PMC free article] [PubMed] [Google Scholar]
- 8. Fu MM, Holzbaur EL. Integrated regulation of motor‐driven organelle transport by scaffolding proteins. Trends Cell Biol 2014;24:564–574. [DOI] [PMC free article] [PubMed] [Google Scholar]
- 9. Schlager MA, Hoang HT, Urnavicius L, Bullock SL, Carter AP. In vitro reconstitution of a highly processive recombinant human dynein complex. EMBO J 2014;33:1855–1868. [DOI] [PMC free article] [PubMed] [Google Scholar]
- 10. McKenney RJ, Huynh W, Tanenbaum ME, Bhabha G, Vale RD. Activation of cytoplasmic dynein motility by dynactin‐cargo adapter complexes. Science 2014;345:337–341. [DOI] [PMC free article] [PubMed] [Google Scholar]
- 11. Schlager MA, Serra‐Marques A, Grigoriev I, Gumy LF, Esteves da Silva M, Wulf PS, Akhmanova A, Hoogenraad CC. Bicaudal d family adaptor proteins control the velocity of dynein‐based movements. Cell Rep 2014;8:1248–1256. [DOI] [PubMed] [Google Scholar]
- 12. Rai AK, Rai A, Ramaiya AJ, Jha R, Mallik R. Molecular adaptations allow dynein to generate large collective forces inside cells. Cell 2013;152:172–182. [DOI] [PubMed] [Google Scholar]
- 13. Lam C, Vergnolle MA, Thorpe L, Woodman PG, Allan VJ. Functional interplay between LIS1, NDE1 and NDEL1 in dynein‐dependent organelle positioning. J Cell Sci 2010;123:202–212. [DOI] [PubMed] [Google Scholar]
- 14. Pandey JP, Smith DS. A Cdk5‐dependent switch regulates Lis1/Ndel1/dynein‐driven organelle transport in adult axons. J Neurosci 2011;31:17207–17219. [DOI] [PMC free article] [PubMed] [Google Scholar]
- 15. Markus SM, Punch JJ, Lee WL. Motor‐ and tail‐dependent targeting of dynein to microtubule plus ends and the cell cortex. Curr Biol 2009;19:196–205. [DOI] [PMC free article] [PubMed] [Google Scholar]
- 16. Roberts AJ, Goodman BS, Reck‐Peterson SL. Reconstitution of dynein transport to the microtubule plus end by kinesin. ELife 2014;3:e02641. [DOI] [PMC free article] [PubMed] [Google Scholar]
- 17. Wu C, Cui B, He L, Chen L, Mobley WC. The coming of age of axonal neurotrophin signaling endosomes. J Proteomics 2009;72:46–55. [DOI] [PMC free article] [PubMed] [Google Scholar]
- 18. Rishal I, Fainzilber M. Axon‐soma communication in neuronal injury. Nat Rev Neurosci 2014;15:32–42. [DOI] [PubMed] [Google Scholar]
- 19. Dolma K, Iacobucci GJ, Hong Zheng K, Shandilya J, Toska E, White JA 2nd, Spina E, Gunawardena S. Presenilin influences glycogen synthase kinase‐3 beta (GSK‐3beta) for kinesin‐1 and dynein function during axonal transport. Hum Mol Genet 2014;23:1121–1133. [DOI] [PubMed] [Google Scholar]
- 20. Morfini G, Szebenyi G, Elluru R, Ratner N, Brady ST. Glycogen synthase kinase 3 phosphorylates kinesin light chains and negatively regulates kinesin‐based motility. EMBO J 2002;21:281–293. [DOI] [PMC free article] [PubMed] [Google Scholar]
- 21. Weaver C, Leidel C, Szpankowski L, Farley NM, Shubeita GT, Goldstein LS. Endogenous GSK‐3/shaggy regulates bidirectional axonal transport of the amyloid precursor protein. Traffic 2013;14:295–308. [DOI] [PubMed] [Google Scholar]
- 22. Baas PW, Lin S. Hooks and comets: the story of microtubule polarity orientation in the neuron. Dev Neurobiol 2011;71:403–418. [DOI] [PMC free article] [PubMed] [Google Scholar]
- 23. Eldar‐Finkelman H. Glycogen synthase kinase 3: an emerging therapeutic target. Trends Mol Med 2002;8:126–132. [DOI] [PubMed] [Google Scholar]
- 24. Marmol F. Lithium: bipolar disorder and neurodegenerative diseases possible cellular mechanisms of the therapeutic effects of lithium. Prog Neuropsychopharmacol Biol Psychiatry 2008;32:1761–1771. [DOI] [PubMed] [Google Scholar]
- 25. Cole A, Frame S, Cohen P. Further evidence that the tyrosine phosphorylation of glycogen synthase kinase‐3 (GSK3) in mammalian cells is an autophosphorylation event. Biochem J 2004;377:249–255. [DOI] [PMC free article] [PubMed] [Google Scholar]
- 26. Nyarko A, Song Y, Barbar E. Intrinsic disorder in dynein intermediate chain modulates its interactions with NudE and dynactin. J Biol Chem 2012;287:24884–24893. [DOI] [PMC free article] [PubMed] [Google Scholar]
- 27. Hebbar S, Mesngon MT, Guillotte AM, Desai B, Ayala R, Smith DS. Lis1 and Ndel1 influence the timing of nuclear envelope breakdown in neural stem cells. J Cell Biol 2008;182:1063–1071. [DOI] [PMC free article] [PubMed] [Google Scholar]
- 28. Niethammer M, Smith DS, Ayala R, Peng J, Ko J, Lee MS, Morabito M, Tsai LH. NUDEL is a novel Cdk5 substrate that associates with LIS1 and cytoplasmic dynein. Neuron 2000;28:697–711. [DOI] [PubMed] [Google Scholar]
- 29. Kuta A, Deng W, Morsi El‐Kadi A, Banks GT, Hafezparast M, Pfister KK, Fisher EM. Mouse cytoplasmic dynein intermediate chains: identification of new isoforms, alternative splicing and tissue distribution of transcripts. PLoS One 2010;5:e11682. [DOI] [PMC free article] [PubMed] [Google Scholar]
- 30. Mitchell DJ, Blasier KR, Jeffery ED, Ross MW, Pullikuth AK, Suo D, Park J, Smiley WR, Lo KW, Shabanowitz J, Deppmann CD, Trinidad JC, Hunt DF, Catling AD, Pfister KK. Trk activation of the ERK1/2 kinase pathway stimulates intermediate chain phosphorylation and recruits cytoplasmic dynein to signaling endosomes for retrograde axonal transport. J Neurosci 2012;32:15495–15510. [DOI] [PMC free article] [PubMed] [Google Scholar]
- 31. Sutherland C. What are the bona fide GSK3 Substrates? Int J Alzheimers Dis 2011;2011:505607. [DOI] [PMC free article] [PubMed] [Google Scholar]
- 32. McKenney RJ, Weil SJ, Scherer J, Vallee RB. Mutually exclusive cytoplasmic dynein regulation by NudE‐Lis1 and dynactin. J Biol Chem 2011;286:39615–39622. [DOI] [PMC free article] [PubMed] [Google Scholar]
- 33. Wang S, Zheng Y. Identification of a novel dynein binding domain in nudel essential for spindle pole organization in Xenopus egg extract. J Biol Chem 2011;286:587–593. [DOI] [PMC free article] [PubMed] [Google Scholar]
- 34. Smith DS, Niethammer M, Ayala R, Zhou Y, Gambello MJ, Wynshaw‐Boris A, Tsai LH. Regulation of cytoplasmic dynein behaviour and microtubule organization by mammalian Lis1. Nat Cell Biol 2000;2:767–775. [DOI] [PubMed] [Google Scholar]
- 35. Schuster M, Kilaru S, Ashwin P, Lin C, Severs NJ, Steinberg G. Controlled and stochastic retention concentrates dynein at microtubule ends to keep endosomes on track. EMBO J 2011;30:652–664. [DOI] [PMC free article] [PubMed] [Google Scholar]
- 36. Karak M, Bal NC, Bal C, Sharon A. Targeting peroxisome proliferator‐activated receptor gamma for generation of antidiabetic drug. Curr Diabetes Rev 2013;9:275–285. [DOI] [PubMed] [Google Scholar]
- 37. Jiang G, Zhang BB. Modulation of insulin signalling by insulin sensitizers. Biochem Soc Trans 2005;33:358–361. [DOI] [PubMed] [Google Scholar]
- 38. Saltiel AR, Pessin JE. Insulin signaling pathways in time and space. Trends Cell Biol 2002;12:65–71. [DOI] [PubMed] [Google Scholar]
- 39. Quintyne NJ, Schroer TA. Distinct cell cycle‐dependent roles for dynactin and dynein at centrosomes. J Cell Biol 2002;159:245–254. [DOI] [PMC free article] [PubMed] [Google Scholar]
- 40. Liao H, Winkfein RJ, Mack G, Rattner JB, Yen TJ. CENP‐F is a protein of the nuclear matrix that assembles onto kinetochores at late G2 and is rapidly degraded after mitosis. J Cell Biol 1995;130:507–518. [DOI] [PMC free article] [PubMed] [Google Scholar]
- 41. Landberg G, Erlanson M, Roos G, Tan EM, Casiano CA. Nuclear autoantigen p330d/CENP‐F: a marker for cell proliferation in human malignancies. Cytometry 1996;25:90–98. [DOI] [PubMed] [Google Scholar]
- 42. Mesngon MT, Tarricone C, Hebbar S, Guillotte AM, Schmitt EW, Lanier L, Musacchio A, King SJ, Smith DS. Regulation of cytoplasmic dynein ATPase by Lis1. J Neurosci 2006;26:2132–2139. [DOI] [PMC free article] [PubMed] [Google Scholar]
- 43. Tripathy SK, Weil SJ, Chen C, Anand P, Vallee RB, Gross SP. Autoregulatory mechanism for dynactin control of processive and diffusive dynein transport. Nat Cell Biol 2014;16:1192–1201. [DOI] [PMC free article] [PubMed] [Google Scholar]
- 44. Bader JR, Kasuboski JM, Winding M, Vaughan PS, Hinchcliffe EH, Vaughan KT. Polo‐like kinase1 is required for recruitment of dynein to kinetochores during mitosis. J Biol Chem 2011;286:20769–20777. [DOI] [PMC free article] [PubMed] [Google Scholar]
- 45. Whyte J, Bader JR, Tauhata SB, Raycroft M, Hornick J, Pfister KK, Lane WS, Chan GK, Hinchcliffe EH, Vaughan PS, Vaughan KT. Phosphorylation regulates targeting of cytoplasmic dynein to kinetochores during mitosis. J Cell Biol 2008;183:819–834. [DOI] [PMC free article] [PubMed] [Google Scholar]
- 46. Yamada M, Toba S, Yoshida Y, Haratani K, Mori D, Yano Y, Mimori‐Kiyosue Y, Nakamura T, Itoh K, Fushiki S, Setou M, Wynshaw‐Boris A, Torisawa T, Toyoshima YY, Hirotsune S. LIS1 and NDEL1 coordinate the plus‐end‐directed transport of cytoplasmic dynein. EMBO J 2008;27:2471–2483. [DOI] [PMC free article] [PubMed] [Google Scholar]
- 47. Sato N, Morishita R. Brain alterations and clinical symptoms of dementia in diabetes: abeta/tau‐dependent and independent mechanisms. Front Endocrinol 2014;5:143. [DOI] [PMC free article] [PubMed] [Google Scholar]
- 48. Eschbach J, Dupuis L. Cytoplasmic dynein in neurodegeneration. Pharmacol Ther 2011;130:348–363. [DOI] [PubMed] [Google Scholar]
- 49. Eschbach J, Sinniger J, Bouitbir J, Fergani A, Schlagowski AI, Zoll J, Geny B, Rene F, Larmet Y, Marion V, Baloh RH, Harms MB, Shy ME, Messadeq N, Weydt P, et al. Dynein mutations associated with hereditary motor neuropathies impair mitochondrial morphology and function with age. Neurobiol Dis 2013;58:220–230. [DOI] [PMC free article] [PubMed] [Google Scholar]
- 50. Velebit J, Chowdhury HH, Kreft M, Zorec R. Rosiglitazone balances insulin‐induced exo‐ and endocytosis in single 3T3‐L1 adipocytes. Mol Cell Endocrinol 2011;333:70–77. [DOI] [PubMed] [Google Scholar]
- 51. Huang J, Imamura T, Olefsky JM. Insulin can regulate GLUT4 internalization by signaling to Rab5 and the motor protein dynein. Proc Natl Acad Sci U S A 2001;98:13084–13089. [DOI] [PMC free article] [PubMed] [Google Scholar]
- 52. Hernandez R, Teruel T, Lorenzo M. Rosiglitazone produces insulin sensitisation by increasing expression of the insulin receptor and its tyrosine kinase activity in brown adipocytes. Diabetologia 2003;46:1618–1628. [DOI] [PubMed] [Google Scholar]
- 53. Kariharan T, Nanayakkara G, Parameshwaran K, Bagasrawala I, Ahuja M, Abdel‐Rahman E, Amin AT, Dhanasekaran M, Suppiramaniam V, Amin RH. Central activation of PPAR‐gamma ameliorates diabetes induced cognitive dysfunction and improves BDNF expression. Neurobiol Aging 2015;36:1451–1461. [DOI] [PubMed] [Google Scholar]
- 54. Watson GS, Craft S. The role of insulin resistance in the pathogenesis of Alzheimer's disease: implications for treatment. CNS Drugs 2003;17:27–45. [DOI] [PubMed] [Google Scholar]
- 55. Herrigel DJ, Moss RA. Diabetes mellitus as a novel risk factor for gastrointestinal malignancies. Postgrad Med 2014;126:106–118. [DOI] [PubMed] [Google Scholar]
- 56. Larsson SC, Orsini N, Wolk A. Diabetes mellitus and risk of colorectal cancer: a meta‐analysis. J Natl Cancer Inst 2005;97:1679–1687. [DOI] [PubMed] [Google Scholar]
- 57. Lefebvre AM, Chen I, Desreumaux P, Najib J, Fruchart JC, Geboes K, Briggs M, Heyman R, Auwerx J. Activation of the peroxisome proliferator‐activated receptor gamma promotes the development of colon tumors in C57BL/6J‐APCMin/+ mice. Nat Med 1998;4:1053–1057. [DOI] [PubMed] [Google Scholar]
- 58. Su W, Bush CR, Necela BM, Calcagno SR, Murray NR, Fields AP, Thompson EA. Differential expression, distribution, and function of PPAR‐gamma in the proximal and distal colon. Physiol Genomics 2007;30:342–353. [DOI] [PubMed] [Google Scholar]
- 59. Barton NR, Goldstein LS. Going mobile: microtubule motors and chromosome segregation. Proc Natl Acad Sci U S A 1996;93:1735–1742. [DOI] [PMC free article] [PubMed] [Google Scholar]
- 60. Kotak S, Gonczy P. Mechanisms of spindle positioning: cortical force generators in the limelight. Curr Opin Cell Biol 2013;25:741–748. [DOI] [PubMed] [Google Scholar]
- 61. Raaijmakers JA, Medema RH. Function and regulation of dynein in mitotic chromosome segregation. Chromosoma 2014;123:407–422. [DOI] [PubMed] [Google Scholar]
- 62. Acevedo N, Wang X, Dunn RL, Smith GD. Glycogen synthase kinase‐3 regulation of chromatin segregation and cytokinesis in mouse preimplantation embryos. Mol Reprod Dev 2007;74:178–188. [DOI] [PubMed] [Google Scholar]
- 63. Bobinnec Y, Morin X, Debec A. Shaggy/GSK‐3beta kinase localizes to the centrosome and to specialized cytoskeletal structures in Drosophila . Cell Motil Cytoskeleton 2006;63:313–320. [DOI] [PubMed] [Google Scholar]
- 64. Fumoto K, Lee PC, Saya H, Kikuchi A. AIP regulates stability of Aurora‐A at early mitotic phase coordinately with GSK‐3beta. Oncogene 2008;27:4478–4487. [DOI] [PubMed] [Google Scholar]
- 65. Harwood AJ, Forde‐Thomas JE, Williams H, Samereier M, Muller‐Taubenberger A. Aberrant spindle dynamics and cytokinesis in Dictyostelium discoideum cells that lack glycogen synthase kinase 3. Eur J Cell Biol 2013;92:222–228. [DOI] [PMC free article] [PubMed] [Google Scholar]
- 66. Izumi N, Fumoto K, Izumi S, Kikuchi A. GSK‐3beta regulates proper mitotic spindle formation in cooperation with a component of the gamma‐tubulin ring complex, GCP5. J Biol Chem 2008;283:12981–12991. [DOI] [PubMed] [Google Scholar]
- 67. Tighe A, Ray‐Sinha A, Staples OD, Taylor SS. GSK‐3 inhibitors induce chromosome instability. BMC Cell Biol 2007;8:34. [DOI] [PMC free article] [PubMed] [Google Scholar]
- 68. Wakefield JG, Stephens DJ, Tavare JM. A role for glycogen synthase kinase‐3 in mitotic spindle dynamics and chromosome alignment. J Cell Sci 2003;116:637–646. [DOI] [PubMed] [Google Scholar]
- 69. Wojcik EJ. A mitotic role for GSK‐3beta kinase in Drosophila . Cell Cycle 2008;7:3699–3708. [DOI] [PMC free article] [PubMed] [Google Scholar]
- 70. Marlin MC, Li G. Biogenesis and function of the NGF/TrkA signaling endosome. Int Rev Cell Mol Biol 2015;314:239–257. [DOI] [PMC free article] [PubMed] [Google Scholar]
- 71. Whitehead RH, VanEeden PE, Noble MD, Ataliotis P, Jat PS. Establishment of conditionally immortalized epithelial cell lines from both colon and small intestine of adult H‐2Kb‐tsA58 transgenic mice. Proc Natl Acad Sci U S A 1993;90:587–591. [DOI] [PMC free article] [PubMed] [Google Scholar]
- 72. King SJ, Brown CL, Maier KC, Quintyne NJ, Schroer TA. Analysis of the dynein‐dynactin interaction in vitro and in vivo. Mol Biol Cell 2003;14:5089–5097. [DOI] [PMC free article] [PubMed] [Google Scholar]
- 73. Gurnell M, Wentworth JM, Agostini M, Adams M, Collingwood TN, Provenzano C, Browne PO, Rajanayagam O, Burris TP, Schwabe JW, Lazar MA, Chatterjee VK. A dominant‐negative peroxisome proliferator‐activated receptor gamma (PPARgamma) mutant is a constitutive repressor and inhibits PPARgamma‐mediated adipogenesis. J Biol Chem 2000;275:5754–5759. [DOI] [PubMed] [Google Scholar]
- 74. Culver‐Hanlon TL, Lex SA, Stephens AD, Quintyne NJ, King SJ. A microtubule‐binding domain in dynactin increases dynein processivity by skating along microtubules. Nat Cell Biol 2006;8:264–270. [DOI] [PubMed] [Google Scholar]
- 75. Bingham JB, King SJ, Schroer TA. Purification of dynactin and dynein from brain tissue. Methods Enzymol 1998;298:171–184. [DOI] [PubMed] [Google Scholar]
Associated Data
This section collects any data citations, data availability statements, or supplementary materials included in this article.
Supplementary Materials
Figure S1. GSK‐3β consensus (S/TXXXS/T) sites and proline‐directed sites on bovine dynein IC‐1 (A), IC‐2 (B), LIC‐1 (C) and LIC‐2 (D). Consensus sites are colored in red and proline‐directed sites are highlighted with yellow.
Figure S2. GSK‐3β consensus (S/TXXXS/T) sites and proline‐directed sites on human dynein HC‐1. Consensus sites are colored in red and proline‐directed sites are highlighted with yellow.
Figure S3. A) Sequence coverage of the IC‐2C N237 fragment by MS. The sequences identified are shown in red, covering 70.4% of the 237 amino acids. The fragments with identified phosphorylated residues are underlined, and the residues are indicated by (*). B) Sequence coverage of full‐length murine IC‐1B by MS. The sequences identified are shown in red, covering 69.7% of the 626 amino acids. The fragments with identified phosphorylated residues are underlined, and the residues are indicated by (*).
Figure S4. A) Western blots of both HCT116 and YAMC cell extracts show that they express PPARγ and ROZ treatment for 12 h does not change PPARγ expression. B) Expression of dominant‐negative, flag‐tagged PPARγ construct significantly reduces ROZ induced accumulation of IC at the centrosome in HCT116. C) YAMC cells were co‐incubated with 500 µm DRB (a potent transcription inhibitor) and ROZ and stained for IC. ROZ‐induced IC accumulation only happened when DRB was not present, which indicated that dynein accumulation at centrosomes requires new transcription. D) Treatment with 10 µm ROZ for 12 h did not alter protein expression of IC, p150 and Lis1.