

Background: L-type Ca2+ channels (LTCCs) are fine-tuned by different molecular mechanisms.
Results: Pore-forming α1-subunits of LTCCs contain a polybasic amino acid sequence within their I-II linkers that binds to the plasma membrane. This polybasic motif is required for normal channel gating and modulation.
Conclusion: The polybasic cluster stabilizes normal channel activity.
Significance: We discovered a new modulatory domain of LTCCs within their pore-forming α1-subunit.
Keywords: calcium channel, electrophysiology, phospholipid, plasma membrane, protein motif, Cav1.2, L-type calcium channels, cytoplasmic domain
Abstract
L-type voltage-gated Ca2+ channels (LTCCs) regulate many physiological functions like muscle contraction, hormone secretion, gene expression, and neuronal excitability. Their activity is strictly controlled by various molecular mechanisms. The pore-forming α1-subunit comprises four repeated domains (I–IV), each connected via an intracellular linker. Here we identified a polybasic plasma membrane binding motif, consisting of four arginines, within the I-II linker of all LTCCs. The primary structure of this motif is similar to polybasic clusters known to interact with polyphosphoinositides identified in other ion channels. We used de novo molecular modeling to predict the conformation of this polybasic motif, immunofluorescence microscopy and live cell imaging to investigate the interaction with the plasma membrane, and electrophysiology to study its role for Cav1.2 channel function. According to our models, this polybasic motif of the I-II linker forms a straight α-helix, with the positive charges facing the lipid phosphates of the inner leaflet of the plasma membrane. Membrane binding of the I-II linker could be reversed after phospholipase C activation, causing polyphosphoinositide breakdown, and was accelerated by elevated intracellular Ca2+ levels. This indicates the involvement of negatively charged phospholipids in the plasma membrane targeting of the linker. Neutralization of four arginine residues eliminated plasma membrane binding. Patch clamp recordings revealed facilitated opening of Cav1.2 channels containing these mutations, weaker inhibition by phospholipase C activation, and reduced expression of channels (as quantified by ON-gating charge) at the plasma membrane. Our data provide new evidence for a membrane binding motif within the I-II linker of LTCC α1-subunits essential for stabilizing normal Ca2+ channel function.
Introduction
Ca2+ influx through voltage-gated L-type Ca2+ channels (LTCCs)3 is essential for many cellular events. It causes muscle contraction, initiates hormone secretion and neurotransmitter release, tunes neuronal excitability, and regulates gene expression (1, 2). LTCCs are large multiprotein complexes consisting of a pore-forming transmembrane α1-subunit and accessory intracellular β- and extracellular α2δ-subunits. To adapt Ca2+ entry to different cellular needs, functional diversity is achieved by multiple molecular mechanisms. Four different α1-subunits (CaV1.1–1.4) can confer different biophysical properties (1) that are further adjusted by alternative splicing (3–5). In addition, the channels' accessory subunits tune their gating behavior and various protein interaction partners further provide LTCC currents with cell- and tissue-specific properties (1). However, rapid regulatory changes in current dynamics cannot be accomplished by changing channel composition. Instead, quick adaptive responses of channel activity require fast regulatory processes, including Ca2+ entry itself (inducing inactivation through channel-bound calmodulin (6)), phosphorylation by various kinases (7–9), extracellular pH (10), and direct G-protein modulation (11). Next to these mechanisms, membrane lipids are also important regulators of Ca2+ channel activity (12, 13). Depletion of phosphatidylinositol 4,5-bisphosphate (PIP2) from the plasma membrane causes a rapid decrease of Ca2+ channel activity. In excised membrane patches, non-LTCC currents (CaV2.1 and CaV2.2) run down within minutes, which is attenuated by application of PIP2 or its water-soluble analogue diC8-PIP2 (14, 15). Rapid depletion of membrane PIP2 content in intact cells by muscarinic 1 (M1) receptor activation, voltage-dependent phosphatases, or rapamycin-induced translocation of inositol-lipid phosphatases confirmed the direct dependence of CaV1 (CaV1.2 and CaV1.3) and CaV2 (CaV2.1 and CaV2.2) channels on endogenous membrane PIP2 (16). Channel inhibition by PIP2 depletion occurs in a β-subunit-dependent manner because the β2a-subunit, an isoform anchored to the plasma membrane by palmitoylation, attenuates inhibition (13, 17). Together with observations that arachidonic acid inhibits channel activity, a model has been proposed in which PIP2, the fatty acid side chain of palmitoylated β2a-subunits of voltage-gated Ca2+ channels (VGCCs), and arachidonic acid have overlapping binding sites, resulting in complex channel regulation by lipid metabolism (12, 17–19). There is also experimental evidence for more than one PIP2 regulatory site in VGCCs: a higher affinity stimulatory “S” site supporting channel activity and a lower affinity inhibitory site (“R” site) stabilizing reluctant gating properties (12, 14, 20). Current working models suggest at least one facilitatory PIP2 site on LTCCs and at least two on CaV2.2 channels (16).
Anionic phospholipids, like phosphatidylserine and phosphoinositides, target proteins with clusters of positive charges to the plasma membrane (21, 22). Despite unique insights into the structural basis of PIP2 modulation within the crystal structure of K+ channels (23, 24) and the identification of potential polyphosphoinositide binding domains within several ion channel proteins (for a review, see Refs. 13 and 25), the structural basis for fast modulation of VGCC function by plasma membrane lipids is unknown. It occurs at a very fast time scale, indicating that channel-lipid interactions are rapidly reversible and do not require more complex biochemical pathways, such as channel internalization (26). Similar to K+ channels (23, 24), it appears likely that cytoplasmic domains located close to the plasma membrane participate in lipid interactions that stabilize channel function and allow modulation of channels by activation of phospholipase C (PLC). In addition to fast channel modulation, it is at present also unknown whether anionic lipids participate in the constitutive stabilization of VGCC function, which would be expected for very high affinity interactions not subject to regulation by changes in plasmalemmal phospholipid content (27).
Here we report the identification of a polybasic cluster within the cytoplasmic I-II linker of CaV1.2 α1-subunits, which specifically binds to the plasma membrane. Activation of PLCs and polyphosphoinositide breakdown together with elevated intracellular Ca2+ levels reverse membrane binding. Four positively charged arginines are required for binding, most likely by strongly favoring a straight helix conformation of that region, positioning it entirely at the interface between the hydrocarbon core and lipid headgroups. Their neutralization in the intact channel facilitates channel opening and thus suggests a role of this polybasic cluster in stabilizing normal channel activity.
Experimental Procedures
All chemicals, reagents and antibodies were purchased from Sigma-Aldrich (Vienna, Austria) except where otherwise indicated. diC8-PIP2 was purchased from Echelon Biosciences Inc. (Salt Lake City, UT).
Cloning of cDNA Constructs
The CaV α1-subunits used in this study were identical with GenBankTM sequence accession numbers X05921 (CaV1.1 α1), X15539 (CaV1.2 α1), EU363339 (CaV1.3 α1), and AJ224874 (CaV1.4 α1).
For immunofluorescence experiments, CaV1 α1 I-II linkers (amino acid numbering according to respective accession number: CaV1.1, 335–432; CaV1.2, 436–554; CaV1.3, 407–523; CaV1.4, 373–518) were cloned into vector pCIneo (Promega, E1841) in fusion with a FLAG tag at the C terminus. CaV1.2 I-II linker mutations were cloned into vector p3XFLAG-CMV-10 with a Myc tag at the C terminus and with a triple FLAG tag at the N terminus. The C terminus of CaV1.3 and the CaV1.3 W441A-I-II linker mutant were also cloned into vector p3XFLAG-CMV-10. CaV1.2 I-II linker mutations 4R4A and 4R4E were generated by splicing by overlap extension PCR (28) and cloned into vector mRFP-C1 with mRFP at the N terminus. Vector mRFP-C1 was generated by amplifying mRFP sequence from pCX-mRFP1 vector (29) to replace EYFP in pEYFP-C1 vector (Clontech, 6005-1). The C-terminally V5-tagged β-subunit β2a (M80545), C3S/C4Sβ2a, and β3 (NM_012828) constructs were expressed as described previously (30, 31).
The generation of N-terminally GFP-tagged β3 (expression vector pCI-neo (Promega), generously provided by Manfred Grabner (32)) and C-terminally EGFP-tagged β2a-subunits (expression vector pbA (33)) was described recently. mRFP-tagged pleckstrin homology (PH) domain of PLCδ (PH-PLCδ) was kindly provided by the Netherlands Cancer Institute (34). Untagged M1 receptor was generated from cyan fluorescent protein-labeled M1 receptor construct (generously provided by Stefan Böhm (Medical University of Vienna, Austria)) by restriction digestion and cloning into vector pCIneo. Peptide 526–554 with an N-terminal GFP tag (GFP526–554) was generated by PCR cloning into vector EGFP (35). Lyn11-FRB, mRFP-FKBP-pseudojanin, and GFP-PH-Osh2x2 constructs were kindly provided by Dominik Oliver and Gerald Hammond (36, 37). α1-Subunit mutants CaV1.2L4A and CaV1.2L4E were generated by splicing by overlap extension-PCR and cloned into vector pCIneo. For short CaV1.2 α1 mutations, CaV1.2S4A and CaV1.2S4E, a stop codon was generated by PCR at position 1800 in the CaV1.2 α1-subunit in pCIneo. The integrity of all constructs was confirmed by DNA sequencing (Microsynth, Eurofins).
Cell Culture and Transfection
For immunofluorescence microscopy, live cell imaging (LCI), and electrophysiology, tsA-201 cells were cultured in Dulbecco's modified Eagle's medium (DMEM), 10% fetal calf serum (Gibco, 10500.064), 2 mm glutamine (Sigma, G753) penicillin (10 units/ml), and streptomycin (10 μg/ml) and maintained at 37 °C in a humidified environment with 5% CO2. Cells were grown and split when they reached about 80% confluence using 0.05% trypsin for cell dissociation. Cells were transiently transfected using Ca2+-phosphate precipitation as described previously (38). For immunofluorescence and LCI, cells were replated 24 h after transfection onto 12 mm (for immunofluorescence) and 18 mm (for LCI) poly-l-lysine-coated coverslips and kept at 37 °C for 24–48 h until further experimentation. For whole-cell patch clamp recordings, tsA-201 cells were transiently transfected with equimolar ratios of cDNA encoding C-terminally long or short wild-type or mutant CaV1.2 α1-subunits together with auxiliary β3- (rat, NM_012828) and α2δ1- (rabbit, NM_001082276) subunits. To visualize transfected cells, GFP was co-transfected. Cells were then plated onto a 35-mm culture dish coated with poly-l-lysine. The cells were kept at 30 °C and 5% CO2 and subjected to electrophysiological measurements about 48–72 h after transfection.
Immunofluorescence Microscopy
48 h after plating, tsA-201 cells were fixed in 4% (w/v) paraformaldehyde (Electron Microscopy Sciences, 15710) for 15 min at room temperature. Cells were washed thoroughly with phosphate-buffered saline and blocked for 30 min at room temperature with 5% (w/v) normal goat serum (GibcoBRL, 16210-064) in 0.2% (v/v) Triton/phosphate-buffered saline for cell permeabilization. Cells were incubated overnight at 4 °C with primary antibodies diluted in washing buffer containing 0.2% (v/v) Triton X-100 and 0.2% (w/v) BSA (immunoglobulin-free) in phosphate-buffered saline. After washing the cells in washing buffer, they were incubated with the secondary antibody for 1 h at room temperature in the dark. Washing was repeated, and the coverslips were mounted with Vectashield mounting medium (Vector Laboratories, H-1000) and sealed with nail polish on microscope slides. The following antibodies were employed: mouse monoclonal anti-V5, working dilution 1:500 (Invitrogen, R96025); rabbit polyclonal anti-FLAG (Sigma, F7425; 1:500); mouse monoclonal anti-FLAG (Sigma, F3165; 1:5000); Alexa Fluor-488-conjugated goat anti-rabbit and Alexa-594-conjugated goat anti-mouse antibodies (1:4000; Life Technologies, Invitrogen, A-11008 and A-11005). Images were captured with an Axiophot microscope (Carl Zeiss Inc., ×63, 1.4 numerical aperture Zeiss plan apochromat oil immersion lens) using a cooled CCD camera and at room temperature and Meta View image processing software (Universal Imaging Corp., West Chester, PA). Images were manually adjusted for brightness and contrast with Adobe Photoshop version 7.0.
Live Cell Imaging
After 24 h of replating, 18-mm coverslips containing live tsA-201 cells were washed once with Tyrode solution (130 mm NaCl, 2.5 mm KCl, 2 mm CaCl2, 2 mm MgCl2, 10 mm HEPES, 30 mm glucose, pH 7.4, 319 mosmol/liter), subsequently mounted on a Ludin chamber (Life Imaging Services) and kept in Tyrode solution until further processing. The chamber was placed on an ASI stage of an inverted Zeiss Axiovert 200M epifluorescence microscope (Carl Zeiss). Cells were imaged at room temperature. Different drugs (10 μm oxotremorine M, 50 μm m-3M3FBS (2,4,6-trimethyl-N-(meta-3-trifluoromethyl-phenyl)-benzenesulfonamide), 5 μm ionomycin, 20 μm wortmannin, 5 μm rapamycin (Calbiochem, Merck Millipore)) in different combinations (as indicated under “Results”) were diluted to final concentrations in Tyrode solution and either directly added to the imaging chamber or added to a 35-mm culture dish containing the coverslip when preincubation was desired. Twelve-bit grayscale images were recorded at different time intervals using a cooled CCD camera (SPOT, Diagnostic Instruments), Metavue image processing software (Universal Imaging, Corp.), and a ×63, 1.4 numerical aperture Zeiss Plan Apochromat oil immersion lens. For presentation, selected images were linearly adjusted using Adobe Photoshop version 7.0 and CS4. For quantification, areas of interest of equal size were selected in the membrane, cytoplasm, and background of cells, and average pixel intensity was recorded and used to calculate the membrane to cytoplasm ratio for every image. All quantitative data are represented as mean ± S.E. for the indicated number of experiments (n), except if stated otherwise. Data were analyzed by paired Student's t test, unpaired Student's t test, or one-way analysis of variance with Bonferroni post-hoc test using GraphPad Prism version 5.01 (GraphPad Software Inc.). Significance level was set to p < 0.05.
Electrophysiological Recordings
Whole-cell patch clamp experiments were performed in transiently transfected tsA-201 cells using an Axopatch 200B amplifier (Axon Instruments). Electrodes with a final resistance of 2–4 megaohms were pulled from borosilicate glass capillaries using a P-97 micropipette puller (Sutter Instruments) and subsequently fire-polished (MF-830 microforge, Narishinge). Ca2+ currents were measured using the following solutions: pipette solution, 135 mm CsCl, 10 mm Cs-EGTA, 1 mm MgCl2, 10 mm HEPES, 4 mm Na2-ATP, adjusted to pH 7.3 with CsOH; bath solution, 15 mm CaCl2, 150 mm choline chloride, 1 mm MgCl2, 10 mm HEPES adjusted to pH 7.3 with CsOH. All voltages were corrected for a junction potential of −9.3 mV. Recordings were digitized (Digidata 1322A digitizer, Axon Instruments) at 50 kHz, low pass-filtered at 5 kHz, and analyzed using pClamp version 10.2 software (Axon instruments). Current-voltage (I-V) relationships were obtained by applying a 20-ms square pulse protocol to various test potentials starting from a holding potential of −90 mV. Resulting I-V curves were fitted to Equation 1,
where I is the peak current amplitude, Gmax is the maximum slope conductance, V is the test potential, Vrev is the extrapolated reversal potential, V0.5 is the half-maximal activation voltage, and kact is the activation slope. Channel inactivation was measured using a 300-ms pulse from a holding potential of −90 mV to Vmax. For the estimation of the open probability (PO), the area of the ON-gating current (QON) was integrated and compared with the amplitude of the ionic tail current (ITail) at Vrev. Data were analyzed using Clampfit version 10.2 (Axon Instruments) and Sigma Plot 12 (Systat Software Inc.). To assess the effects of diC8-PIP2 or the PLC activator m-3M3FBS, cells were depolarized from a holding potential of −90 mV to Vmax for 20 ms at 0.1 Hz. As a control, CaV1.2S- or CaV1.2S4E-expressing cells were perfused (flow rate: 250 μl/min) with bath solution only. To test whether diC8-PIP2 can stabilize ICa decline, the same protocol was performed in the presence of 100 μm diC8-PIP2 in the internal solution. DiC8-PIP2 was prepared according to the manufacturer's instructions as a 1 mm stock in intracellular recording solution. Aliquots were kept frozen and diluted before use. To analyze the effects of phosphoinositide depletion on CaV1.2 currents, cells were perfused with 20 μm wortmannin and 50 μm m-3M3FBS. (flow rate: 250 μl/min). All quantitative data are represented as mean ± S.E. Statistical significance was determined by one- or two-way analysis of variance followed by Bonferroni post-hoc test or unpaired Student's t test as indicated using GraphPad Prism version 5.01 (GraphPad Software Inc.). Significance level was set to p < 0.05.
Rosetta Membrane Modeling of the Domain I-II Linker Region and Voltage-sensing Domain II of CaV1.2 Channel
Homology, de novo, and full-atom modeling of the voltage-sensing domain (VSD) of native and mutant CaV1.2 channels was performed using the Rosetta membrane method (39–41) and the x-ray structure of the bacterial voltage-gated Na+ channel (NaVAb) VSD (42) as a template. Sequence alignment between native CaV1.2 and NaVAb VSDs shown in Fig. 8A was generated using the HHpred server (43, 44). The backbone structure of the transmembrane regions of CaV1.2 was built based on NaVAb VSD template. The 19-residue N-terminal region and S1-S2, S2-S3, and S3-S4 loops of CaV1.2 VSD were built de novo using the Rosetta cyclic coordinate descent loop modeling method (45) guided by membrane environment-specific energy function (39, 46). 10,000 models were generated for each CaV1.2 channel construct, and the top 10% of models ranked by total score were clustered (47) using root mean square deviation threshold that generates at least 150–200 models in the largest cluster. Models representing centers of the top five clusters and the best 10 models by total score were chosen for visual analysis. The top cluster and all 10 lowest energy models of native CaV1.2 showed very similar conformation of the domain I-II linker region (see Fig. 8). None of the top five clusters and 10 lowest energy models of alanine or glutamate mutants of CaV1.2 showed similar conformations of the domain I-II linker region (see Fig. 8). All structural figures were generated using the UCSF Chimera package (48).
FIGURE 8.

Structural models of the domain I-II linker region of native CaV1.2 channel. A, sequence alignment between the native CaV1.2 I-II linker region and the domain II voltage-sensing domain (rCaV1.2-DII-VSD) and NaVAb voltage-sensing domain (NaVAb-VSD). Transmembrane segments S1–S4 are underlined by black bars and labeled. Amino acids were colored using the Zappo color scheme in Jalview. B–D, transmembrane view of the ribbon representation of the top cluster models of the VSD of CaV1.2 with the 10 lowest energy Rosetta models superimposed in B and space-filling representations of arginine side chains in the domain I-II linker helix in C and of large hydrophobic side chains in the I-II linker helix in D. E and F, transmembrane view of ribbon representation of the top five clusters and 10 lowest energy Rosetta models of the CaV1.2 VSD of alanine mutants superimposed in E and of glutamate mutants superimposed in F. Models are colored in a rainbow scheme from blue (N-terminal region before S1 segment) to red (S4 segment). Transmembrane segments S1–S4 are labeled accordingly. Black bars, approximate location of the extracellular and intracellular edges of the hydrophobic layer of the membrane.
Results
We (49) and others (50) have recently reported that the I-II linker of LTCC CaV1.3 and CaV1.2 α1-subunits is targeted to the plasma membrane when expressed alone as a soluble protein in tsA-201 cells. Because the I-II linker harbors the high affinity interaction site for Ca2+ channel β-subunits (51), it is also capable of targeting co-expressed β-subunits to the plasma membrane, even in complex with β1-subunit-bound Rab3-interacting molecule (49). Plasma membrane association of the linker is independent of β-subunits. Introduction of mutation W441A, which disrupts β-subunit binding to the linker (31, 52), prevented β-subunit targeting without affecting the plasma membrane localization of the linker (49). This suggested a specific, β-subunit-independent interaction of the I-II linker with the plasma membrane either through a membrane-associated protein or through direct interaction with membrane lipids.
I-II Linkers of All LTCC Isoforms Bind to the Plasma Membrane
To test whether plasma membrane binding is a property of all LTCC α1-subunits, we transfected FLAG-labeled I-II linkers of CaV1.1, CaV1.2, CaV1.3, and CaV1.4 α1-subunits (Fig. 1, A–D, left) into tsA-201 cells. Immunoblot analysis (not shown; n = 3) confirmed their expression as intact polypeptides. All LTCC I-II linkers were localized at the plasma membrane (Fig. 1, A–D). This localization pattern was independent of expression levels and indistinguishably observed in cells with weak and strong expression of the respective linkers (not shown). More than 85% of transfected cells (three independent experiments; 300 cells/experiment analyzed) showed this typical plasma membrane binding. In contrast, a FLAG-labeled control fragment derived from the CaV1.3 C terminus (FLAG-C158) clearly revealed a cytoplasmic distribution (Fig. 1E, first panel), as did the non-palmitoylated β2a mutant C3S/C4Sβ2a (Fig. 1E, middle). In contrast, normal palmitoylated β2a revealed the expected plasma membrane targeting (Fig. 1E, last panel) and thus served as a positive control. Consistent with our previous findings, C3S/C4Sβ2a (n = 3; Fig. 1, A–D, middle panel) and β3 (not shown, n = 3) (49) also were localized at the plasma membrane after co-expression with one of the four LTCC I-II linkers. This shows that all LTCC I-II linkers support β-subunit plasma membrane targeting.
FIGURE 1.
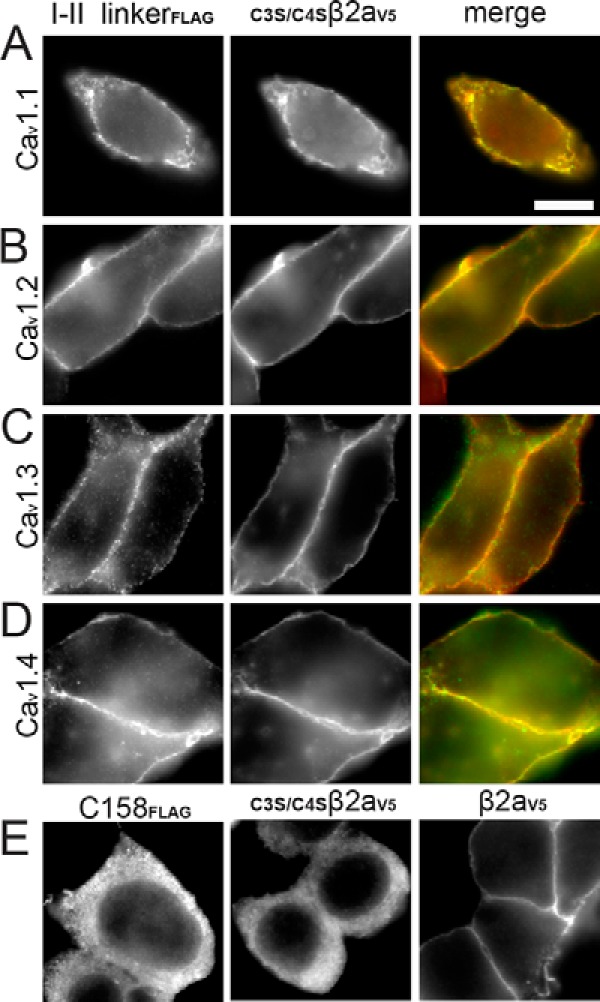
All LTCC I-II linkers target to the plasma membrane in tsA-201 cells. Immunofluorescence images of anti-FLAG-labeled LTCC (CaV1.1–CaV1.4) I-II linkers and anti-V5-labeled palmitoylation-deficient β2a(C3S/C4Sβ2aV5) co-expressed in tsA-201 cells. A–D, left, anti-FLAG-labeled I-II linkers (I-II linkerFLAG); middle, anti-V5-labeled C3S/C4Sβ2a (C3S/C4Sβ2aV5); right, merged images (green, anti-FLAG-labeled I-II linkers; red, anti-V5-labeled C3S/C4Sβ2a). E, expression of only anti-FLAG-labeled distal 158 amino acids of the CaV1.3 α1 C terminus (C158FLAG), of anti-V5-labeled C3S/C4Sβ2aV5, and of anti-V5-labeled palmitoylated β2a (β2aV5), respectively. Representative cells from three independent experiments are shown. Scale bar, 10 μm.
A Polybasic Cluster of Amino Acids Is Essential for I-II Linker Plasma Membrane Binding
To further identify the structural motif within the linker responsible for membrane targeting we expressed triple-FLAG-labeled linker peptides with deletions of equal size (29–30 amino acids) located in different parts of the CaV1.2 linker (Fig. 2A). The I-II linker of CaV1.2 was chosen for this analysis because it provided the best signal/noise ratio (not shown). Whereas membrane binding of mutants Δ436–465, Δ466–495, and Δ496–525 remained unaffected by the deletions (Fig. 2B), removal of amino acids 526–554 (Fig. 2, A and B; Δ526–554) abolished plasma membrane binding and resulted in cytoplasmic staining. Accordingly, mutants Δ436–465 and Δ496–525 translocated co-expressed C3S/C4Sβ2a to the plasma membrane (Fig. 2B), whereas Δ526–554 did not (Fig. 2B). Mutant Δ466–495 failed to target C3S/C4Sβ2a to the plasma membrane (Fig. 2B). This was expected, because the β-subunit α1-subunit interaction domain (AID) is also removed by this deletion. By creating additional deletion mutants Δ536–554 (no membrane binding; Fig. 3A) and Δ544–554 (membrane-bound; Fig. 3A) we found that essential structural determinants for membrane targeting must be localized within positions 536–543 (Fig. 2A).
FIGURE 2.
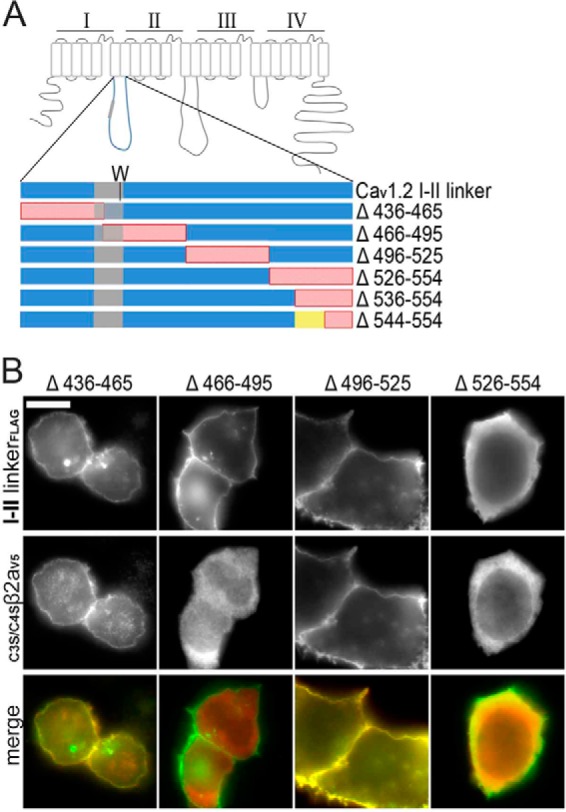
Plasma membrane localizing signal is present in CaV1.2 I-II linker distal terminus. A, schematic representation of all deletion mutants of the CaV1.2 I-II linker shown in B. A tryptophan residue (W) important for α1-β subunit interaction marks the position of the AID domain (gray). Red, deletions; yellow, amino acids 536–544. B, immunofluorescence images of anti-FLAG-labeled deletion mutants of the CaV1.2 I-II linker (top), anti-V5-labeled C3S/C4Sβ2a (middle), and merged images (green, anti-FLAG-labeled I-II linkers; red, anti-V5-labeled C3S/C4Sβ2a) co-expressed in tsA-201 cells. Representative images from three independent experiments are shown. Scale bar, 10 μm.
FIGURE 3.

Positively charged amino acids in region 536–544 are essential for CaV1.2 I-II linker targeting. A, immunofluorescence images of anti- FLAG-labeled deletion mutants as indicated and of GFP526–554. Staining of Δ536–554 was always intracellular but with a granular appearance. This was only very rarely seen with Δ526–554, which was typically of uniform distribution (cf. Fig. 2B). B, helical wheel representation of the proposed α-helix with positive charges indicated in blue. The 4 arginines important for membrane translocation are highlighted in blue with a yellow outline (A and B). C, schematic representation of positive residues (R and K) present in 526–554 sequence (CaV1.2 I-II linker). The four important arginines (Arg-537, Arg-538, Arg-541, and Arg-544) in amino acid sequence insert Δ544–554 and mutations (4R4A and 4R4E) in the CaV1.2 I-II linker are indicated. GFP-tagged 526–554 is also shown. Red, deletion in 544–554; yellow, 536–544; gray, α1-β subunit interaction site. D, putative phosphoinositide-binding domains of all LTCC I-II linkers are compared with published phosphoinositide-binding domains of Rit and K-Ras (22). All basic residues are marked in yellow, and ones that bind phosphoinositides are highlighted in red. E, immunofluorescence images of anti-FLAG-labeled charge neutralization linker mutants I-II 4R/4A and I-II 4R/4E (left), anti-V5-labeled C3S/C4Sβ2a (middle), and merged images (green, anti-FLAG-labeled I-II linkers; red, anti-V5-labeled C3S/C4Sβ2a) expressed in tsA-201 cells. Representative images from three independent experiments are shown. Scale bar, 10 μm.
Secondary structure analysis of the CaV1.2 I-II linker using PSIPRED (53) (not shown) predicted the region between amino acids 531 and 550 to form a polybasic amphipathic α-helix with 8 of the 9 positive charges (Fig. 3B) located on one side of the helix as shown in a helical wheel plot (Fig. 3B). This included four arginines (Arg-537, Arg-538, Arg-541, and Arg-544) located within the region 536–544 required for membrane translocation (Fig. 3C, yellow), all of which are conserved among the I-II linkers of LTCCs (Fig. 3D). To test whether these positive charges are essential for plasma membrane binding, we neutralized them by mutations to alanines (mutant I-II-4R4A) or converted them to negatively charged glutamates (mutant I-II-4R4E; Fig. 3C). As expected, both mutations prevented the plasma membrane binding of the CaV1.2 I-II linker and of the co-expressed C3S/C4Sβ2a subunits (Fig. 3E).
To assess whether this polybasic motif is sufficient to induce plasma membrane binding when attached to an otherwise cytoplasmic protein, we fused residues 526–554 to the C terminus of GFP (GFP526–554; Fig. 3, A and C). This construct localized to the plasma membrane (Fig. 3A). It also accumulated in the nucleus of the vast majority of transfected cells. Notably, a distinct feature of lipid-interacting polybasic membrane targeting motifs is their similarity to nuclear localization sequences (22), a property that may also account for the nuclear targeting of GFP526–554. However, nuclear staining did not obscure plasma membrane binding (see also Figs. 4A and 5B), and this was also confirmed in dividing cells in which nuclear staining was completely absent (Fig. 3A, GFP526–554, right panel; see also Fig. 5A). Taken together, these findings clearly demonstrate that positive charges at the C-terminal end of the CaV1.2 I-II linker form a plasma membrane binding motif sufficient for translocating the cytoplasmic I-II linker and fused GFP to the plasma membrane.
FIGURE 4.
Plasma membrane interaction of CaV1.2 I-II linker is not influenced by muscarinic receptor activation or rapamycin induced PIP or PIP2 depletion. A and B, mRFP-labeled PH-PLCδ and GFP-labeled β3 with untagged CaV1.2 I-II linker or mRFP-labeled PH-PLCδ and GFP-labeled 526–554 were co-expressed with untagged muscarinic M1 receptor in tsA-201 cells and subsequently treated with the M1 receptor agonist Oxo-M (10 μm). Fluorescence was visualized using live cell imaging, and images before (t = 0 s) and after (t = 5 s) the drug application were recorded. A, left, mRFP-labeled PH-PLCδ; right, GFP-labeled β3 in the same cells co-expressed with untagged CaV1.2 I-II linker and mRFP-labeled PH-PLCδ. B, left, mRFP-labeled PH-PLCδ; right, GFP-labeled peptide 526–554 in the same cells co-expressed with mRFP-labeled PH-PLCδ. Representative cells from three independent experiments are shown. C–F, cells co-transfected with Lyn11-FRB, RFP-pseudojanin, and GFP-PH-Osh2x2 or CaV1.2 I-II linker together with β3-GFP. Fluorescence was visualized before (t = 0 s) and after drug (t = 60 s) application. C and D, RFP-labeled pseudojanin (left) with GFP-labeled PH-Osh2x2 (right) as control before and after rapamycin treatment. Representative cells from eight independent experiments are shown. E, left, RFP-labeled pseudojanin; right, GFP-labeled β3, before and after rapamycin application. Representative cells from three independent experiments are shown. F, left, RFP-labeled pseudojanin; right, GFP-labeled β3 preincubated with wortmannin (before) and after the addition of rapamycin (after). Representative cells from three independent experiments are shown. Scale bar, 10 μm.
FIGURE 5.
Reversal of I-II linker-induced plasma membrane targeting due to phosphoinositide depletion accompanied by increased intracellular Ca2+ levels. A, mRFP-labeled PH-PLCδ and GFP-labeled 526–554 were co-expressed with untagged muscarinic M1 receptor in tsA-201 cells treated with the PLC activator m-3M3FBS (50 μm) together with wortmannin (20 μm); left, mRFP-labeled PH domain of PLCδ; right, GFP-labeled 526–554. Representative cells from three independent experiments are shown. B and C, different constructs were expressed in tsA-201 cells and subsequently treated with the PLC activator m-3M3FBS (50 μm) and additional ionomycin (5 μm). B, left, mRFP-labeled PH-PLCδ; middle, GFP-labeled β3-subunit co-expressed with CaV1.2 I-II linker; right, GFP-labeled peptide 526–554. The membrane-localized staining reversed by treatment is indicated by an arrow. Note that in the majority of cells, GFP526–554 also showed strong nuclear targeting (for an explanation, see “Results”), which was absent in dividing cells without distinct nuclei (Figs. 3A and 5A). C, GFP-labeled β2a alone. To quantify the relocation from the membrane, pixel intensity from three representative areas of interest within the membrane of each cell were background-corrected, and the membrane/cytoplasm ratio was calculated from the means obtained before (blue) and after (red) PLC activation. Means ± S.E. (error bars) are shown for the indicated number of cells. Paired Student's t test was used. **, p = 0.0049 (PH-PLCδ, m-3M3FBS + wortmannin, n = 3); ***, p = 0.00016 (peptide 526–554, m-3M3FBS + wortmannin, n = 3); **, p = 0.00427 (PH-PLCδ, m-3M3FBS + ionomycin, n = 15); **, p = 0.01087 (β3-subunit + CaV1.2 I-II linker, m-3M3FBS + ionomycin, n = 5); ***, p = 0.0010 (peptide 526–554, m-3M3FBS + ionomycin, n = 3); p = 0.81799 (β2a, m-3M3FBS + ionomycin, n = 6). Scale bar, 10 μm.
Involvement of Membrane Phosphoinositides in Plasma Membrane Targeting
The polybasic motif at the distal end of the I-II linker closely resembles clusters of positive charges found in other proteins, such as Rit and K-Ras (22) (Fig. 3D), and polybasic domains in other ion channels mediating protein-lipid interactions at the plasma membrane (for a review, see Ref. 13). We therefore hypothesized that this cluster of positive charges could serve a similar function. This notion was further supported by current folding models of Ca2+ channel α1-subunits, which position these charges near the cytoplasmic end of the transmembrane helix IIS1 (42), which, in turn, places them in close proximity to the anionic lipids of the inner leaflet of the plasma membrane.
Many modulatory lipid interactions of ion channels involve polyphosphoinositides (13). CaV1 and CaV2 VGCCs are modulated by metabotropic receptors through activation of PLC, also independently of direct G-protein modulation (16). Activation of M1 receptors induces a partial inhibition of Ca2+ inward currents mostly by membrane depletion of PIP2 in tsA-201 cells (16). This effect is mediated via activation of PLCβ (54). If binding of LTCC I-II linkers is dynamically regulated by interaction with PLC-metabolized polyphosphoinositides (primarily PIP2), then it should be reversed in a PLC-sensitive manner.
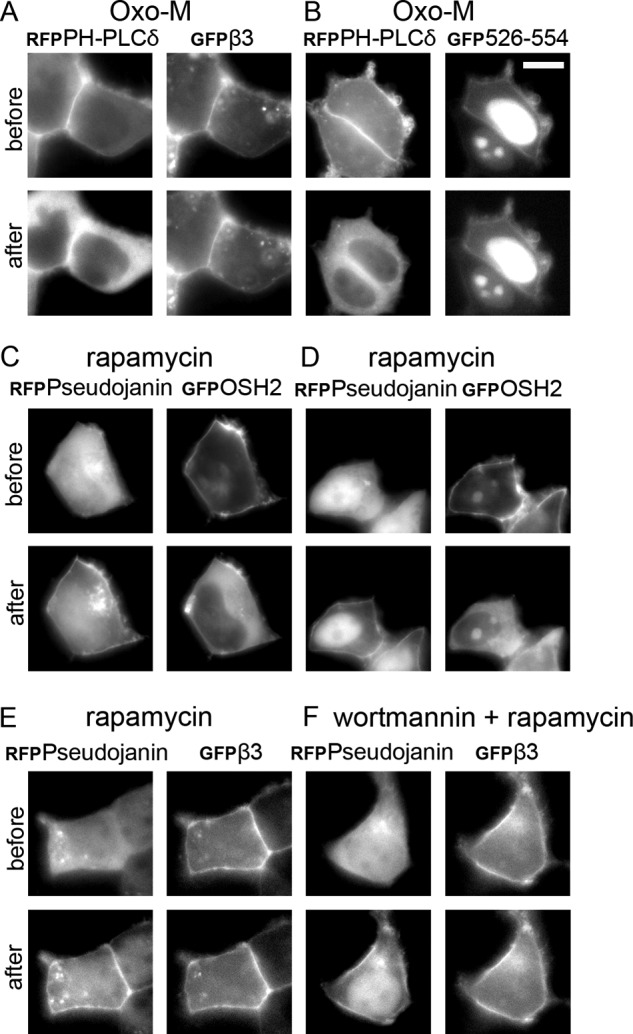
We therefore co-transfected tsA-201 cells with M1 receptors and examined effects on membrane binding of our constructs in response to receptor activation with oxotremorine M (Oxo-M) using live cell imaging (Fig. 4, A and B). The PIP2-specific mRFP-tagged pleckstrin homology domain of PLCδ (PH-PLCδ) served as positive control for monitoring PIP2 breakdown (55). Oxo-M induced the relocation of PH-PLCδ but did not reverse the plasma membrane association of I-II linker-bound β3-GFP (n = 3 independent experiments; Fig. 4A) or of GFP526–554 (n = 3; Fig. 4B). Translocation of membrane-bound β3-subunits was also absent in cells responding to co-transfected PH-PLCδ (n = 3), excluding a potential lack of Oxo-M action as a possible explanation. Even during prolonged observation times (10 min; not shown), no translocation was observed. As reported previously (55), Oxo-M-induced PIP2 depletion was transient, resulting in a relocation of the PIP and PIP2 biosensor GFP-PH-Osh2x2 (37) (5 of 21 cells) and PH-PLCδ (3 of 21 cells; not shown) within 2 min despite the continuous presence of Oxo-M. This is compatible with incomplete PIP/PIP2 depletion in mammalian cells by Oxo-M (55) under these experimental conditions.
Previous studies have shown that plasma membrane targeting of cytoplasmic proteins through cationic motifs resembling our polybasic sequence may also involve negatively charged lipids other than PIP2, in particular PIP3, PIP (22), or phosphatidylserine (21). We therefore used a rapamycin-inducible system (37) causing PIP and PIP2 depletion. Briefly, RFP-tagged pseudojanin (PJ), an enzymatic chimera that converts PIP2 to PIP and dephosphorylates PIP, was translocated from the cytosol to the plasma membrane upon rapamycin-induced Lyn11-FRB interaction. Translocation of PJ to the plasma membrane started 15.6 ± 3.12 s after rapamycin application and was completed after 30.4 ± 3.61 s in the control experiments (Fig. 4, C and D). This was followed by membrane dissociation of co-transfected GFP-PH-Osh2x2 (starting 29.6 ± 4.03 s after drug administration, completed after 57.1 ± 3.28 s; mean ± S.E., n = 24). Notably, in 13 of 24 cells, some residual membrane staining of GFP-PH-Osh2x2 still remained (Fig. 4C). When we co-transfected the rapamycin-inducible system and the I-II linker together with β3-GFP, PJ translocation started at 13.1 ± 1.43 s and was completed within 25.3 ± 1.07 s (mean ± S.E., n = 16) after rapamycin application. However, even after a prolonged recording time (20 min), we never observed a I-II linker-mediated translocation of β3-GFP to the cytoplasm (n = 16 cells; three independent experiments; Fig. 4E). We also combined the rapamycin-inducible system with wortmannin treatment. Preincubation with 20 μm wortmannin for 45–90 min before rapamycin application did not affect targeting of controls (PJ translocation started only upon rapamycin application after 20 ± 3.33 s, completion after 37.0 ± 5.17 s, n = 10) or linker-bound β3-GFP (n = 10, three independent experiments; Fig. 4F).
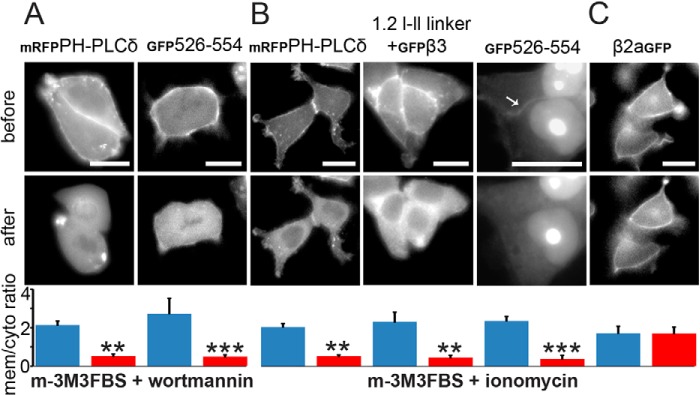
Earlier studies have shown very strong plasma membrane binding of similar polybasic targeting motifs of small GTPases, such as Rit or K-Ras (21, 22) (Fig. 3D) or the plasma membrane targeting domain of RasGRP1, a Ras-specific exchange factor (56). Their dissociation requires, in addition to phosphoinositide hydrolysis, either depletion of PI3K products (22, 56) or prolonged elevation of intracellular Ca2+ (21). Because neither the rapamycin-inducible system nor the Oxo-M response appears to induce complete phosphoinositide depletion and induces no or, in the case of Oxo-M, only a transient intracellular Ca2+ signal (55), we employed the PLC activator m-3M3FBS together with wortmannin to induce PIP, PIP2, and PIP3 depletion and inhibit PI3K. m-3M3FBS activates PLCβ, -γ, and -δ isoforms and also induces a prolonged intracellular Ca2+ release (55, 57). Application of 50 μm m-3M3FBS alone was not sufficient to induce translocation within our observation period. However, co-application of m-3M3FBS together with wortmannin caused a delayed translocation of PH-PLCδ (n = 4; Fig. 5A, left) as well as of GFP526–554 (n = 11 independent experiments; Fig. 5A, right) from the plasma membrane to the cytosol starting within a time frame of 20–30 min and completion in the following 7–10 min. This suggested a combined effect of intracellular Ca2+ (which acts as a PLC co-activator (55)) and lipid hydrolysis for slow translocation. Accordingly, the addition of 5 μm ionomycin together with m-3M3FBS (58) induced an even faster relocation of PH-PLCδ to the cytoplasm (Fig. 5B, left). Translocation started 1.9 ± 0.2 min (mean ± S.D., n = 15) after m-3M3FBS/ionomycin stimulation and was complete within 45–55 s. When we treated cells co-transfected with the I-II linker together with β3-subunits, PLC activation reversed the linker-mediated β3-GFP association with the plasma membrane (Fig. 5B, middle). Although cell to cell differences for the translocation time course after adding m-3M3FBS/ionomycin were observed, the translocation of β3-GFP and PH-PLCδ always occurred in parallel (n = 5 independent experiments; not shown). The GFP-tagged cationic peptide (GFP526–554) also redistributed to the cytoplasm under these experimental conditions (n = 3; Fig. 5B, right). In contrast, no translocation was observed in control experiments with β2aGFP subunits, which are anchored to the membrane through palmitoylation, known to be insensitive to polyphosphoinositide breakdown (n = 6; Fig. 5C). Taken together, our data demonstrate that polyphosphoinositide breakdown as well as increased intracellular Ca2+ levels are required for unbinding of the distal portion of the CaV1.2 I-II linker from the plasma membrane.
Role of the Polybasic Motif for CaV1.2 Channel Function and Modulation
Due to the close proximity of the polybasic motif to the membrane and its lipid-dependent interaction with the plasma membrane, our data strongly suggest that this interaction also occurs in the pore-forming α1-subunit of intact CaV1.2 channel complexes. We therefore introduced the mutations found to prevent membrane binding into the I-II linker constructs I-II-4R/4A and I-II-4R/4E (Fig. 3D) into the corresponding positions of the intact CaV1.2 α1-subunits and expressed these mutants (together with β3 and α2δ1) in tsA-201 cells. Mutation-induced changes of Ca2+ inward current (ICa) properties were then analyzed using whole-cell patch clamp experiments with Ca2+ as charge carrier. CaV1.2 α1-subunit channels undergo partial proteolytic processing, giving rise to a C-terminally long (CaV1.2L) and short (CaV1.2S) variants. Both variants exist in the heart and brain and exhibit different current properties (59, 60). In particular, CaV1.2S exhibits a higher open probability (59, 60). We therefore tested the effects of the I-II linker mutations in both variants (long, mutants CaV1.2L4A and CaV1.2L4E; short, mutants CaV1.2S4A and CaV1.2S4E).
All four mutant constructs conducted inward Ca2+ currents. Current-voltage relationships revealed a significant 6–10 mV shift of V0.5 in the hyperpolarizing direction for both mutants (Table 1 and Fig. 6A). This was due to a significant increase in the slope without changes in activation threshold (Table 1), suggesting more efficient coupling of pore opening to membrane depolarization. The mutations had little effect on the kinetics of ICa inactivation during 300-ms depolarizing pulses to the voltage corresponding to the peak of the I-V relationship (Table 2). The apparent reversal potential was also unchanged (Table 1). Differences between the mutants and wild-type channels were observed when we studied the relationship between the size of ON-gating charges (as a measure of active channels on the cell surface; enlarged ON-gating currents are shown in the insets of Fig. 6B) and the size of ionic tail currents (Fig. 6B). As shown by us and others previously, this ratio provides an estimate for the channel's open probability (61–63). The two wild-type constructs served as an internal control because a higher open probability was reported earlier for CaV1.2S (59, 61). This is evident as a statistically significant difference of the ITail/QON ratio in our experiments (Fig. 6B; see Table 1 for statistics). This is also evident from the steeper slopes of the regression lines of plots of ITail versus QON (Fig. 6C). In CaV1.2L, the 4R/4A mutation caused a 64% increase in the ITail/QON ratio. A similar increase was also observed in the CaV1.2S mutants despite higher basal open probability. An even larger effect was seen for the CaV1.2L4E and Cav1.2S4E mutants, which more than doubled the open probability. We also found that all four arginine mutant constructs significantly reduced QON in both CaV1.2L and CaV1.2S, with the reduction again more pronounced for the two 4R/4E mutations. Our data demonstrate that positive charges located in proximity to the transmembrane segment IIS1 within the I-II linker are important determinants of normal CaV1.2 Ca2+ channel function independent of the length of their C-terminal tails and basal open probabilities. The negative shift in V0.5 and higher open probability both indicate a tighter coupling between the voltage sensor and the pore. Based on our membrane targeting analysis, we propose that we have identified a site that is involved in the membrane lipid-dependent stabilization of channel function as well as the regulation of the expression of functional channels at the plasma membrane.
TABLE 1.
Biophysical properties of wild type and mutant CaV1.2L and CaV1.2S
Parameters are indicated as means ± S.E. for a given number of experiments (n). Statistical significances are indicated for comparisons of CaV1.2L versus CaV1.2L4A and CaV1.2L4E (a–aaa), CaV1.2S versus CaV1.2S4A and CaV1.2S4E (b–bbb) (one-way analysis of variance, CaV1.2L: V0.5 p < 0.0001, kact p < 0.0069, ITail/QON p < 0.0001; CaV1.2S: V0.5 p < 0.0016, kact p < 0.0216, Po p < 0.0001; with Bonferroni post-hoc test as indicated in the table), and CaV1.2L versus CaV1.2S (c–ccc) (unpaired Student's t test). Significance was defined as p < 0.05 (a, b, and c), p < 0.01 (aa, bb, and cc), and p < 0.001 (aaa, bbb, and ccc). For reliable calculation of QON, we omitted data from recordings in which QON was not larger than 4-fold the signal of noise (5 of a total of 79 recordings).
| CaV1.2 construct | V0.5 | Activation threshold | kact | Vrev | n | ITail/QON | QON mean (min; max) | n |
|---|---|---|---|---|---|---|---|---|
| mV | mV | mV | mV | ms−1 | pA*ms | |||
| Cav1.2L | 13.96 ± 1.64 | −31.58 ± 1.28 | 11.24 ± 0.45 | 77.08 ± 1.19 | 28 | 6.54 ± 0.47 | 260.5 (59.8; 565.4) | 19 |
| Cav1.2L4A | 3.47 ± 1.53aaa | −33.40 ± 0.80 | 9.62 ± 0.24a | 73.56 ± 1.28 | 12 | 10.73 ± 1.36aa | 127.5 (57.4; 224.7)a | 9 |
| Cav1.2L4E | 4.07 ± 1.90aa | −30.81 ± 1.59 | 9.30 ± 0.34a | 77.72 ± 2.16 | 11 | 14.00 ± 1.27aa | 100.4 (40.1; 317.8)aa | 9 |
| Cav1.2S | 7.03 ± 1.41cc | −32.09 ± 0.81 | 10.06 ± 0.38 | 77.20 ± 1.28 | 22 | 13.35 ± 1.46ccc | 266.2 (101.2; 674.7) | 12 |
| Cav1.2S4A | 0.77 ± 1.22bb | −32.63 ± 0.72 | 8.95 ± 0.28b | 76.69 ± 1.18 | 22 | 22.90 ± 2.21bb | 136.1 (46.4; 495.7)b | 14 |
| Cav1.2S4E | 1.31 ± 1.28bb | −31.92 ± 0.73 | 8.85 ± 0.34b | 74.46 ± 1.17 | 17 | 31.42 ± 2.07bbb | 76.4 (40.0; 172.0)bbb | 11 |
FIGURE 6.

Biophysical properties of wild-type and mutant CaV1.2L and CaV1.2S. Parameters and statistics are given in Table 1. A, normalized current-voltage (I-V) relationships of CaV1.2L (gray circles), CaV1.2L4A (blue triangles), and CaV1.2L4E (red squares) (left) and CaV1.2S (gray circles), CaV1.2S4A (blue triangles), and CaV1.2S4E (red squares) (right) measured by a 20-ms depolarization step to various test potentials using 15 mm Ca2+ as a charge carrier. Data points are represent means ± S.E. (error bars). Insets, representative traces for Cav1.2L (top left), Cav1.2L4E (bottom left), Cav1.2S (top right), and Cav1.2S4A (bottom right) for the indicated voltages. Note that at test potentials close to the V0.5 of wild-type channels, the mutant channels exhibit current amplitudes closer to Vmax due to a shift of the I-V relationship toward more negative voltages. B, representative current traces of CaV1.2L (top left) versus CaV1.2L4E (top right) and CaV1.2S (bottom left) versus CaV1.2S4A (bottom right) obtained by depolarizing the cell from −90 mV to Vrev. Insets, enlarged QON of the traces. C, correlation of QON (area) with maximum tail current amplitude (ITail) measured at Vrev for wild-type and mutant Cav1.2S. The color code is as in A. The following slopes were obtained by linear regression analysis: −12.2 ± 1.13 for Cav1.2S (R2 = 0.64), −17.2 ± 1.14 for Cav1.2S4A (R2 = 0.82), −27.7 ± 1.73 for Cav1.2S4E (R2 = 0.70). Slopes were significantly different for each data set (p < 0.0001; F-test: F (DFn, DFd) = 15.6 (2, 34)) as well as for Cav1.2L and corresponding mutants (p < 0.0001; not shown).
TABLE 2.
Inactivation properties of wild-type and mutant CaV1.2L and CaV1.2S
Cells were depolarized for 300 ms from a holding potential of −90 mV to Vmax. R values represent the remaining fraction of ICa (15 mm) after 50, 100, or 250 ms. Parameters are indicated as means ± S.E. for a given number of experiments (n). Statistical significances are indicated for comparisons of CaV1.2L versus CaV1.2L4A and CaV1.2L4E (a) (one-way analysis of variance with Bonferroni post-hoc test as indicated in the table) and CaV1.2L versus CaV1.2S (b and bb, unpaired Student's t test). Significance was defined as p < 0.05 (a and b) and p < 0.01 (bb).
| CaV1.2 construct | R50 | R100 | R250 | n |
|---|---|---|---|---|
| % | % | % | ||
| Cav1.2L | 65.01 ± 2.51 | 49.39 ± 2.61 | 32.54 ± 2.02 | 7 |
| Cav1.2L4A | 60.77 ± 2.05 | 46.83 ± 2.23 | 33.16 ± 2.34 | 7 |
| Cav1.2L4E | 56.96 ± 1.67a | 42.60 ± 2.43 | 29.83 ± 1.64 | 7 |
| Cav1.2S | 52.86 ± 2.37bb | 37.09 ± 2.02bb | 24.72 ± 2.02b | 13 |
| Cav1.2S4A | 50.63 ± 2.57 | 36.32 ± 2.31 | 26.48 ± 2.18 | 13 |
| Cav1.2S4E | 52.28 ± 2.46 | 38.55 ± 2.36 | 27.22 ± 2.14 | 13 |
We also tested whether the arginine mutations in CaV1.2S4E (versus CaV1.2S as wild-type control) affect the time-dependent decline of whole-cell ICa and the modulation by added PIP2 (by intracellular application of a 100 μm concentration of the water-soluble PIP2 analogue diC8-PIP2, (15, 64)) or phosphoinositide hydrolysis induced by wortmannin (20 μm) plus m-3M3FBS (50 μm) as in live cell imaging experiments (Fig. 5A). Perfusion of cells with control solution induced a slow decrease in activity with time (“run-down”), as expected for Cav1.2 channels (65). ICa decline during perfusion with control solution was similar in wild-type and the mutant channel and was also not affected by intracellular application of diC8-PIP2 (Fig. 7). However, extracellular perfusion with wortmannin/m-3M3FBS significantly inhibited ICa of wild-type and Cav1.24E channels, but this current inhibition was significantly attenuated in the mutant channel (Fig. 7). This indicates that membrane association of the distal I-II linker through its positive charges not only stabilizes a more reluctant channel state (Fig. 6) but also weakens inhibition of channel activity by phosphoinositide depletion.
FIGURE 7.

Modulation of Cav1.2S and Cav1.2S4E currents by wortmannin/m-3M3FBS or diC8-PIP2 treatment. A, Cav1.2S, perfused with bath solution (control; gray circles; data are shown for seven cells; due to different recording duration, means ± S.E. reflect n = 7 until 410 s, n = 6 until 450 s), 100 μm intracellular diC8-PIP2 (gray triangles; means ± S.E., n = 4), or extracellular 20 μm wortmannin and 50 μm m-3M3FBS (black squares; means ± S.E. for n = 8 until 280 s, n = 3 until 450 s). B, Cav1.2S4E, control (red circles; n = 9 cells until 440 s, n = 8 cells until 450 s), 100 μm intracellular diC8 (red triangles; n = 4 until 420 s, n = 3 until 450 s), or extracellular 20 μm wortmannin and 50 μm m-3M3FBS (white squares; n = 8 until 320 s, n = 6 until 450 s). Statistical analysis was performed using two-way analysis of variance of all data sets followed by Bonferroni post hoc test. Wortmannin/m-3M3FBS treatment significantly enhanced current decrease over time for both constructs (a, p < 0.01 after 100 s and p < 0.001 after 120 s for Cav1.2S; b, p < 0.05 after 140 s and p < 0.001 after 170 s for Cav1.2S4E). The wortmannin/m-3M3FBS response was significantly attenuated in Cav1.2S4E versus wild type (c, p < 0.05 after 260 s, p < 0.01 or p < 0.001 after 330 s). DiC8-PIP2 treatment had no effect and was also not different between wild type and mutant Cav1.2. Because current underwent some minor initial run-up, time 0 was set when the currents reached a stable maximum (1.5–2 min after start of perfusion) to which current amplitudes were normalized. C, percentage of remaining current of Cav1.2S and Cav1.2S4E in control-, diC8-, or wortmannin/m-3M3FBS (W/FBS)-treated cells after different time points. Data are shown as mean ± S.E. (error bars). Statistical significance at the indicated time points was taken from the statistical analysis described above. *, p < 0.05; **, p < 0.01; ***, p < 0.001.
Structural Modeling of the Domain I-II Linker Region of CaV1.2 Channel
To further explore the conformation of this distal domain I-II linker region of the CaV1.2 channel (corresponding to residues 536–554 containing the polybasic cluster), its interaction with the inner leaflet of the membrane bilayer, and potential changes introduced by charge neutralizations, we applied the Rosetta membrane method (39–41) and the x-ray structure of the voltage-sensing domain of a recently crystallized bacterial voltage-gated Na+ channel, NaVAb (Fig. 8A) as described under “Experimental Procedures.” The best models of the native CaV1.2 channel revealed convergence between the top cluster model (the most frequently sampled conformation) and the 10 lowest energy models (Fig. 8B). In those models, the distal I-II linker forms a straight helix in which arginine residues are oriented away from the hydrophobic layer of the membrane (lines in Fig. 8) and are therefore in a favorable position for possible interactions with lipid phosphate groups (Fig. 8C). Large hydrophobic residues in the domain I-II linker region are oriented toward the hydrophobic layer of the membrane, which is in good agreement with their favorable environment based on analysis of available membrane protein structures (Fig. 8D). The best models of the domain I-II linker arginines mutated to alanines or glutamates are shown in Fig. 8, E and F. Unlike in wild-type models, there is no convergence among any of the top cluster models and the best scoring models. Our model suggests that native arginines in the distal I-II linker strongly favor straight helix conformation, positioning it entirely at the interface between the hydrocarbon core and lipid head groups.
Based on Rosetta predictions, the alanine mutations clearly disturb this conformation, making the helical region structurally unstable. We therefore suggest that alanine and glutamate mutations in the domain I-II linker not only affect its plasma membrane binding but also disturb secondary structure, leading to altered positioning of the domain I-II linker helix near the membrane-spanning helices of repeat II.
Discussion
We describe the identification of a polybasic motif within the I-II linker of the pore-forming α1-subunit of voltage-gated CaV1.2 L-type Ca2+ channels with biochemical features that allow its attachment to the inner leaflet of the plasma membrane via interaction with negatively charged phospholipids. First, we demonstrate that the I-II linkers of all four LTCC isoforms bind to the plasma membrane in living cells (Fig. 1). This enables this polypeptide to translocate large complexes of cytoplasmic proteins to the plasma membrane (different β-subunits, Rab3-interacting molecule in complex with β-subunits (49)). Second, this interaction is reversible upon pharmacological activation of PLC together with either Ca2+ as an additional PLC activator (66) or with wortmannin (Fig. 5), which prevents resynthesis of polyphosphoinositides (22). Under both activating conditions, the time course of membrane unbinding of the I-II linker closely follows the time course of unbinding of the PIP2-selective sensor PH-PLCδ. No such translocation was found for β2a-subunits, which are membrane-anchored through their palmitoic acid side chain and thus insensitive to PLCs. Together, these findings provide strong experimental evidence that binding of the I-II linker through this polybasic motif to the plasma membrane also involves interaction with polyphosphoinositides. Third, the primary structure of our lipid-binding motif has the characteristics of previously reported polybasic motifs implicated in polyphosphoinositide-interactions of other ion channels or of small GTPases, such as Rit and K-Ras (Fig. 3C) (22). The polybasic motifs of these proteins are sufficient for their plasma membrane targeting. Similar to our motif, the removal of only a few residues in Rit was sufficient to completely prevent translocation (3 in Rit, 4 in the I-II linker) (22). Moreover, positively charged clusters required for interaction with membrane lipids have recently also been identified in the auxiliary β2e subunit of VGCC (67).
Using de novo molecular modeling, we predict this membrane binding motif to form a straight α-helix positioned entirely at the interface between the hydrocarbon core and lipid headgroups, with the positive charges facing the lipid phosphates. Moreover, according to the model, the four arginines not only support plasma membrane binding of the I-II linker but are also necessary to stabilize this secondary structure in the context of the membrane environment. This stabilization may also explain the functional changes we observed. We demonstrate that the four basic residues are by themselves determinants of CaV1.2 Ca2+ channel function. In two different CaV1.2 α1-subunit variants with distinct intrinsic open probabilities (61), neutralization of these charges enhanced CaV1.2-mediated inward currents resulting from increased tail Ca2+ currents relative to total ON-gating charge. In addition, these mutations also shifted half-maximal activation to more negative potentials by increasing the slope of the current-voltage relationship. Both observations indicate that charge neutralization (or conversion) enhances the coupling between voltage sensing and pore opening. This is in accordance with the previous finding that the I-II linker encodes self-reliant molecular motifs for channel activation independent of β-subunits (68, 69). Our data show that residues remote from the β-subunit interaction site in the I-II linker are required for stabilization of normal CaV1.2 channel function. Although only crystallization studies such as those recently described for Kir2.2 and GIRK2 K+ channels (23, 24) can ultimately confirm the direct interaction of channel domains with membrane lipids, our data provide strong evidence that the polybasic motif described here constitutively stabilizes channel function through membrane lipid binding. In addition, we also found that charge neutralization and conversion also reduced QON, revealing a reduction of functional channels at the plasma membrane. This strongly indicates that the interaction of this basic motif with negatively charged membrane lipids is also important for regulating the expression of functional Cav1.2 channels at the membrane surface.
Previous studies have identified other potential PIP2 interaction sites within VGCC α1-subunits. Mutation of Ile-1520 in segment IIIS6 of the CaV2.1 α1-subunit reduced current run-down attributed to PIP2 depletion (70), thus proposing a channel-stabilizing PIP2 interaction with a region close to the pore. The C terminus of the CaV2.1 α1-subunit has also been implicated in a PIP2-dependent regulation of the direct (and voltage-dependent) inhibition of CaV2.1 channels by receptor-mediated G-protein activation. Evidence has been provided that this could be due to PIP2-mediated interaction with the plasma membrane because the C-terminal channel fragment showed binding to polyphosphoinositide strips in vitro (71). However, the polybasic cluster implicated in this interaction is not present in the C termini of LTCCs.
So far, we could not obtain evidence that the polybasic binding motif identified here is also important for the dynamic regulation of channel function by physiological modulatory pathways inducing phospholipid breakdown. Although we can show breakdown of PIP2 in our transfected cells by activation of M1 receptors robust enough to induce cytoplasmic relocation of the PIP2-selective probe PH-PLCδ, this did not result in relocation of our I-II linker constructs. In electrophysiological studies, Oxo-M stimulation of tsA-201 cells transfected with M1 receptors and CaV1.2 induces a 33–60% inhibition of Ba2+ currents through CaV1.2 (16), and more than half of this modulation is dependent on PIP2. This is compatible with models predicting that under these experimental conditions, 1–7% of the total PIP2 and 12–40% of PIP remain non-hydrolyzed in these cells (55). This may be sufficient for maintaining the binding of the I-II linker during stimulation with Oxo-M. Indeed, it is known from studies with proteins containing polybasic targeting motifs, similar to the one described here in the I-II linker, that efficient plasma membrane unbinding requires more than just PIP2 hydrolysis. The GTPases Rit and K-Ras require complete depletion of both PIP2 and PIP or PI3K products. Binding still persists when only one of them is depleted (22, 37). This is also in accordance with a previous study that observed that complete loss of the binding of the RasGRP1 plasma membrane targeting domain only occurred after combined treatment with the PLC activator m-3M3FBS and wortmannin and not with m-3M3FBS alone (56). In our experiments, dissociation of the CaV1.2 I-II linker from the plasma membrane was also achieved by combining m-3M3FBS with ionomycin-induced Ca2+ increase. This suggests that Ca2+ also plays a role in this mechanism. Thus, it requires a second mechanism that either further enhances polyphosphoinositide breakdown (wortmannin) or a strong intracellular Ca2+ signal.
The requirement of Ca2+ could also indicate that PLCδ or phosphatidylserine plays a major role in reversing the plasma membrane targeting of the Cav1.2 I-II linker. PLCδ is mainly activated by an increase in intracellular Ca2+ levels (10–100 nm), usually due to prior activation of other PLCs (72–74). Moreover, it has been shown that sustained Ca2+ increase can cause phosphatidylserine externalization (75). The observed translocation of the I-II linker upon m-3M3FBS and ionomycin application could therefore also be due to dissociation from the negatively charged phosphatidylserine. Hence, we propose that the I-II linker can interact with phosphoinositides as well as with phosphatidylserine, which has also been reported for RasGRP1 plasma membrane targeting (56). Independent of the exact mechanism, our biochemical studies provide evidence for a strong and constitutive binding of the polybasic membrane binding motif identified here, which may involve different negatively charged phospholipids.
The observation of facilitated gating and enhanced Ca2+ influx in our channel mutants is unexpected because recent work (76) has demonstrated inhibition of channel activity by M1 receptor-activated PIP2 breakdown. We were unable to test the effects of our mutations on M1 receptor-induced channel inhibition because the co-transfection was toxic for the cells and precluded their use in patch clamp recordings. Instead, we show that inducing phosphoinositide breakdown by treatment of cells with wortmannin and the PLC activator m-3M3FBS causes the expected inhibition of current amplitude but that this response is significantly attenuated by disruptive mutations in the polybasic motif as shown for Cav1.2S4E (Fig. 7). This further supports our interpretation that this membrane binding motif not only stabilizes a more reluctant gating mode but also supports moderation of channel activity by lipid breakdown once targeted to the plasma membrane.
The lipid-binding motif described here is positioned on the C-terminal end of the I-II linker. In contrast to the N-terminal half of the linker, this region has not previously been implicated in the control of Ca2+ channel function. The β-subunit tightly binds to a conserved motif within the N-terminal half of the I-II linker. X-ray crystallography and mutational studies (77–79) revealed that an α-helix between the AID (and its bound β-subunit) and IS6 provides a rigid connection to the channel pore and thereby crucially determines the voltage- and Ca2+-dependent gating properties of the channel. In CaV2 channels, direct G-protein modulation is also mediated by Gβγ interaction in this region (77, 80). In contrast to this proximal region, no x-ray structure could be obtained C-terminal to the AID in a recent x-ray crystallographic study of the I-II linker in complex with β-subunit (77). Our data suggest that also this portion of the I-II linker forms an α-helix and that its interaction with membrane lipids plays a crucial role in stabilizing the channel conformation. This conformational stabilization may be transmitted either upstream through the I-II linker to the pore (IS6) or downstream through IIS1 to the voltage sensor of the repeat II, or both, and thereby control channel gating.
Based on recent genetic findings that already small changes in LTCC functions underlie human diseases (81), this polybasic motif may also be a target for human disease-causing mutations. Further studies must therefore investigate the consequences of single charge neutralizations within this motif as well as the role of adjacent positively charged residues for membrane binding and channel function.
Author Contributions
G. K. and J. S. conceived the study. G. K. designed, performed, and analyzed the experiments shown in Figs. 1, 2, 3, and 5. A. P. designed, performed, and analyzed the experiments shown in Fig. 4. A. P., N. J. O., and A. L. designed, performed, and analyzed the experiments shown in Figs. 6 and 7. V. Y.-Y. designed, performed, and analyzed the experiments shown in Fig. 8. M. S.-B. supervised some of the cloning experiments. G. J. O. and B. E. F. supervised live cell imaging. G. K., A. P., and J. S. wrote the paper with input from all authors. J. S. coordinated the study. All authors critically evaluated the results and approved the final version of the manuscript.
Acknowledgments
We thank Gabriella Bock for help with electrophysiological experiments; Jennifer Müller and Gospava Stojanovic for excellent technical assistance; Stefan Böhm and Michiel Langeslag for helpful discussion regarding PLC activation experiments; Benedikt Nimmervoll and Stephan Geley for help with live cell imaging experiments; Anja Scharinger for technical advice; Kees Jalink for providing PH-PLCδ1; Dominik Oliver and Gerald Hammond for providing Lyn11-FRB, mRFP-FKBP-pseudojanin, and GFP-PH-Osh2x2; and Edward Perez-Reyes for providing rat β3- and β2a-subunit cDNAs.
This work was supported by Austrian Science Fund Grants F44020, F44060, and W1101 and the University of Innsbruck. The authors declare that they have no conflicts of interest with the contents of this article.
- LTCC
- L-type voltage-gated Ca2+ channel
- AID
- α-interaction domain
- diC8-PIP2
- phosphatidylinositiol 4,5-bisphosphate-diC8
- ICa
- Ca2+ current
- IP3
- inositol-3-phosphate
- ITail
- ionic tail current
- kact
- activation slope
- LCI
- live cell imaging
- M1 receptor
- muscarinic 1 receptor
- Oxo-M
- oxotremorine M
- PIP
- phosphatidylinositol 4-phosphate
- PIP2
- phosphatidylinositiol 4,5-bisphosphate
- PIP3
- phosphatidylinositiol 3,4,5-trisphosphate
- PJ
- pseudojanin
- PLC
- phospholipase C
- QON
- ON-gating charge movement
- V0.5
- half-maximal activation voltage
- VGCC
- voltage-gated Ca2+ channels
- Vrev
- reversal potential
- VSD
- voltage sensor domain
- PH
- pleckstrin homology
- EGFP
- enhanced GFP
- mRFP
- monomeric RFP.
References
- 1. Catterall W. A. (2011) Voltage-gated calcium channels. Cold Spring Harb. Perspect. Biol. 3, a003947. [DOI] [PMC free article] [PubMed] [Google Scholar]
- 2. Striessnig J., Pinggera A., Kaur G., Bock G., Tuluc P. (2014) L-type calcium channels in heart and brain. Wiley Interdiscip. Rev. Membr. Transp. Signal. 3, 15–38 [DOI] [PMC free article] [PubMed] [Google Scholar]
- 3. Liao P., Yong T. F., Liang M. C., Yue D. T., Soong T. W. (2005) Splicing for alternative structures of Cav1.2 calcium channels in cardiac and smooth muscles. Cardiovasc. Res. 68, 197–203 [DOI] [PubMed] [Google Scholar]
- 4. Lipscombe D., Pan J. Q., Gray A. C. (2002) Functional diversity in neuronal voltage-gated calcium channels by alternative splicing of Cavα1. Mol. Neurobiol. 26, 21–44 [DOI] [PubMed] [Google Scholar]
- 5. Lipscombe D. (2005) Neuronal proteins custom designed by alternative splicing. Curr. Opin. Neurobiol. 15, 358–363 [DOI] [PubMed] [Google Scholar]
- 6. Peterson B. Z., DeMaria C. D., Adelman J. P., Yue D. T. (1999) Calmodulin is the calcium sensor for calcium-dependent inactivation of L-type calcium channels. Neuron 22, 549–558 [DOI] [PubMed] [Google Scholar]
- 7. Grueter C. E., Abiria S. A., Dzhura I., Wu Y., Ham A. J., Mohler P. J., Anderson M. E., Colbran R. J. (2006) L-type Ca2+ channel facilitation mediated by phosphorylation of the β subunit by CaMKII. Mol. Cell 23, 641–650 [DOI] [PubMed] [Google Scholar]
- 8. Hulme J. T., Westenbroek R. E., Scheuer T., Catterall W. A. (2006) Phosphorylation of serine 1928 in the distal C-terminal domain of cardiac Cav1.2 channels during β1-adrenergic regulation. Proc. Natl. Acad. Sci. U.S.A. 103, 16574–16579 [DOI] [PMC free article] [PubMed] [Google Scholar]
- 9. Fu Y., Westenbroek R. E., Scheuer T., Catterall W. A. (2014) Basal and β-adrenergic regulation of the cardiac calcium channel Cav1.2 requires phosphorylation of serine 1700. Proc. Natl. Acad. Sci. U.S.A. 111, 16598–16603 [DOI] [PMC free article] [PubMed] [Google Scholar]
- 10. Doering C. J., McRory J. E. (2007) Effects of extracellular pH on neuronal calcium channel activation. Neuroscience 146, 1032–1043 [DOI] [PubMed] [Google Scholar]
- 11. De Waard M., Liu H., Walker D., Scott V. E., Gurnett C. A., Campbell K. P. (1997) Direct binding of G-protein βγ complex to voltage-dependent calcium channels. Nature 385, 446–450 [DOI] [PubMed] [Google Scholar]
- 12. Roberts-Crowley M. L., Mitra-Ganguli T., Liu L., Rittenhouse A. R. (2009) Regulation of voltage-gated Ca2+ channels by lipids. Cell Calcium 45, 589–601 [DOI] [PMC free article] [PubMed] [Google Scholar]
- 13. Suh B. C., Hille B. (2008) PIP2 is a necessary cofactor for ion channel function: how and why? Annu. Rev. Biophys. 37, 175–195 [DOI] [PMC free article] [PubMed] [Google Scholar]
- 14. Wu L., Bauer C. S., Zhen X. G., Xie C., Yang J. (2002) Dual regulation of voltage-gated calcium channels by PtdIns(4,5)P2. Nature 419, 947–952 [DOI] [PubMed] [Google Scholar]
- 15. Gamper N., Reznikov V., Yamada Y., Yang J., Shapiro M. S. (2004) Phosphatidylinositol 4,5-bisphosphate signals underlie receptor-specific Gq/11-mediated modulation of N-type Ca2+ channels. J. Neurosci. 24, 10980–10992 [DOI] [PMC free article] [PubMed] [Google Scholar]
- 16. Suh B. C., Leal K., Hille B. (2010) Modulation of high-voltage activated Ca2+ channels by membrane phosphatidylinositol 4,5-bisphosphate. Neuron 67, 224–238 [DOI] [PMC free article] [PubMed] [Google Scholar]
- 17. Suh B. C., Kim D. I., Falkenburger B. H., Hille B. (2012) Membrane-localized β-subunits alter the PIP2 regulation of high-voltage activated Ca2+ channels. Proc. Natl. Acad. Sci. U.S.A. 109, 3161–3166 [DOI] [PMC free article] [PubMed] [Google Scholar]
- 18. Hermosilla T., Moreno C., Itfinca M., Altier C., Armisén R., Stutzin A., Zamponi G. W., Varela D. (2011) L-type calcium channel β subunit modulates angiotensin II responses in cardiomyocytes. Channels 5, 280–286 [DOI] [PubMed] [Google Scholar]
- 19. Roberts-Crowley M. L., Rittenhouse A. R. (2009) Arachidonic acid inhibition of L-type calcium (Cav1.3b) channels varies with accessory Cavβ subunits. J. Gen. Physiol. 133, 387–403 [DOI] [PMC free article] [PubMed] [Google Scholar]
- 20. Michailidis I. E., Zhang Y., Yang J. (2007) The lipid connection-regulation of voltage-gated Ca2+ channels by phosphoinositides. Pflugers Arch. 455, 147–155 [DOI] [PubMed] [Google Scholar]
- 21. Yeung T., Gilbert G. E., Shi J., Silvius J., Kapus A., Grinstein S. (2008) Membrane phosphatidylserine regulates surface charge and protein localization. Science 319, 210–213 [DOI] [PubMed] [Google Scholar]
- 22. Heo W. D., Inoue T., Park W. S., Kim M. L., Park B. O., Wandless T. J., Meyer T. (2006) PI(3,4,5)P3 and PI(4,5)P2 lipids target proteins with polybasic clusters to the plasma membrane. Science 314, 1458–1461 [DOI] [PMC free article] [PubMed] [Google Scholar]
- 23. Hansen S. B., Tao X., MacKinnon R. (2011) Structural basis of PIP2 activation of the classical inward rectifier K+ channel Kir2.2. Nature 477, 495–498 [DOI] [PMC free article] [PubMed] [Google Scholar]
- 24. Whorton M. R., MacKinnon R. (2011) Crystal structure of the mammalian GIRK2 K+ channel and gating regulation by G proteins, PIP2, and sodium. Cell 147, 199–208 [DOI] [PMC free article] [PubMed] [Google Scholar]
- 25. Hille B., Dickson E. J., Kruse M., Vivas O., Suh B. C. (2015) Phosphoinositides regulate ion channels. Biochim. Biophys. Acta 1851, 844–856 [DOI] [PMC free article] [PubMed] [Google Scholar]
- 26. Altier C., Garcia-Caballero A., Simms B., You H., Chen L., Walcher J., Tedford H. W., Hermosilla T., Zamponi G. W. (2011) The Cavβ subunit prevents RFP2-mediated ubiquitination and proteasomal degradation of L-type channels. Nat. Neurosci. 14, 173–180 [DOI] [PubMed] [Google Scholar]
- 27. Hilgemann D. W. (2012) Fitting K(V) potassium channels into the PIP(2) puzzle: Hille group connects dots between illustrious HH groups. J. Gen Physiol. 140, 245–248 [DOI] [PMC free article] [PubMed] [Google Scholar]
- 28. Horton R. M., Hunt H. D., Ho S. N., Pullen J. K., Pease L. R. (1989) Engineering hybrid genes without the use of restriction enzymes: gene splicing by overlap extension. Gene 77, 61–68 [DOI] [PubMed] [Google Scholar]
- 29. Long J. Z., Lackan C. S., Hadjantonakis A. K. (2005) Genetic and spectrally distinct in vivo imaging: embryonic stem cells and mice with widespread expression of a monomeric red fluorescent protein. BMC Biotechnol. 5, 20. [DOI] [PMC free article] [PubMed] [Google Scholar]
- 30. Obermair G. J., Kugler G., Flucher B. E. (2004) The role of the calcium channel α2 δ-1 subunit in skeletal muscle. J. Muscle Res. Cell Motil. 25, 239–240 [DOI] [PubMed] [Google Scholar]
- 31. Obermair G. J., Schlick B., Di Biase V., Subramanyam P., Gebhart M., Baumgartner S., Flucher B. E. (2010) Reciprocal interactions regulate targeting of calcium channel β subunits and membrane expression of α1 subunits in cultured hippocampal neurons. J. Biol. Chem. 285, 5776–5791 [DOI] [PMC free article] [PubMed] [Google Scholar]
- 32. Dayal A., Bhat V., Franzini-Armstrong C., Grabner M. (2013) Domain cooperativity in the β1a subunit is essential for dihydropyridine receptor voltage sensing in skeletal muscle. Proc. Natl. Acad. Sci. U.S.A. 110, 7488–7493 [DOI] [PMC free article] [PubMed] [Google Scholar]
- 33. Campiglio M., Di Biase V., Tuluc P., Flucher B. E. (2013) Stable incorporation versus dynamic exchange of β subunits in a native Ca2+ channel complex. J. Cell Sci. 126, 2092–2101 [DOI] [PMC free article] [PubMed] [Google Scholar]
- 34. van der Wal J., Habets R., Várnai P., Balla T., Jalink K. (2001) Monitoring agonist-induced phospholipase C activation in live cells by fluorescence resonance energy transfer. J. Biol. Chem. 276, 15337–15344 [DOI] [PubMed] [Google Scholar]
- 35. Grabner M., Dirksen R. T., Beam K. G. (1998) Tagging with green fluorescent protein reveals a distinct subcellular distribution of L-type and non-L-type calcium channels expressed in dysgenic myotubes. Proc. Natl. Acad. Sci. U.S.A. 95, 1903–1908 [DOI] [PMC free article] [PubMed] [Google Scholar]
- 36. Lindner M., Leitner M. G., Halaszovich C. R., Hammond G. R., Oliver D. (2011) Probing the regulation of TASK potassium channels by PI4,5P(2) with switchable phosphoinositide phosphatases. J. Physiol. 589, 3149–3162 [DOI] [PMC free article] [PubMed] [Google Scholar]
- 37. Hammond G. R., Fischer M. J., Anderson K. E., Holdich J., Koteci A., Balla T., Irvine R. F. (2012) PI4P and PI(4,5)P2 are essential but independent lipid determinants of membrane identity. Science 337, 727–730 [DOI] [PMC free article] [PubMed] [Google Scholar]
- 38. Ortner N. J., Bock G., Vandael D. H., Mauersberger R., Draheim H. J., Gust R., Carbone E., Tuluc P., Striessnig J. (2014) Pyrimidine-2,4,6-triones are a new class of voltage-gated L-type Ca2+ channel activators. Nat. Commun. 5, 3897. [DOI] [PMC free article] [PubMed] [Google Scholar]
- 39. Barth P., Schonbrun J., Baker D. (2007) Toward high-resolution prediction and design of transmembrane helical protein structures. Proc. Natl. Acad. Sci. U.S.A. 104, 15682–15687 [DOI] [PMC free article] [PubMed] [Google Scholar]
- 40. Yarov-Yarovoy V., Schonbrun J., Baker D. (2006) Multipass membrane protein structure prediction using Rosetta. Proteins 62, 1010–1025 [DOI] [PMC free article] [PubMed] [Google Scholar]
- 41. Yarov-Yarovoy V., Baker D., Catterall W. A. (2006) Voltage sensor conformations in the open and closed states in ROSETTA structural models of K+ channels. Proc. Natl. Acad. Sci. U.S.A. 103, 7292–7297 [DOI] [PMC free article] [PubMed] [Google Scholar]
- 42. Payandeh J., Scheuer T., Zheng N., Catterall W. A. (2011) The crystal structure of a voltage-gated sodium channel. Nature 475, 353–358 [DOI] [PMC free article] [PubMed] [Google Scholar]
- 43. Hildebrand A., Remmert M., Biegert A., Söding J. (2009) Fast and accurate automatic structure prediction with HHpred. Proteins 77, 128–132 [DOI] [PubMed] [Google Scholar]
- 44. Söding J., Biegert A., Lupas A. N. (2005) The HHpred interactive server for protein homology detection and structure prediction. Nucleic Acids Res. 33, W244–W248 [DOI] [PMC free article] [PubMed] [Google Scholar]
- 45. Wang C., Bradley P., Baker D. (2007) Protein-protein docking with backbone flexibility. J. Mol. Biol. 373, 503–519 [DOI] [PubMed] [Google Scholar]
- 46. Yarov-Yarovoy V., DeCaen P. G., Westenbroek R. E., Pan C. Y., Scheuer T., Baker D., Catterall W. A. (2012) Structural basis for gating charge movement in the voltage sensor of a sodium channel. Proc. Natl. Acad. Sci. U.S.A. 109, E93–E102 [DOI] [PMC free article] [PubMed] [Google Scholar]
- 47. Bonneau R., Strauss C. E., Rohl C. A., Chivian D., Bradley P., Malmström L., Robertson T., Baker D. (2002) De novo prediction of three-dimensional structures for major protein families. J. Mol. Biol. 322, 65–78 [DOI] [PubMed] [Google Scholar]
- 48. Pettersen E. F., Goddard T. D., Huang C. C., Couch G. S., Greenblatt D. M., Meng E. C., Ferrin T. E. (2004) UCSF Chimera: a visualization system for exploratory research and analysis. J. Comput. Chem. 25, 1605–1612 [DOI] [PubMed] [Google Scholar]
- 49. Gebhart M., Juhasz-Vedres G., Zuccotti A., Brandt N., Engel J., Trockenbacher A., Kaur G., Obermair G. J., Knipper M., Koschak A., Striessnig J. (2010) Modulation of Cav1.3 Ca2+ channel gating by Rab3 interacting molecule. Mol. Cell Neurosci. 44, 246–259 [DOI] [PubMed] [Google Scholar]
- 50. Takahashi S. X., Miriyala J., Tay L. H., Yue D. T., Colecraft H. M. (2005) A CaVbeta SH3/guanylate kinase domain interaction regulates multiple properties of voltage-gated Ca2+ channels. J. Gen. Physiol. 126, 365–377 [DOI] [PMC free article] [PubMed] [Google Scholar]
- 51. Van Petegem F., Clark K. A., Chatelain F. C., Minor D. L., Jr. (2004) Structure of a complex between a voltage-gated calcium channel β-subunit and an α-subunit domain. Nature 429, 671–675 [DOI] [PMC free article] [PubMed] [Google Scholar]
- 52. Leroy J., Richards M. S., Butcher A. J., Nieto-Rostro M., Pratt W. S., Davies A., Dolphin A. C. (2005) Interaction via a key tryptophan in the I-II linker of N-type calcium channels is required for β1 but not for palmitoylated β2, implicating an additional binding site in the regulation of channel voltage-dependent properties. J. Neurosci. 25, 6984–6996 [DOI] [PMC free article] [PubMed] [Google Scholar]
- 53. Buchan D. W., Ward S. M., Lobley A. E., Nugent T. C., Bryson K., Jones D. T. (2010) Protein annotation and modelling servers at University College London. Nucleic Acids Res. 38, W563–W568 [DOI] [PMC free article] [PubMed] [Google Scholar]
- 54. Kadamur G., Ross E. M. (2013) Mammalian phospholipase C. Annu. Rev. Physiol. 75, 127–154 [DOI] [PubMed] [Google Scholar]
- 55. Horowitz L. F., Hirdes W., Suh B. C., Hilgemann D. W., Mackie K., Hille B. (2005) Phospholipase C in living cells: activation, inhibition, Ca2+ requirement, and regulation of M current. J. Gen Physiol. 126, 243–262 [DOI] [PMC free article] [PubMed] [Google Scholar]
- 56. Zahedi B., Goo H. J., Beaulieu N., Tazmini G., Kay R. J., Cornell R. B. (2011) Phosphoinositide 3-kinase regulates plasma membrane targeting of the Ras-specific exchange factor RasGRP1. J. Biol. Chem. 286, 12712–12723 [DOI] [PMC free article] [PubMed] [Google Scholar]
- 57. Bae Y. S., Lee T. G., Park J. C., Hur J. H., Kim Y., Heo K., Kwak J. Y., Suh P. G., Ryu S. H. (2003) Identification of a compound that directly stimulates phospholipase C activity. Mol. Pharmacol. 63, 1043–1050 [DOI] [PubMed] [Google Scholar]
- 58. Várnai P., Balla T. (1998) Visualization of phosphoinositides that bind pleckstrin homology domains: calcium- and agonist-induced dynamic changes and relationship to myo-[3H]inositol-labeled phosphoinositide pools. J. Cell Biol. 143, 501–510 [DOI] [PMC free article] [PubMed] [Google Scholar]
- 59. Fuller M. D., Emrick M. A., Sadilek M., Scheuer T., Catterall W. A. (2010) Molecular mechanism of calcium channel regulation in the fight-or-flight response. Sci. Signal. 3, ra70. [DOI] [PMC free article] [PubMed] [Google Scholar]
- 60. Hulme J. T., Konoki K., Lin T. W., Gritsenko M. A., Camp D. G., 2nd, Bigelow D. J., Catterall W. A. (2005) Sites of proteolytic processing and noncovalent association of the distal C-terminal domain of Cav1.1 channels in skeletal muscle. Proc. Natl. Acad. Sci. U.S.A. 102, 5274–5279 [DOI] [PMC free article] [PubMed] [Google Scholar]
- 61. Hulme J. T., Yarov-Yarovoy V., Lin T. W., Scheuer T., Catterall W. A. (2006) Autoinhibitory control of the Cav1.2 channel by its proteolytically processed distal C-terminal domain. J. Physiol. 576, 87–102 [DOI] [PMC free article] [PubMed] [Google Scholar]
- 62. Lieb A., Scharinger A., Sartori S., Sinnegger-Brauns M. J., Striessnig J. (2012) Structural determinants of CaV1.3 L-type calcium channel gating. Channels 6, 197–205 [DOI] [PMC free article] [PubMed] [Google Scholar]
- 63. Singh A., Gebhart M., Fritsch R., Sinnegger-Brauns M. J., Poggiani C., Hoda J. C., Engel J., Romanin C., Striessnig J., Koschak A. (2008) Modulation of voltage- and Ca2+-dependent gating of Cav1.3 L-type calcium channels by alternative splicing of a C-terminal regulatory domain. J. Biol. Chem. 283, 20733–20744 [DOI] [PMC free article] [PubMed] [Google Scholar]
- 64. Cao Y., Bartolomé-Martín D., Rotem N., Rozas C., Dellal S. S., Chacon M. A., Kadriu B., Gulinello M., Khodakhah K., Faber D. S. (2015) Rescue of homeostatic regulation of striatal excitability and locomotor activity in a mouse model of Huntington's disease. Proc. Natl. Acad. Sci. U.S.A. 112, 2239–2244 [DOI] [PMC free article] [PubMed] [Google Scholar]
- 65. Hall D. D., Dai S., Tseng P.-Y., Malik Z., Nguyen M., Matt L., Schnizler K., Shephard A., Mohapatra D. P., Tsuruta F., Dolmetsch R. E., Christel C. J., Lee A., Burette A., Weinberg R. J., Hell J. W. (2013) Competition between α-actinin and Ca2+-calmodulin controls surface retention of the L-type Ca2+ channel Cav1.2. Neuron 78, 483–497 [DOI] [PMC free article] [PubMed] [Google Scholar]
- 66. Rhee S. G., Choi K. D. (1992) Multiple forms of phospholipase C isozymes and their activation mechanisms. Adv. Second Messenger Phosphoprotein Res. 26, 35–61 [PubMed] [Google Scholar]
- 67. Miranda-Laferte E., Ewers D., Guzman R. E., Jordan N., Schmidt S., Hidalgo P. (2014) The N-terminal domain tethers the voltage-gated calcium channel β2e-subunit to the plasma membrane via electrostatic and hydrophobic interactions. J. Biol. Chem. 289, 10387–10398 [DOI] [PMC free article] [PubMed] [Google Scholar]
- 68. Gonzalez-Gutierrez G., Miranda-Laferte E., Contreras G., Neely A., Hidalgo P. (2010) Swapping the I-II intracellular linker between L-type Cav1.2 and R-type Cav2.3 high-voltage gated calcium channels exchanges activation attributes. Channels 4, 42–50 [DOI] [PubMed] [Google Scholar]
- 69. Neely A., Hidalgo P. (2014) Structure-function of proteins interacting with the α1 pore-forming subunit of high-voltage-activated calcium channels. Front. Physiol. 5, 209. [DOI] [PMC free article] [PubMed] [Google Scholar]
- 70. Zhen X. G., Xie C., Yamada Y., Zhang Y., Doyle C., Yang J. (2006) A single amino acid mutation attenuates rundown of voltage-gated calcium channels. FEBS Lett. 580, 5733–5738 [DOI] [PMC free article] [PubMed] [Google Scholar]
- 71. Rousset M., Cens T., Gouin-Charnet A., Scamps F., Charnet P. (2004) Calcium and phosphatidylinositol 4,5-bisphosphate stabilize a Gβγ-sensitive state of Ca V2 Ca2+ channels. J. Biol. Chem. 279, 14619–14630 [DOI] [PubMed] [Google Scholar]
- 72. Yang Y. R., Follo M. Y., Cocco L., Suh P. G. (2013) The physiological roles of primary phospholipase C. Adv. Biol. Regul. 53, 232–241 [DOI] [PubMed] [Google Scholar]
- 73. Rhee S. G., Bae Y. S. (1997) Regulation of phosphoinositide-specific phospholipase C isozymes. J. Biol. Chem. 272, 15045–15048 [DOI] [PubMed] [Google Scholar]
- 74. Suh P. G., Park J. I., Manzoli L., Cocco L., Peak J. C., Katan M., Fukami K., Kataoka T., Yun S., Ryu S. H. (2008) Multiple roles of phosphoinositide-specific phospholipase C isozymes. BMB Rep. 41, 415–434 [DOI] [PubMed] [Google Scholar]
- 75. Balasubramanian K., Mirnikjoo B., Schroit A. J. (2007) Regulated externalization of phosphatidylserine at the cell surface: implications for apoptosis. J. Biol. Chem. 282, 18357–18364 [DOI] [PubMed] [Google Scholar]
- 76. Suh B. C., Hille B. (2002) Recovery from muscarinic modulation of M current channels requires phosphatidylinositol 4,5-bisphosphate synthesis. Neuron 35, 507–520 [DOI] [PubMed] [Google Scholar]
- 77. Almagor L., Chomsky-Hecht O., Ben-Mocha A., Hendin-Barak D., Dascal N., Hirsch J. A. (2012) The role of a voltage-dependent Ca2+ channel intracellular linker: a structure-function analysis. J. Neurosci. 32, 7602–7613 [DOI] [PMC free article] [PubMed] [Google Scholar]
- 78. Baumgart J. P., Vitko I., Bidaud I., Kondratskyi A., Lory P., Perez-Reyes E. (2008) I-II loop structural determinants in the gating and surface expression of low voltage-activated calcium channels. PLoS One 3, e2976. [DOI] [PMC free article] [PubMed] [Google Scholar]
- 79. Findeisen F., Minor D. L., Jr. (2009) Disruption of the IS6-AID linker affects voltage-gated calcium channel inactivation and facilitation. J. Gen. Physiol. 133, 327–343 [DOI] [PMC free article] [PubMed] [Google Scholar]
- 80. Tedford H. W., Kisilevsky A. E., Vieira L. B., Varela D., Chen L., Zamponi G. W. (2010) Scanning mutagenesis of the I-II loop of the Cav2.2 calcium channel identifies residues arginine 376 and valine 416 as molecular determinants of voltage dependent G protein inhibition. Mol. Brain 3, 6. [DOI] [PMC free article] [PubMed] [Google Scholar]
- 81. Pinggera A., Lieb A., Benedetti B., Lampert M., Monteleone S., Liedl K. R., Tuluc P., Striessnig J. (2015) CACNA1D de novo mutations in autism spectrum disorders activate Cav1.3 L-type calcium channels. Biol. Psychiatry 77, 816–822 [DOI] [PMC free article] [PubMed] [Google Scholar]