

Abstract
RNA interference screening using pooled, short hairpin RNA (shRNA) is a powerful, high-throughput tool for determining the biological relevance of genes for a phenotype. Assessing an shRNA pooled screen’s performance is difficult in practice; one can estimate the performance only by using reproducibility as a proxy for power or by employing a large number of validated positive and negative controls. Here, we develop an open-source software tool, the Power Decoder simulator, for generating shRNA pooled screening experiments in silico that can be used to estimate a screen’s statistical power. Using the negative binomial distribution, it models both the relative abundance of multiple shRNAs within a single screening replicate and the biological noise between replicates for each individual shRNA. We demonstrate that this simulator can successfully model the data from an actual laboratory experiment. We then use it to evaluate the effects of biological replicates and sequencing counts on the performance of a pooled screen, without the necessity of gathering additional data. The Power Decoder simulator is written in R and Python and is available for download under the GNU General Public License v3.0.
Keywords: shRNA library, pooled screening, RNA interference, Monte Carlo simulations, power analysis
Introduction
RNA interference (RNAi) screening allows researchers to perform large-scale, whole-genome loss-of-function experiments. These types of screens have demonstrated utility in identifying gene targets that play a role in specific biological pathways and diseases.1–12 Pooled short hairpin RNA (shRNA) screens are particularly convenient because they do not require the automation necessary for individual-well screening. Furthermore, virally expressed shRNAs can be transduced into most cell types, and stable expression of the shRNAs allows analysis of phenotypes that require prolonged times to develop.
Although the utility of pooled shRNA screens has been demonstrated, not all requirements for screening parameters have been clearly established. To date, pooled shRNA screening protocols have been refined by specifically enriching and depleting defined sets of shRNA to gain an understanding of the parameters that affect screen reproducibility and power.13 In addition, it has been demonstrated that shRNA fold representation at all steps of a pooled screening protocol affects the reproducibility of screen replicates.14 The drawback to these approaches is that they require a tremendous amount of laboratory work, which becomes cost prohibitive when comprehensively testing screening parameters.
Statistical power (also known as sensitivity) is the chance of avoiding a type II error for an effect of a given strength; for example, an experiment with a power of 60% for an effect size with a standardized mean difference of 0.50 (generally considered a medium-sized effect) will have a 60% chance of correctly detecting that a difference of this size between two tested groups is indeed statistically significant.15 In general, 80% is considered the threshold for adequate power for the chosen effect size.16 Here we performed a limited number of pooled screens in which we engineered populations of shRNAs such that the magnitude of depletion and enrichment was known. We used this set of known data to develop an in silico model for estimating the statistical power of each screen. This type of model provides a rich set of information about a screen’s expected performance. For instance, the model can be used to characterize the ability of a screen to identify hits at a given fold change, to estimate an appropriate number of replicates, to determine the minimum necessary depth of sequencing coverage, and to provide some insight as to the reproducibility of the screen. It can also be used to gauge how effective a past screen was at detecting true hits as well as providing a way to estimate the performance of a future screen with similar experimental parameters. Furthermore, having a purely in silico model allows researchers to explore experimental parameters that may be prohibitively expensive to investigate in the lab.
Materials and Methods
Cell Culture
The human embryonic kidney cell line HEK293T (Dharmacon, part of GE Healthcare, Cat. No. HCL4517, Lafayette, CO) was propagated and maintained in growth media containing DMEM high glucose, with sodium pyruvate (GE Healthcare, Cat. No. SH3028502, Logan, UT) supplemented with 10% fetal bovine serum (Fisher Scientific Cat. No. SH30070.03), 100 U/mL penicillin and 100 µg/mL streptomycin (Fisher Scientific Cat. No. SH30010), and 200 mM L-glutamine (GE Healthcare, Cat. No. SH30034.01)
Pooled Lentiviral shRNA Screen with Engineered Depletion and Enrichment of Subsets of shRNAs
The pooled screen was performed using high-titer lentiviral particles from a lentiviral pool consisting of three different shRNA pool subsets: the Decode Pooled Human GIPZ Kinase Library (Dharmacon, part of GE Healthcare, Cat. No. RHS6078), an enrichment set, and a depletion set (with titers of 5.8 × 10⁸, 3.6 × 10⁸, and 2.4 × 10⁸ TU/mL, respectively). The kinase library is composed of 4675 shRNA targeting 709 human protein kinases. The enrichment and depletion sets are each composed of distinct sets of 480 shRNAs targeting human genes (see Suppl. Table S1). The reference (T0) sample was obtained by transducing HEK293T cells with the combined pool in which each shRNA from all three subsets was represented equally on average by either 100 independent integrations per shRNA (Screen 100) or 500 independent integrations per shRNA (Screen 500). Low multiplicity of infection (MOI) was used (MOI = 0.3) to achieve median single-copy integration of each shRNA, and the titer of each pool was used to calculate the amount of particles from each pool to combine such that the desired fold representation was achieved. For the experimental (T1) sample, HEK293T cells were transduced with lentiviral particles from the combined pool in which the kinase library was kept unchanged compared with the T0 sample (100 or 500 independent integrations per shRNA for Screen 100 and Screen 500, respectively), but the enriched set was increased and the depleted set was decreased compared with the T0 sample by 1.5-, 2-, or 4-fold, leading to enriched and depleted sets of shRNAs in the T1 samples compared with the T0 sample.
We performed the T0 and T1 transductions for both screens in biological triplicates using the appropriate amount of seeded cells at an optimal density (~180 cells/mm2) in either one 100 mm dish (Screen 100) or two 150 mm dishes (Screen 500). For Screen 100, the lentiviral particles for the T0 and T1 samples were diluted in 3 mL each of transduction media (DMEM media with no serum or antibiotics) and were added to HEK293T cells seeded on the previous day at a density of 1.425 × 10⁶ cells per 100 mm plate. For Screen 500, the lentiviral particles for the T0 and T1 samples were diluted in 7.5 mL of transduction media (DMEM media with no serum or antibiotics) and were added to HEK293T cells seeded on the previous day at a density of 3.125 × 10⁶ cells per 150 mm plate. Both Screen 100 and 500 were then incubated for 4 h at 37 °C. Growth media were added to the cells, followed by additional incubation at 37 °C for 48 h, at which point growth media were supplemented with 2.5 µg/mL of puromycin for selection. After 96 h of growth under selection, cells were lifted using 1 mL of 0.25% Trypsin (GE Healthcare, Cat. No. SH3004201). Nuclei were isolated from T0 and T1 samples following the manufacturer’s protocols for the DNeasy Blood and Tissue kit (Qiagen, Cat. No. 13362, Hilden, Germany) and then frozen until ready for genomic DNA (gDNA) isolation.
gDNA Isolation
gDNA was isolated from transduced cells using the DNeasy Blood and Tissue kit (Qiagen, Cat. No. 13362, Hilden, Germany) following the manufacturer’s protocol. Purified gDNA was evaluated for quality and yield by spectrophotometry using a Nanodrop 1000 (Thermo Scientific, Wilmington, DE).
The viral transduction was performed so that there was one integration of shRNA per cell and therefore per cell genome. The mass of one genome was therefore needed to calculate the amount of gDNA required in the PCR reaction to maintain the shRNA representation. To calculate the mass of the HEK293T cell’s genome, we used the number of base pairs (bp) present in the human genome adjusted for triploid cells, the average mass of a single base pair, and Avogadro’s constant.
Depending on how many copies of each shRNA were to be represented in the purified gDNA, we used the result above and the total number of desired shRNA integrations (assuming a single integration per genome) to calculate the amount of gDNA PCR input. Multiple PCR reactions were performed such that only 0.825 µg of gDNA was used per 50 µL of PCR reaction.
For Screen 100, approximately 6000 shRNAs per pool at 100 copies each is equivalent to 6 × 10⁵ shRNA integrations: (9.9 × 10⁻¹² g/genome) × (6 × 10⁵ genomes) = 5.9 × 10⁻⁶ g or 5.9 µg of gDNA, seven PCR reactions.
For Screen 500, approximately 6000 shRNA per pool at 500 copies each is equivalent to 3 × 10⁶ shRNA integrations: (9.9 × 10⁻¹² g/genome) × (3 × 10⁶ genomes) = 2.97 × 10⁻⁵ g or 29.7 µg of gDNA, 36 PCR reactions.
Sample Preparation for Next-Generation Sequencing
gDNA isolated from biological replicates of T0 and T1 samples of Screens 100 or 500 was amplified using Decode Indexing, PCR, and Sequencing primer kit (Dharmacon, part of GE Healthcare, Cat. No. PRM6178) following the manufacturer’s instructions. Briefly, multiple PCR reactions were carried out for each T0 and T1 sample (7 and 36 for Screen 100 and Screen 500, respectively). PCR product purification was performed using the GeneJET PCR purification kit (Thermo Scientific, Cat. No. K0701). Decode PCR-purified products are Illumina sequencing ready but were size verified using agarose gel electrophoresis prior to sequencing. Decode next-generation sequencing libraries were run on the Illumina HiSeq 2000 (Illumina, San Diego, CA) at the Biofrontiers Institute (University of Colorado at Boulder). Eighteen samples were multiplexed and run in two 1 × 50-base read lanes using the Decode Indexing, PCR, and Sequencing primer kit (Dharmacon, part of GE Healthcare, Cat. No. PRM6178). An average of 54 million 50-base reads per lane was obtained from the sequencing lanes, with sequences provided in FASTQ format.
Next-Generation Sequencing Data Analysis
Next-generation sequencing (NGS) reads were aligned according to the DECODE Pooled Bioinformatic Analysis Protocol (http://dharmacon.gelifesciences.com/uploadedFiles/Resources/decode-pooled-bioinfomatic-analysis-protocol.pdf). The -v 1 option was used when running Bowtie (v0.12.7)17 to reduce the number of allowed mismatches. A Bowtie reference was created using the 5635 clones expected to be in the pool. Any shRNA with more than 50 perfect alignments was considered present in the NGS experiment.
After performing the shRNA screening experiment, it was observed that, in the T0 data, mean counts for the two 480-shRNA sets were higher than that for the 4675-shRNA set, presumably because of slight differences in viral titer. To correct this artifact, the counts for each shRNA in the two 480-shRNA sets were divided by the total number of counts for the relevant set and used to create a probability distribution of getting a count for any given shRNA in the set. The expected total number of counts for the set was then scaled by the ratio of the mean counts in the 4675-shRNA set divided by the mean counts for the relevant set. A random subsampling was performed to select this scaled number of total counts from the probability distribution. This procedure creates counts for the relevant set that have the same mean as the 4675-shRNA set and the observed experimental relative distribution, which was then appended to the unaltered counts from the 4675-shRNA set to create the normalized T0 data. Thirty separate normalizations via this process were performed to ensure that all reported results are typical.
The differential abundance analysis was performed using DESeq (v1.10.1), which is an R (v2.15.3) package, part of the Bioconductor (v2.11.0) framework.18 DESeq uses a model based on the negative binomial distribution to estimate the significance of fold change. It also applies the Benjamini-Hochberg multiple test correction to the reported p values. All shRNAs with multiple-test corrected p values of 0.05 or lower were classified as hits.
Screen Power
Screen power is a straightforward metric that assesses a screen’s performance, but because true-positives are generally not known in advance, it usually cannot be computed from primary screening results. However, in our engineered screens, where enrichment and depletion were manually specified for a known set of shRNAs, the exact power was easily calculated as
We were able to perform the same calculation for simulated screens, where known enrichments and depletions were applied in silico.
Software
The Power Decoder simulator is made up of five primary scripts that allow for reproduction of this work as well as novel user-directed analyses. Normalization of the sequence counts was performed with the normalize_counts.py script; power analysis of the normalized experimental screen was performed with the experiment_power_analysis.py script; simulation of the power of a screen, as described above in the “Performance” subsection, was performed with the simulate_power_analysis.py script; work for the “Power as a Function of Biological Replicates” subsection was performed with the vary_replicates_pipeline.py script; and work for the “Power as a Function of Depth of Sequencing Coverage” subsection was performed with the sequence_sampler_pipeline.py script. These scripts and their supporting libraries, as well as sample inputs and outputs with precise content specifications, are available through the Power Decoder simulator sourceforge.net site. The Power Decoder simulator is also distributed with a set of rigorous unit tests that help to ensure computational accuracy.
Scripts are written in Python and R and rely on the installation of Python 2.7.3, Numpy 1.7.1, PyCogent 1.5.3, R 2.15.3, Bioconductor 2.11.0, and DESeq 1.10.1. The Power Decoder simulator simulates the T1 values from the T0 sample using the negative binomial distribution. When calculating the negative binomial distribution for T0, one must first estimate the size factors and the dispersion. DESeq allows for the estimation of these values by allowing the user to load counts that correspond to only a single condition (T0), whereas DESeq2 requires a minimum of 2 conditions as input (T0 and T1); therefore, the authors chose to use DESeq. For installation of the Power Decoder simulator on an Ubuntu OS (32-bit/64-bit), refer to the INSTALL document on the project’s sourceforge.net Web site.
Results
Pooled Screening Experiments with Engineered Depletion and Enrichment of shRNAs
We performed pooled screens with known and experimentally relevant magnitudes of shRNA enrichment and depletion to provide data for developing and testing a simulator. For screening, the viral particles from three different shRNA sets were combined into one lentiviral pool, made up of a 4675-shRNA set representing the unchanged shRNA population, a 480-shRNA set for enrichment, and another distinct 480-shRNA set for depletion. The reference (T0) sample was obtained by transducing HEK293T cells with this lentiviral pool (total of 5635 shRNAs) in which the three subsets were present at equivalent viral titer such that each shRNA was represented equally, on average. For the experimental (T1) sample, HEK293T cells were transduced with the lentiviral pool in which the unchanged set (4675 shRNAs) was kept at the same concentration as the T0 sample, and the enrichment set (480 shRNAs) and the depletion set (480 shRNAs) were varied by a known magnitude (1.5-fold, 2-fold, or 4-fold). The pooled screen was performed in biological triplicates at two different shRNA fold representations, corresponding to 100 or 500 independent integrations per shRNA at the transduction step (termed Screen 100 or Screen 500, respectively). The fold enrichment and depletion examined was 2- and 4-fold for Screen 100 and 1.5- and 2-fold for Screen 500, and these different data sets were denoted as Screen 100_2x, Screen 100_4x, and so forth (Suppl. Table S2).
Genomic DNA from the pooled screening experiments was isolated, amplified, and examined for relative shRNA abundance by NGS. The correlation between T0 replicates was high, with Pearson correlation coefficients for Screen 100 and Screen 500 of 0.90 and 0.96, respectively. Although every effort was made to transduce all shRNAs at equivalent viral titers in the T0 experiment, data demonstrate that there were systematic differences between the counts for shRNAs in the two 480-shRNA sets and those in the 4675-shRNA set (see Suppl. Fig. S1), presumably due to slight differences in viral titer. As described in the Methods section, we therefore normalized all experimental counts by subsampling from the T0 counts of the two 480-shRNA sets in such a way as to make the means of their counts the same as that for the 4675-shRNA set. Because this normalization process is stochastic, all experimental count values provided throughout are the average of 30 normalizations and are presented with accompanying standard deviations (σ).
Using DESeq,19 primary hits were identified from the three replicate NGS data as shRNAs that appeared differentially expressed with p* < 0.05 after Benjamini-Hochberg multiple test correction.20 These hits were compared to the list of 960 manually enriched and depleted shRNAs to identify true-positive, false-positive, and false-negative shRNAs (Suppl. Table S3). False-positives are shRNAs whose abundance was not experimentally altered in T1 samples but were nonetheless selected as hits in the differential expression analysis. False-negatives are shRNAs that were experimentally altered but were not identified as hits by the analysis.
More true hits were identified in Screen 500_2x than in Screen 100_2x, and Screen 500_2x shows a better separation of the identified depletion and enrichment hits (Fig. 1). Of the 960 shRNAs that were manually varied in T1 by twofold, only an average of 259 (σ = 4.13) were identified as hits in the Screen 100_2x, whereas an average of 877 (σ = 3.71) were identified as hits in Screen 500_2x (Suppl. Table S3). Although the false-positive rate was less than 1.5% in both screens due to the multiple test correction, the false-negative rate decreased substantially from 72.40% (σ = 0.45) to 6.74% (σ = 0.39) as shRNA fold representation increased, giving a concomitant increase in screen power from 27.60% (σ = 0.45) to 93.26% (σ = 0.39) from Screen 100_2x to Screen 500_2x. Manually increasing the shRNA enrichment and depletion magnitude from 2- to 4-fold in Screen 100 improved the power from 27.60% (σ = 0.45) to 76.10% (σ = 0.55), and manually decreasing the shRNA enrichment and depletion from 2- to 1.5-fold in Screen 500 led to a drop in power from 93.26% (σ = 0.39) to 58.35% (σ = 0.92; Suppl. Table S3). This substantiates previous findings that strong hits can be identified at a range of shRNA fold representations whereas moderate hits may be lost at lower shRNA fold representations13,14 and provides confidence that these data sets are realistic as the basis of a simulator.
Figure 1.
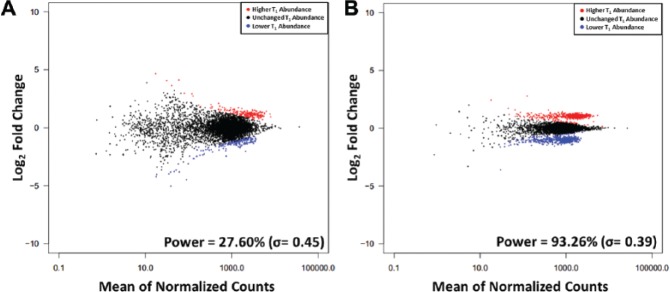
Differential enrichment and depletion of short hairpin RNAs (shRNAs) in engineered screens. MA plots of representative examples of normalized data from experimental shRNA pooled screens with engineered twofold enrichment and depletion of shRNAs in which transductions were performed at (A) 100 and (B) 500 independent shRNA integrations on average. The shRNAs with significantly (p* ≤ 0.05) higher and lower abundance in T1 in the next-generation sequencing count data are in red and blue, respectively. Power values listed are mean ± standard deviation over 30 normalizations.
It is generally thought that it is easier to detect enriched, rather than depleted, hits in pooled shRNA screens because the signal-to-noise ratio is higher for enriched hits. To test this hypothesis, enriched and depleted hits using three replicates were examined separately, and their screen powers were compared (Suppl. Table S4). For screens with high overall power (Screen 100_4x and Screen 500_2x), we observe a slight trend toward higher power in detecting enriched hits than in detecting depleted hits. Screen 100_4x had powers of 80.74% (σ = 0.55) and 72.83% (σ = 0.59) for enrichment and depletion, respectively, whereas Screen 500_2x had powers of 96.50% (σ = 0.49) and 90.51% (σ = 0.42), respectively. However, this trend is not consistent in the experiments for the screens in which overall power is lower: for example, Screen 100_2x had powers of 21.83% (σ = 0.68) for enrichment and 31.59% (σ = 0.35) for depletion.
We have previously shown that maintaining the shRNA representation during PCR amplification is important for increasing screen data reproducibility.14 We reexamined the effect of maintaining the shRNA fold representation during PCR amplification on screen power by performing PCR amplification of gDNA from Screen 500 such that the shRNA representation was reduced to 100-fold at PCR. When performing the PCR at suboptimal fold coverage, the screen power dropped from 93.26% (σ = 0.39) to 34.79% (σ = 0.69) for Screen 500_2x and from 58.35% (σ = 0.92) to 3.34% (σ = 0.38) for Screen 500_1.5x (Suppl. Table S3). These data confirm the importance of maintaining shRNA representation during PCR amplification and provide a realistic noisy data set for eventual testing of the simulator.
Benefits of Modeling
Performing a controlled hit enrichment and depletion experiment in the laboratory to determine the power of a particular screen can be prohibitively expensive and time-consuming. Also, the analysis may not generalize to other cell types, assays, and experimental conditions that have more or less noise between biological replicates. Instead, a preferable approach is to simulate these types of experiments in silico using statistical models. In such simulations, different parameters of a screen can easily be varied to determine what level of power to expect in future biological screens, as well as in screens that have already been performed.
To simulate pooled screening NGS data, it is necessary to model (1) the true number of shRNA counts in T0 and T1 and (2) the biological noise between replicates.
Model of T0 Counts
Several options were considered for modeling shRNA counts. A normal distribution describes continuous data (such as fluorescence intensity data from microarrays) and is therefore inappropriate for modeling discretely distributed NGS measurements. A Poisson distribution describes a discrete random variable (such as sequencing counts) and may be adequate for modeling NGS technical replicates, but it has been shown to be insufficient for modeling biological replicates as the Poisson model’s single parameter (which determines both mean and variance) cannot account for the additional biological noise.19
The negative binomial distribution (NBD) has been successfully used to model RNA sequencing data,19 which, like pooled screening NGS abundance data, are discrete and have biological noise. Although this distribution is often thought of as describing the number of failures before the rth success in a sequence of independent binomial trials, it can equally validly be defined as a Poisson-Gamma mixture model. In this conceptualization, the negative binomial distribution is in fact a Poisson distribution whose mean parameter is itself a random variable drawn from a Gamma distribution, creating a distribution whose variance is greater than its mean and thus overcoming the primary limitation of the canonical Poisson distribution for NGS data. Under this interpretation, the NBD may be described in terms of its mean µ and variance σ2, which can be interconverted from the r (number of successes) and p (probability of success) parameters used under the more common definition.21 The variance equals µ + (1/r)* µ2, where r is now interpreted as a dispersion measure that may take on noninteger values. A negative binomial distribution can therefore be uniquely defined by its mean and dispersion parameters.
To determine whether a negative binomial distribution can accurately model shRNA counts, we used data from T0, in which all 5635 shRNAs are represented equally on average. For both Screen 100_2x and Screen 500_2x, mean and dispersion parameters for a negative binomial distribution were obtained from the normalized means of the experimentally determined counts for each shRNA, and simulated shRNA count data were then generated by sampling from the NBD with these experimentally determined parameters. We generated Gaussian kernel density estimates (Fig. 2A, C), which can be used to estimate continuous probability density functions of discrete random variables such as count, as well as the related cumulative distributions (Fig. 2B, D), which show the cumulative probability that a random variable such as count will have a value less than or equal to any particular amount. Comparisons of these visualizations demonstrate the similarity between actual and estimated distributions for Screen 100_2x and Screen 500_2x experiments, respectively. The negative binomial models capture the shape of the actual data, although, as expected with simulations, they are not perfect mimics of the experimental data sets (being more smoothly distributed and slightly more leftward-skewed). Given the extremely large sample sizes in each data set (from ~3,000,000 up to ~9,000,000 reads), statistical evaluations of whether two distributions are similar will be able to detect even very small (and possibly inconsequential) differences as statistically significant.22 We performed a Kolmogorov-Smirnov test on each screen/model pair, and, as anticipated, received highly significant p values for both Screen 100_2x and Screen 500_2x, indicating that the modeled and experimental distributions are perceptibly different. However, the D statistic, which measures the actual magnitude of the difference between the distributions and ranges from 0 when distributions are the same to 1 when they are completely dissimilar, averaged less than 0.09 for both screens, with standard deviations for both of less than 0.007 over 900 separate simulations. This demonstrates that the difference between the models and experimental data, although detectable, is small; for comparison, the most closely correlated replicate pairs had average D statistics (across 30 normalizations) of 0.0363 and 0.0692 for Screen 100_2x and Screen 500_2x. Simulated counts can therefore reasonably be used to represent “true” shRNA counts and employed as the basis on which to simulate the biological noise of replicates.
Figure 2.

Modeled next-generation sequencing (NGS) screen data compared with actual experimental NGS screen data. Kernel density estimate plots for the distributions of NGS counts for representative examples of normalized actual (red) and simulated (blue) T0 data generated by fitting parameters to the negative binomial distribution for (A) Screen 100_2x and (C) Screen 500_2x. Cumulative distributions of the same actual and simulated T0 count distributions for (B) Screen 100_2x and (D) Screen 500_2x.
Model of Biological Replicates
A negative binomial distribution can also be used to generate, for each shRNA, a model of the distribution of noisy count measurements associated with it. This is achieved using a strategy similar to that employed for RNA sequencing data,19 which leverages the mean-variance relationship (or mean-dispersion relationship, in the case of the negative binomial distribution) by performing a local regression on the empirical data from several replicates (Suppl. Fig. S2). This regression produces a function , which gives the dispersion parameter of an NBD based on that NBD’s mean, .
For each shRNA i, we then create an NBD whose mean is the true number of counts for that shRNA given by the NBD modeling T0 data, as developed above, and whose dispersion parameter is given by . This distribution models the spread in measured replicate count values for an shRNA with a given true count value. By sampling once from the NBD distribution for each shRNA in the screen, we can create one realistically “noisy” set of count data; we can sample additional times to produce additional replicates. Comparing the noise between experimental replicates and modeled replicates of Screen 100_2x and Screen 500_2x results in identical Pearson correlation coefficients (r), demonstrating that the models closely mimic actual data (Suppl. Fig. S3).
Model of T1 Counts
The experimental condition, T1, shows a difference in the relative abundance of shRNA constructs in a sample that have undergone a change, either due to the passage of time or to treatment. As in our engineered experimental screen, we here apply a strategy of enriching and depleting 20% of the shRNAs in modeled T0 data to generate known T1 true counts.
Twenty percent of the shRNAs from our modeled T0 data were randomly selected, and a fold change of 1.5, 2, or 4 was applied to them. As in the actual pooled shRNA screen described above, 10% of the modeled shRNA was depleted and 10% was enriched by exactly the chosen fold change. This process produced simulated data representing the true T1 counts for each shRNA.
Noisy replicate T1 count data can be created for each shRNA from an NBD defined as
where T0t is the shRNA’s simulated true counts at time zero and fold change is 1.5, 2, or 4 for the 10% of the shRNAs that are enriched, 2/3, 1/2, or 1/4 for the 10% that are depleted, and 1 for the remainder. As in T0, we sample once from the NBD distribution for each shRNA in the screen to create a simulated data set, repeating this process as many times as we like to create noisy count data for the desired number of replicates.
Software Development
We developed these techniques into a software tool called the Power Decoder simulator. The Power Decoder simulator is a suite of scripts written in Python and R and is available under the GNU General Public License v3.0 at https://sourceforge.net/projects/powerdecoder/. These command-line tools take user inputs specifying parameters such as experimental T0 or pilot data on which to base simulation models and the number of simulations to perform. Automatically generated outputs include plots such as those shown in Figures 2 and 3 (including Suppl. Figs. S1–S3) as well as comma-separated text files containing the data on which these figures are based.
Figure 3.
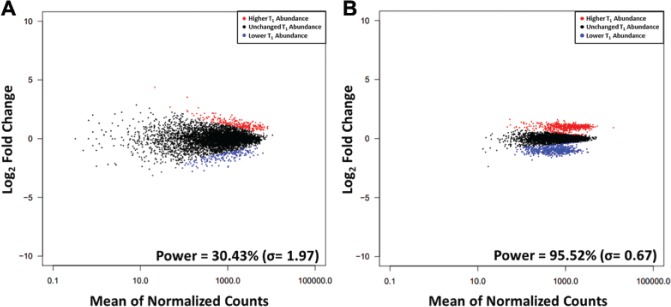
Differential enrichment and depletion of short hairpin RNAs (shRNAs) in simulated screens. MA plots for two representative examples of simulated data from shRNA pooled screens with in silico twofold enrichment and depletion of shRNAs based on (A) Screen 100_2x and (B) Screen 500_2x. The shRNAs with significantly (p* ≤ 0.05) higher and lower abundance in T1 in the simulated next-generation sequencing count data are in red and blue, respectively. Power values listed are mean ± standard deviation over 900 simulations.
Performance
Knowing which shRNAs were enriched or depleted by a certain fold change, we are able to compute the exact power of each simulated screen after using DESeq19 to identify differentially expressed shRNAs. To determine whether these powers correlated well with actual powers calculated for the engineered screen, we applied the Monte Carlo method: for each screen, we used the Power Decoder simulator to generate 900 simulated screens by performing 30 normalizations on each experimental data set and then 30 simulations based on each normalization. Each simulated screen included three replicates. Plots of log2 fold change in counts versus average counts (commonly referred to as MA plots) for representative simulations of Screen 100_2x and Screen 500_2x are shown in Figure 3; they exhibit the same trends as the experimental data (Fig. 1), with lower noise and higher power as the shRNA fold representation increases, again demonstrating this approach’s ability to model experimental data. A comparison of the actual and modeled data for all experiments (Fig. 4; Table 1) shows that the simulated powers correlate closely with the true, experimentally determined powers. Because the simulated percentage powers are slightly larger than the true powers, with the overestimates having a mean of 6.16 and standard deviation of 4.12 presumably due to the slight differences between the modeled and true count distributions discussed above, they can usefully be treated as a realistic upper limit on possible sensitivity. Notably, the simulator predictions are equally reliable for Screen 500_1.5xPCR_100 and Screen 500_2xPCR_100, which have higher noise and lower power than the analogous screens with optimal PCR amplification; this demonstrates that the simulator is relevant even for screens that are very noisy.
Figure 4.

Simulated and actual powers for both high- and low-noise screens. The power of each experiment with (A) two and (B) three replicates for actual (red) and simulated (blue) data. Error bars are the standard deviations of 30 normalizations for actual experiments and 900 simulations for simulated experiments. (C) The correlation between simulated and actual power for three-replicate experiments.
Table 1.
Comparison of Actual and Simulated Screen Data Analysis.
| Actual Power (%) |
Actual Specificity (%) |
Simulated Power (%) |
Simulated Specificity (%) |
||||||
|---|---|---|---|---|---|---|---|---|---|
| Experiment | Number of Replicates | Average | σ | Average | σ | Average | σ | Average | σ |
| Screen 100_2x | 2 | 12.93 | 0.34 | 99.22 | 0.03 | 15.24 | 1.72 | 99.82 | 0.07 |
| Screen 100_2x | 3 | 27.60 | 0.45 | 98.95 | 0.01 | 30.43 | 1.97 | 99.66 | 0.10 |
| Screen 100_4x | 2 | 65.49 | 0.60 | 98.50 | 0.03 | 71.77 | 1.67 | 99.27 | 0.14 |
| Screen 100_4x | 3 | 76.10 | 0.55 | 98.68 | 0.01 | 84.37 | 1.25 | 99.15 | 0.15 |
| Screen 500_1.5xPCR_100 | 2 | 0.94 | 0.17 | 99.62 | 0.03 | 4.21 | 1.16 | 99.95 | 0.04 |
| Screen 500_1.5xPCR_100 | 3 | 3.34 | 0.38 | 99.78 | 0.02 | 11.19 | 1.60 | 99.87 | 0.06 |
| Screen 500_2xPCR_100 | 2 | 33.73 | 0.46 | 98.82 | 0.02 | 38.43 | 2.15 | 99.58 | 0.11 |
| Screen 500_2xPCR_100 | 3 | 34.79 | 0.69 | 99.16 | 0.02 | 50.10 | 1.93 | 99.46 | 0.12 |
| Screen 500_1.5x | 2 | 28.96 | 0.83 | 99.31 | 0.03 | 41.18 | 2.16 | 99.58 | 0.11 |
| Screen 500_1.5x | 3 | 58.35 | 0.92 | 98.95 | 0.02 | 63.19 | 1.75 | 99.33 | 0.14 |
| Screen 500_2x | 2 | 83.45 | 0.60 | 98.73 | 0.02 | 87.24 | 1.09 | 99.13 | 0.15 |
| Screen 500_2x | 3 | 93.26 | 0.39 | 98.60 | 0.01 | 95.52 | 0.67 | 99.00 | 0.16 |
We used the simulator to determine whether subtle biological effects can be observed at smaller fold changes because we observed that shRNA fold change has a strong effect on experimental power. Supplemental Figure S4 shows the power as a function of fold change ranging from 1.2 to 2.5 for Screen 500 with three replicates. From this simulation based on actual T0 data, it shows that for this specific biological screen and experimental parameters, the fold changes of less than 1.5 contain fewer true-positive hits; therefore, experiments must be planned accordingly.
Power as a Function of Biological Replicates
In the analysis discussed above, the Power Decoder simulator was used to create two or three replicates, in order to parallel what was done in the laboratory. Because the software can generate any number of replicates without meaningful cost or time considerations, we next used it to explore how the number of replicates affects the power of a screen.
Monte Carlo simulations were generated using the Power Decoder simulator for Screen 100_2x over a range of 2 to 10 replicates, and the power for each model was compared with actual data acquired using only two replicates for Screen 500_2x (Fig. 5A). Surprisingly, even 10 replicates of Screen 100_2x give a power that is still lower (~82%) than that from two replicates of Screen 500_2x (~83%). This strongly demonstrates the importance of adequate shRNA fold coverage to decrease noise and increase screening power. As it is more labor intensive to perform more replicates than to increase fold coverage, it is clear that increasing shRNA fold coverage is the preferred method to reduce experimental noise. Drawing this conclusion from laboratory data would have been costly and time-consuming, further illustrating the usefulness of the Power Decoder simulator software.
Figure 5.
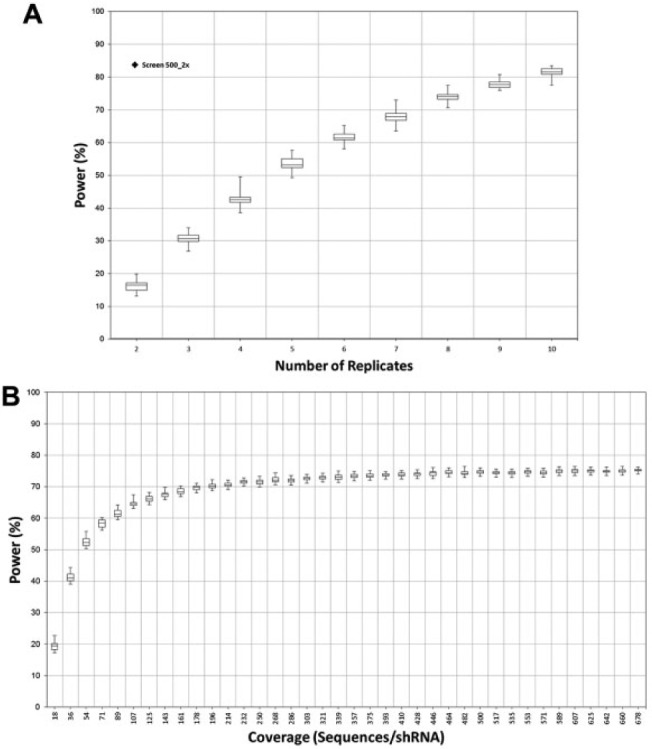
(A) Power as a function of replicate number. Box plots represent powers derived from DESeq analysis of 900 simulated next-generation sequencing (NGS) experiments of Screen 100_2x per replicate level. For comparison, the actual power of the Screen 500_2x using two biological replicates is also plotted. (B) Power as a function of sequencing coverage. Box plots represent powers derived from DESeq analysis of 900 simulated NGS experiments per coverage. This was done at increments of 100,000 counts per simulation or ~18 sequences per shRNA.
Power as a Function of Depth of Sequencing Coverage
Another important experimental factor is the sequencing coverage (defined as total number of read counts divided by the size of the pool) required to obtain maximum power. Even an experiment with very low biological noise can have poor power if the number of sequencing reads obtained is too low. Enriched and depleted shRNAs in the Screen 500_1.5x experiment had only a moderate 1.5-fold modulation, which might easily be masked by inadequate sequence coverage. We therefore modeled this experiment by dividing the actual number of counts for each shRNA by the total number of counts in order to derive a multinomial distribution for a single trial (otherwise known as a categorical distribution) giving the probabilities that a single read will find each individual shRNA. We then sampled this distribution to produce Monte Carlo–simulated per-shRNA counts at varying total counts: a single sampling from this distribution represents a single read, so to simulate, for example, 1 million total reads, 1 million samplings would be taken. Simulations of the total number of reads were performed 900 times for each investigated coverage level, and then differential expression analyses were performed on the simulated reads to determine the power of the screen at these coverage levels. Figure 5B demonstrates that power for the Screen 500_1.5x experiment increases rapidly as a function of sequencing coverage at low coverage levels but begins to plateau at about 75% at approximately 200 sequences per shRNA. This suggests that adequate coverage is both critical for achieving acceptable power in detecting moderate hits and also not difficult to achieve.
Discussion
The ability to determine statistically significant changes between relative quantities of a particular RNA/DNA sequence in a sample is an important tool in molecular biology and in pooled shRNA screening experiments in particular. In previous work,14 we showed that optimizing PCR conditions and having a high shRNA fold representation are crucial in obtaining highly reproducible data from pooled shRNA screening experiments. In that work, the reproducibility of the data was used to estimate the relative power of a screen. Here, we engineered an experiment that gave us a better estimate of the screen’s power because we knew which shRNAs were truly enriched, depleted, or had no change. The engineered experiment further demonstrated the importance of shRNA fold coverage and PCR optimization in obtaining high power.
However, engineered experiments are an impractical approach for regularly estimating screen power because of the significant effort required to perform them. Such limitations have previously been addressed for arrayed screens through the use of simulated data.1 We therefore developed the Power Decoder simulator, an open-source software tool for simulating shRNA pooled screening experiments in silico. This tool uses an initial data set, such as a pilot or T0 experiment, to derive negative binomial distribution models of both true mean counts across all shRNAs in a single replicate and actual, noisy counts for each single shRNA across replicates. The Power Decoder simulator applies these models to simulate realistic screening data under user-specified true hit and noise assumptions; the simulated data can then be analyzed for “differential expression” with existing tools such as DESeq19 to estimate the actual statistical power for real screens with similar hit and noise profiles.
This strategy is similar to previous work23 wherein a negative binomial distribution was used to model RNA-sequencing data for differential expression. Although estimating the power of pooled shRNA screens has been attempted before,13 previous efforts have employed Gaussian distributions. Gaussians are suboptimal for modeling discrete data such as NGS alignments because they are fairly accurate at high count means but not at the low count means involved in differential expression analysis, in which negative binomial distributions have been shown to be much more realistic.19
We applied the Power Decoder simulator to simulate screens with various hit fold changes, PCR conditions, and shRNA fold coverages. The simulated data sets, although not perfect models of the experimental ones, showed similar distributions to the actual data (Fig. 2; Suppl. Fig. S3) and led to power estimates that were realistic upper limits on those calculated from laboratory experiments (Fig. 4), thus validating their usefulness. We then extended our simulations to predict the power of a pooled shRNA screen at various numbers of biological replicates and sequencing coverages. We showed that shRNA fold coverage is much more influential than the number of replicates in obtaining a high power and that power increases with sequencing coverage until plateauing at approximately 200 sequences per shRNA for even modest 1.5-fold change hits.
These investigations demonstrate how the Power Decoder simulator can help scientists plan future screens and easily investigate the likely effects of various experimental factors in silico, saving both time and money. Data from existing screens can also be analyzed retrospectively to evaluate their power and thus estimate the completeness of their resulting hit lists. In addition, the Power Decoder simulator can be used to streamline optimization of novel pooled screening technologies such as gene knockout screens employing the new clustered regularly interspaced short palindrome repeats (CRISPR)–associated nuclease Cas9.24–26 The ability to do fast, easy, accurate power analyses before screening will enable researchers to perform adequately powered experiments, thereby delivering reliable answers to crucial biological questions.
Supplementary Material
Acknowledgments
We thank Dharmacon Production for manufacturing of custom viral shRNA pools.
Footnotes
Declaration of Conflicting Interests: All authors are employed or were formerly employed by Dharmacon. Some of the materials used in this study are products sold by Dharmacon. This does not alter our adherence to all the JBS policies on sharing data and materials.
Funding: The authors received no financial support for the research, authorship, and/or publication of this article.
Supplementary material for this article is available on the Journal of Biomolecular Screening Web site at http://jbx.sagepub.com/supplemental.
References
- 1. Kwan P., Birmingham A. NoiseMaker: Simulated Screens for Statistical Assessment. Bioinformatics 2010, 26, 2484–2485. [DOI] [PMC free article] [PubMed] [Google Scholar]
- 2. Zender L., Hutker S., Liedtke C., et al. Caspase 8 Small Interfering RNA Prevents Acute Liver Failure in Mice. Proc. Natl. Acad. Sci. U.S.A. 2003, 100, 7797–7802. [DOI] [PMC free article] [PubMed] [Google Scholar]
- 3. Hsieh A. C., Bo R., Manola J., et al. A Library of siRNA Duplexes Targeting the Phosphoinositide 3-Kinase Pathway: Determinants of Gene Silencing for Use in Cell-Based Screens. Nucleic Acids Res. 2004, 32, 893–901. [DOI] [PMC free article] [PubMed] [Google Scholar]
- 4. Jiang Z. Y., Zhou Q. L., Coleman K. A., et al. Insulin Signaling through Akt/Protein Kinase B Analyzed by Small Interfering RNA-Mediated Gene Silencing. Proc. Natl. Acad. Sci. U.S.A. 2003, 100, 7569–7574. [DOI] [PMC free article] [PubMed] [Google Scholar]
- 5. Kurisaki K., Kurisaki A., Valcourt U., et al. Nuclear Factor YY1 Inhibits Transforming Growth Factor β- and Bone Morphogenetic Protein-Induced Cell Differentiation. Mol. Cell. Biol. 2003, 23, 4494–4510. [DOI] [PMC free article] [PubMed] [Google Scholar]
- 6. Struwe W. B., Warren C. E. High-Throughput RNAi Screening for N-Glycosylation Dependent Loci in Caenorhabditis elegans. Methods Enzymol. 2010, 480, 477–493. [DOI] [PubMed] [Google Scholar]
- 7. Whitehurst A. W., Bodemann B. O., Cardenas J., et al. Synthetic Lethal Screen Identification of Chemosensitizer Loci in Cancer Cells. Nature 2007, 446, 815–819. [DOI] [PubMed] [Google Scholar]
- 8. Kok K. H., Lei T., Jin D. Y. siRNA and shRNA Screens Advance Key Understanding of Host Factors Required for HIV-1 Replication. Retrovirology 2009, 6, 78. [DOI] [PMC free article] [PubMed] [Google Scholar]
- 9. Li Q., Brass A. L., Ng A., et al. A Genome-Wide Genetic Screen for Host Factors Required for Hepatitis C Virus Propagation. Proc. Natl. Acad. Sci. U.S.A. 2009, 106, 16410–16415. [DOI] [PMC free article] [PubMed] [Google Scholar]
- 10. Gewurz B. E., Towfic F., Mar J. C., et al. Genome-Wide siRNA Screen for Mediators of NF-κB Activation. Proc. Natl. Acad. Sci. U.S.A. 2012, 109, 2467–2472. [DOI] [PMC free article] [PubMed] [Google Scholar]
- 11. Lipovsky A., Popa A., Pimienta G., et al. Genome-Wide siRNA Screen Identifies the Retromer as a Cellular Entry Factor for Human Papillomavirus. Proc. Natl. Acad. Sci. U.S.A. 2013, 110, 7452–7457. [DOI] [PMC free article] [PubMed] [Google Scholar]
- 12. Nickles D., Falschlehner C., Metzig M., et al. A Genome-Wide RNA Interference Screen Identifies Caspase 4 as a Factor Required for Tumor Necrosis Factor Alpha Signaling. Mol. Cell. Biol. 2012, 32, 3372–3381. [DOI] [PMC free article] [PubMed] [Google Scholar]
- 13. Sims D., Mendes-Pereira A., Frankum J., et al. High-Throughput RNA Interference Screening Using Pooled shRNA Libraries and Next Generation Sequencing. Genome Biol. 2011, 12, R104. [DOI] [PMC free article] [PubMed] [Google Scholar]
- 14. Strezoska Z., Licon A., Haimes J., et al. Optimized PCR Conditions and Increased shRNA Fold Representation Improve Reproducibility of Pooled shRNA Screens. PLoS One 2012, 7, e42341. [DOI] [PMC free article] [PubMed] [Google Scholar]
- 15. Freedman K. B., Back S., Bernstein J. Sample Size and Statistical Power of Randomised, Controlled Trials in Orthopaedics. J. Bone Joint Surg. 2001, 83, 397–402. [DOI] [PubMed] [Google Scholar]
- 16. Cohen J. Statistical Power Analysis for the Behavioral Sciences; 2nd ed.; Lawrence Erlbaum Associates, Inc: Hillsdale, NJ, 1998. [Google Scholar]
- 17. Langmead B., Trapnell C., Pop M., et al. Ultrafast and Memory-Efficient Alignment of Short DNA Sequences to the Human Genome. Genome Biol. 2009, 10(3), R25. [DOI] [PMC free article] [PubMed] [Google Scholar]
- 18. Gentleman R. C., Carey V. J., Bates D. M., et al. Bioconductor: Open Software Development for Computational Biology and Bioinformatics. Genome Biol. 2004, 5(10), R80. [DOI] [PMC free article] [PubMed] [Google Scholar]
- 19. Anders S., Huber W. Differential Expression Analysis for Sequence Count Data. Genome Biol. 2010, 11(10), R106. [DOI] [PMC free article] [PubMed] [Google Scholar]
- 20. Benjamini Y., Hochberg Y. Controlling the False Discovery Rate: A Practical and Powerful Approach to Multiple Testing. J. R. Stat. Soc. 1995, 57, 289–300. [Google Scholar]
- 21. Bolker B. M. Ecological Models and Data in R; Princeton University Press: Princeton, NJ, 2008. [Google Scholar]
- 22. Finch P. D. Substantive Difference and the Analysis of Histograms from Very Large Samples. J. Histochem Cytochem. 1979, 27, 800. [DOI] [PubMed] [Google Scholar]
- 23. Robles J., Qureshi S., Stephen S., et al. Efficient Experimental Design and Analysis Strategies for the Detection of Differential Expression Using RNA-Sequencing. BMC Genom. 2012, 13, 484. [DOI] [PMC free article] [PubMed] [Google Scholar]
- 24. Shalem O., Sanjana N. E., Hartenian E., et al. Genome-Scale CRISPR-Cas9 Knockout Screening in Human Cells. Science 2014, 343, 84–87. [DOI] [PMC free article] [PubMed] [Google Scholar]
- 25. Wang T., Wei J. J., Sabatini D. M., et al. Genetic Screens in Human Cells Using the CRISPR-Cas9 System. Science 2014, 343, 80–84. [DOI] [PMC free article] [PubMed] [Google Scholar]
- 26. Koike-Yusa H., Li Y., Tan E. P., et al. Genome-Wide Recessive Genetic Screening in Mammalian Cells with a Lentiviral CRISPR-Guide RNA Library. Nat. Biotech. 2014, 32, 267–273. [DOI] [PubMed] [Google Scholar]
Associated Data
This section collects any data citations, data availability statements, or supplementary materials included in this article.