Abstract
Cancer drug discovery is an involved process spanning efforts from several fields of study and typically requires years of research and development. However, the advent of high-throughput genomic technologies has allowed for the use of in silico, genomics-based methods to screen drug libraries and accelerate drug discovery. Here we present a novel approach to computationally identify drug candidates for the treatment of breast cancer. In particular, we developed a Drug Regulatory Score similarity metric to evaluate gene expression profile similarity, in the context of drug treatment, and incorporated time-to-event patient survival information to develop an integrated analysis pipeline: Integrated Drug Expression Analysis (IDEA). We were able to predict drug candidates that have been known and those that have not been known in the literature to exhibit anticancer effects. Overall, our method enables quick preclinical screening of drug candidates for breast cancer and other diseases by using the most important indicator of drug efficacy: survival.
Study Highlights.
WHAT IS THE CURRENT KNOWLEDGE ON THE TOPIC? ☑ Large-scale genomic projects have allowed for the utilization of drug treatment profiles and disease profiles to aid in drug discovery. However, the direct clinical usefulness of these data has not been demonstrated in a rigorous manner. • WHAT QUESTION DID THIS STUDY ADDRESS? ☑ This investigation aimed to integrate patient survival information from large-scale breast cancer genomic datasets to evaluate drug efficacy. It also introduces a novel approach to assessing the similarity between drug treatment profiles and disease gene expression profiles. • WHAT THIS STUDY ADDS TO OUR KNOWLEDGE ☑ Molecular information captured in drug treatment profiles derived from cancer cell lines can be used in conjunction with clinical and gene expression data from primary tumors to identify novel breast cancer drugs. It introduces an in silico screening method that can be introduced into current preclinical drug discovery pipelines to make them faster and more efficient. • HOW THIS MIGHT CHANGE CLINICAL PHARMACOLOGY AND THERAPEUTICS ☑ The results from this study introduce an effective computational drug screening schema that can modify how new therapeutic compounds are identified. Instead of using time-consuming in vitro screening experiments to identify lead compounds, it may be possible to narrow down potential leads computationally before committing to more resource-intensive methods. Additionally, it suggests that tumor gene expression profiles can be used to guide drug treatment regimens in the clinic.
Early-stage attrition of candidate therapeutic compounds for cancer is commonplace in today's drug discovery pipelines due to the complexity associated with drug action. As such, the combination of large-scale data integration and computing power shows significant promise in transforming drug discovery into a more analytical, systematic, and comprehensive enterprise.1 In recent years, the Connectivity Map (CMap) has gained popularity by providing an invaluable resource containing drug effect information obtained through large-scale molecular profiling of drug-treated cell lines.2 Many methods have been proposed to utilize these vast resources of genomic information to accelerate drug development, including key studies by Sirota et al., Dudley et al., and Hassane et al.1,3–12
Despite the encouraging results of these studies, using treatment profile similarity based on ex vivo or in vivo cell line experiments as proxies for overall drug effect/action similarity has certain limitations, especially if it is to be extrapolated to clinical settings.13 Thus, in this study we hypothesized that the inclusion of cancer patient time-to-event survival information into drug treatment screening procedures can be used to more accurately identify and reposition drug candidates. In addition, we claim that it is also possible to stratify patients into different prognostic groups using this approach. Specifically, we integrated breast cancer gene expression and clinical survival information with CMap drug treatment profiles (DTPs) in a systematic analysis to identify lead candidate therapeutics for breast cancer.2 In our approach, we circumvent obstacles encountered by Amelio et al. including incomplete drug-protein interactomes and determining P-value cutoffs by developing the Drug Regulatory Score (DRS) metric system that is more sensitive to gene expression changes than methods that involve defining gene sets and calculating enrichment as performed by Amelio et al., or using simple correlation analysis of DTPs.14,15 The DRS captures information about the magnitude of change of all genes in a tumor gene expression profile (GEP) and utilizes the entire DTP, which is more representative of the overall effect of a drug on the final phenotype.
Broadly, we interrogated all MCF7 cell line DTPs from CMap against primary breast tumor GEPs to derive a DRS; a modified similarity metric adapted from our previous study.2,16,17 We then implemented Cox proportional hazards survival analysis using DRS as input to identify drugs associated with patient survival.18 Furthermore, we show that DRS can predict tumor metastatic potential in patients from an independent dataset published by Vijver et al. using unsupervised clustering and a random forest machine learning classifier.19 Finally, we verify that DRS can be used as a predictive marker for paclitaxel-based neoadjuvant chemotherapy using another independent dataset published by Hatzis et al.20
METHODS
Datasets
Normalized METABRIC (n = 2,136) breast cancer gene expression datasets were downloaded from the European Genome-Phenome Archive (http://www.ebi.ac.uk/ega/) under the accession number EGAS00000000083.16 Normal samples were removed leaving a total of 1,996 samples for our analysis. The normalized Vijver (n = 260) dataset was downloaded from the Netherlands Cancer Institute's data portal (http://ccb.nki.nl/data/). The normalized Hatzis (n = 508) and Ur-Rehman (n = 1,570) breast cancer gene expression datasets were downloaded from the gene expression omnibus (GEO) under the accession numbers GSE25066 and GSE47561, respectively.20,21 The Hatzis dataset consisted of HER2-negative breast cancer tumors GEPs measured prior to neoadjuvant paclitaxel treatment. Time-to-event clinical information was collected over the course of neoadjuvant paclitaxel treatment.20 All datasets included time-to-event survival information and other clinical information including subtype, tumor grade, metastatic potential, etc. Raw DTPs (.CEL files) derived from MCF7, HL60, and PC3 cell lines and supplementary drug information were downloaded from the Connectivity Map data portal (https://www.broadinstitute.org/cmap/).2
Data preprocessing of DTPs
Robust Microarray Analysis (RMA) was used for background correction of .CEL DTPs (n = 1,215), followed by quantile normalization, and fitting of a multichip linear model to each probe set; all techniques were implemented using the "affy" library from Bioconductor.22 Probe sets were collapsed based on average intensity values. Gene fold-change was calculated by taking the ratio of treatment and control intensities followed by a log2-transformation. Genes with a log2 fold-change >0 were labeled as the "up" group, and genes with a log2 fold-change <0 were labeled as the "dn" group. Log-transformed values were z-transformed so that intensity values followed a standard normal distribution From this distribution, a two-sided P-value was derived for each gene and −log10-transformed to yield exponentially distributed values (−log10(p-value) ∼ Exp(λ)), which assigned heavier weights to more statistically significant genes when calculating DRS scores. Values >20 were set to 20; all values were then divided by 20 so that they took on a value with a range of 0 to 1. The final set of relative values corresponding to a drug was defined as the drug treatment profile or DTP.
Calculation of DRS
For each DTP, a DRS was calculated for each patient GEP using a modified version of an algorithm published by Zhu et al.17 Namely, each DTP was treated as a vector d = [d1,d2,d3…dj…dn]; where dj = – log(P-value) and n = # of genes. We then defined a patient's molecular profile as the vector g = ⟨g1,g2,g3…gj…gn⟩;, containing the sorted (decreasing) gene expression intensities for each gene gj. d was sorted according to g. We then calculated a pre-DRS (pDRS) for the "up" and "down" gene categories for each DTP by applying the following formulas: First, we calculate the foreground f(i) and background b(i) functions.
 |
1 |
 |
2 |
Second, we calculate the pDRS for the "up" group (pDRSup) and the "dn" group (pDRSdn), separately.
| 3a |
| 3b |
| 3c |
The pDRSup/dn is then normalized by 1) permuting the gene labels in the patient profile m times (e.g., m = 1,000) and repeating steps 1–3 to yield a null pDRSup/dn distribution and 2) dividing by the average of the null to yield DRSup/dn. We then computed DRSup – DRSdn to yield the final DRS. For each breast cancer dataset, we constructed a matrix where each element contained the DRS for each drug-sample pair (Supplementary File 1).
Survival analysis
Survival analysis was carried out for each drug, using the drug's DRS profile and patient clinical information included in breast cancer datasets. A univariate Cox proportional hazards model was fitted for each drug using the DRS as the independent variable.18 The model is formulized below:
where h(t|DRS) is the hazard function given the DRS and h0(t) is the baseline hazard, both at time t. We also fitted multivariate models to correct for potential confounding clinical factors by including patient age at diagnosis, tumor grade, tumor size, tumor stage, estrogen receptor (ER) status, HER2 status, and PR status as additional model covariates. The multivariate model is formulized below:
where x is the design matrix containing the drug's DRS profile and clinicopathological covariates, and their associated value for each patient. Schoenfeld residuals were analyzed to evaluate the proportional hazards assumption for all fitted models. The Wald test was used to assess significance of model parameters and outputted P-values were adjusted for multiple hypothesis testing using the Benjamini-Hochberg procedure (all P-values presented in the Results were adjusted unless noted otherwise).23 Drugs yielding a P < 1E-5 were presumed to exhibit a significant pharmacological effect in breast cancer patients. Kaplan-Meier estimators and log-rank tests were used to compare survival rates between patients stratified on DRS. Patients were generally split at DRS = 0; if this yielded disproportionate sample groups, patients were stratified at DRSmedian instead. Survival analysis was implemented using the "survival" R package (Supplementary File 1).
GO enrichment analysis
For ciclosporin, genes with a fold-change <0.5 between treatment and control samples were used as the downregulated gene list that was inputted into the DAVID functional annotation tool (http://david.abcc.ncifcrf.gov/) to calculate enrichment of GO Biological Process terms in the downregulated gene set.24
Machine learning analysis
Unsupervised hierarchical clustering of the patients in the Vijver dataset was performed using DRS profiles that exhibited a statistically significant difference between metastatic and nonmetastatic tumors.19 In total, 84 DRS profiles yielded P < 0.005 (Wilcoxon test), and were included as features in the clustering analysis. A random forest classifier was trained using the same features to predict the metastatic identity of tumors based on the 84 DRS profiles. Ten-fold cross-validation and calculation of the area under the curve (AUC) of the receiver operating characteristic (ROC) curve were used to evaluate model performance. Clustering analysis and the random forest model were implemented using the R packages "gplots" and "randomForest," respectively.
Drug information
Information about US Food and Drug Administration (FDA)-approved drugs was derived from the National Cancer Institute's cancer drug information webpage (http://www.cancer.gov/cancertopics/druginfo/breastcancer), which also provides links to more detailed drug descriptions. Literature information about drugs mentioned in this study is provided in the Supplementary Information.
RESULTS
Overview of analysis
Our computational pipeline begins by first calculating a DRS between a DTP and a tumor GEP for each drug-tumor pair; a high DRS indicates that the baseline GEP of a tumor sample closely reflects the DTP that is induced by a drug, and vice versa for a low DRS (Figure 1). A Cox proportional hazards model was then fitted to the DRS profile (DRS across all patient tumors) of each drug to evaluate its association with disease-specific patient survival (Figure 1).18 If the DRS profile of a drug was significantly correlated with patient survival, we considered the drug to be a potential therapeutic candidate. Moreover, to underscore the application of our methodology to precision medicine, we modified our models to identify candidates in several molecular subtypes of breast cancer.
Figure 1.
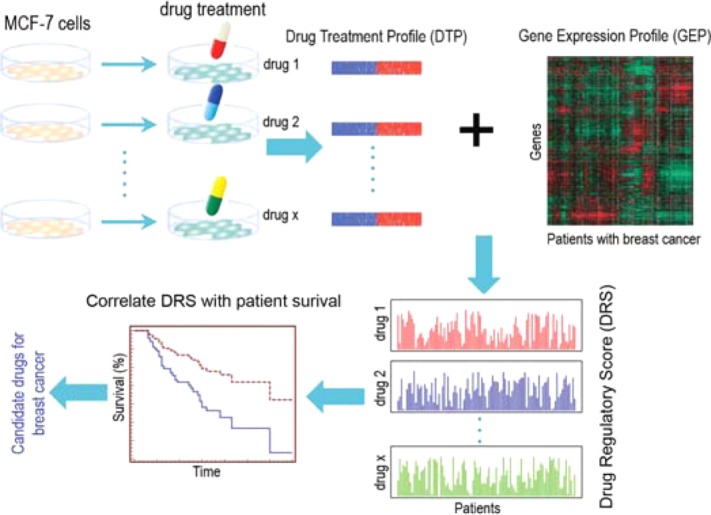
Overview of IDEA. Treatment and control DTPs derived from MCF-7 cell lines were downloaded from CMap and combined to construct a DTP. DTPs were then compared against GEPs (GEP) of each patient from the breast cancer dataset of interest to generate a DRS. This resulted in a DRS profile for each drug. Each DRS profile was then used as the covariate(s) in Cox proportional hazards models. All drugs with DRS profiles that were significantly associated with patient survival were considered potential therapeutic candidates.
To further evaluate DRS as an effective metric, we demonstrated that DRS captures the molecular differences between tumors by training a random forest classifier that could differentiate tumors with high and low metastatic proclivities using DRS across significant drugs as features. Additionally, we confirmed that there was a statistically significant difference between the DRS of patients with different residual cancer burden (RCB) scores. Overall, Integrated Drug Expression Analysis (IDEA) identifies drug candidates that can modulate the baseline expression of primary breast tumors in a way that affects patient survival time.
Systematic identification of survival associated drugs in breast cancer
Global summary of results
By hypothesizing that drugs with DRS profiles that significantly correlate with patient survival are pharmacologically active, we were able to identify several candidates using the METABRIC dataset from Curtis et al. (Supplementary Table S1).16 These candidates belonged to a variety of pharmacological classes including known antineoplastic agents, antioxidants, hormone therapeutics, and immunosuppressants (Supplementary Chart S1). To note, the CMap dataset contains data corresponding to several replicate treatment experiments with varying concentrations for each drug.2 Thus, we chose the replicate that yielded the most significant P-value from the survival analysis to represent the drug. Replicates where higher drug concentrations were used typically yielded more significant results. Figure 2 shows the P-value and hazard ratio (HR) distribution (Cox proportional hazards model) of all drugs after selecting the most significant replicate. In total, there were 169 drugs (out of 1,215 drugs) that yielded P < 1E-05 with 110 of these having HR <1 and 59 having HR >1, when all samples were included in the analysis (Supplementary Table S1). We reasoned that drugs whose DRS profiles yield P < 1E-5 from the model will exhibit a pharmacologic effect (therapeutic or toxic). For example, alpha-estradiol was predicted to have an effect with P = 1.1E-20, Wald test, HR = 0.91, along with scoulerine with P = 1.3E-15, Wald test, HR = 1.1 (Supplementary Table S1). Figure 2b,c shows Kaplan-Meier plots for these two drugs, respectively, where patients are stratified by DRS. Patients with high alpha-estradiol DRS exhibited improved survival, whereas patients with low scoulerine DRS exhibited better prognosis.
Figure 2.
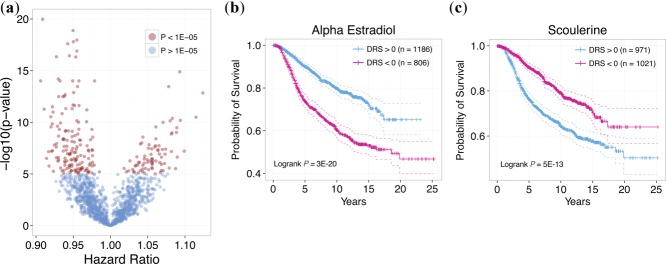
Output of IDEA. (a) Distribution of hazard ratios and P-values for all drugs. Each point corresponds to a drug, with red points corresponding to drugs with P < 1E-5 and blue points corresponding to drugs with P > 1E-5. Drugs with HR <1 indicates that survival is correlated with increased similarity of the DTP with breast cancer GEPs. Drugs with HR >1 indicates that survival is anticorrelated with increased similarity of the DTP with breast cancer GEPs. (b) Kaplan-Meier plot of patients with DRS >0 and DRS <0 for alpha estradiol. Patients with high DRS exhibit significantly more favorable prognosis than patients with low DRS (P = 3E-20, Logrank test). (c) Kaplan-Meier plot of patients with DRS >0 and DRS <0 for scoulerine. Patients with low DRS exhibit significantly more favorable prognosis than patients with high DRS (P = 5E-13, Logrank test).
Association of model coefficients with drug effect
In light of these results, we note that the interpretability of the HR is limited in the context of this study. Specifically, DTPs yielding an HR <1 indicates that patients with GEPs similar to that induced by the drugs in MCF7 cell lines (high DRS) tend to have better prognosis. This may suggest that patients with lower DRS would be most responsive to the drug because their GEPs are most dissimilar to the drug's DTP, possibly indicating that the drug may "reverse" the patients' GEPs to mimic that of high DRS patients. Alternatively, it may be that patients with high DRS would be more responsive because it may be easier for the drug to enhance an already similar GEP rather than act against a dissimilar one. Indeed, these two possibilities are not mutually exclusive, given the complexity of drug action, and may vary depending on the drug (see Discussion). Despite the fact that predicted drugs may exhibit a general therapeutic or toxic effect, it is reasonable to conclude that not every patient will respond similarly to each drug. Hence, our analysis also allows us to identify patients who will not respond in a way similar to that of the general sample population. More specifically, patient samples can be stratified based on their DRS. For example, if we stratify patients into groups based on their DRS for alpha estradiol, patients with DRS >0 exhibited a more favorable prognosis than patients with DRS <0 (P = 3E-20, Wald test, Figure 2b). This indicates that, in general, alpha-estradiol may have a pharmacological effect in breast cancer patients but only a select group may be responsive. This demonstrates that we can both evaluate the overall effect of drugs and subsequently predict individual patient response to them based on their DRS.
Identification of chemotherapeutics, PI3K inhibitors, and novel drug indications
Moreover, we identified chemotherapy drugs in our analysis including etoposide and methotrexate (Figure 3a,b). These results suggest that our analysis was able to identify known anticancer agents, thus validating our results.25,26 Second, we identified lovastatin and levonorgestrel, both of which are currently undergoing clinical trials for the treatment of breast and ovarian cancer, respectively (ClinicalTrials.gov Identifiers: NCT00285857 (lovastatin), NCT00445887 (levonorgestrel)) (Supplementary Chart S1, Figure 3c).27
Figure 3.
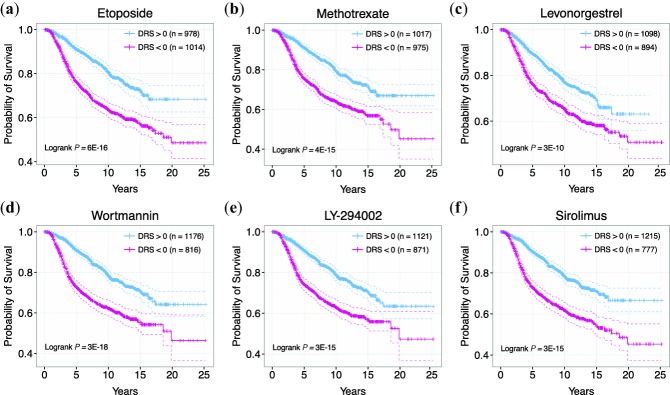
Examples of drug candidates belonging to different pharmacological classes. (a) Kaplan-Meier curves of patients with DRS >0 and DRS <0 for etoposide. (b) Kaplan-Meier curves of patients with DRS >0 and DRS <0 for methotrexate. (c) Kaplan-Meier curves of patients with DRS >0 and DRS <0 for levonorgestrel. (d) Kaplan-Meier curves of patients with DRS >0 and DRS <0 for wortmannin. (e) Kaplan-Meier curves of patients with DRS >0 and DRS <0 for LY-294002. (f) Kaplan-Meier curves of patients with DRS >0 and DRS <0 for sirolimus.
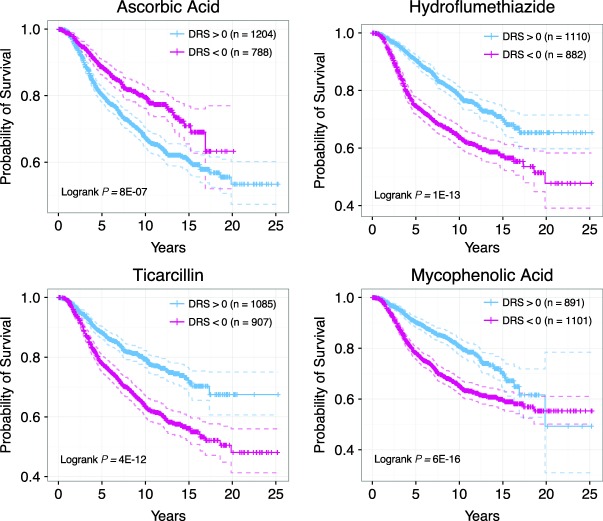
In support of our hypothesis that survival information can reveal bioactive drug leads, we were able to identify a number of drugs that have been experimentally shown to exhibit anticancer activity. In particular, we identified several phosphatidylinositol-4,5-bisphosphate 3-kinase (PI3K) pathway inhibitors that are known to inhibit proliferation, reduce angiogenesis, and induce apoptosis in cancer cell lines.28–30 Identified PI3K/mTOR inhibitors include wortmannin, LY-294002, and sirolimus (Figure 3d–f).28,31–47 In addition to known drugs, we identified drug candidates that have not yet been experimentally tested or lack rigorous testing. Among these compounds are ciclosporin, ascorbic acid, hydroflumethiazide, ticarcillin, and mycophenolic acid (Figures 4, 5). To show that these candidates have therapeutic potential, we exemplify the case of ciclosporin (P = 4.69E-12, HR = 0.94, Figure 5a), which has a DTP similar to that of thapsigargin, a drug shown to delay tumor growth in multiple cancer mouse xenograft models.48,49 Ciclosporin's DTP was significantly correlated with the DTPs of only a few drugs, as shown by the distribution of correlation coefficients (Figure 5b).2 This suggests that the mechanism of action of ciclosporin, if it does possess anticancer activity, is inherently different from that of other top drugs identified in our analysis. Interestingly, ciclosporin was significantly correlated with thapsigargin in their GEPs with a Pearson's correlation coefficient of 0.6 (Figure 5c). The fact that simple correlation analysis was able to detect a high similarity between the two DTPs suggests that ciclosporin may be related to thapsigargin in terms of drug effect. Additionally, we calculated the enrichment of Gene Ontology Biological Process terms in genes that were significantly downregulated between ciclosporin treatment and control groups (Figure 5d, Supplementary Table S2). Interestingly, we found highly relevant cancer-associated pathways such as "steroid hormone receptor signaling pathway," "regulation of cell cycle," and "regulation of apoptosis" enriched in the downregulated gene set, suggesting that ciclosporin may have a bioactive effect on cancer growth. Overall, these results indicate that the drugs we identified that are not currently recognized as cancer therapeutics may in fact be strong candidates for further experimental testing.
Figure 4.
Examples of drug candidates not previously considered for chemotherapy. (a) Kaplan-Meier curves of patients with DRS >0 and DRS <0 for ascorbic acid. (b) Kaplan-Meier curves of patients with DRS >0 and DRS <0 for hydroflumethiazide. (c) Kaplan-Meier curves of patients with DRS >0 and DRS <0 for ticarcillin. (d) Kaplan-Meier curves of patients with DRS >0 and DRS <0 for mycophenolic acid.
Figure 5.
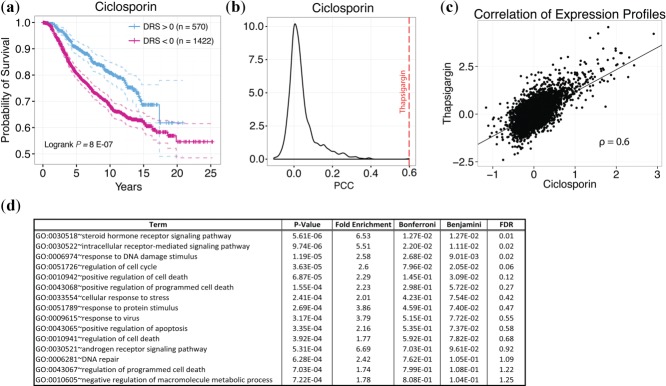
Ciclosporin DTP. (a) Kaplan-Meier curves of patients with DRS >0 and DRS <0 for ciclosporin. (b) Empirical distribution of Pearson correlation coefficients (PCC) from comparing the ciclosporin DTP with all other DTPs. Red line indicates PCC from comparing ciclosporin DTP with thapsigargin DTP. (c) Scatterplot comparing ciclosporin and thapsigargin DTPs. Each point corresponds to a single gene in the DTP. (d) GO enrichment analysis of downregulated genes between treatment and control DTPs for ciclosporin.
Drugs association analysis in stratified breast cancer samples
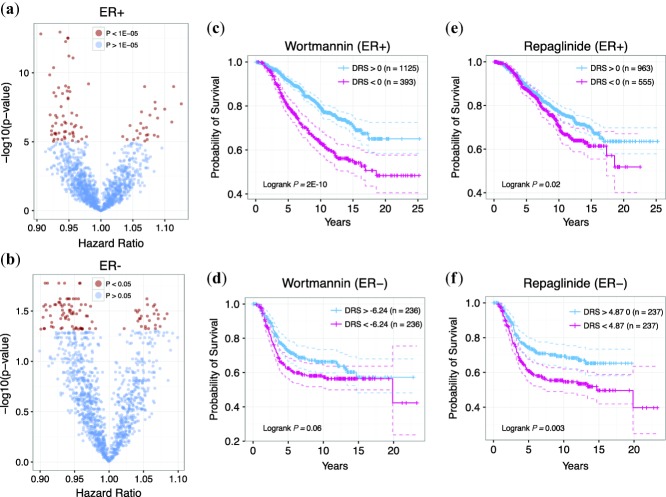
In the clinic, immunohistochemical categorization of breast cancer is an essential component of determining patient prognosis and designing treatment regimens. Thus, the effectiveness of drug treatment may vary according to ER, p53, and/or HER2 expression. As such, we predicted drug candidates for patients belonging to each of the six breast cancer histological subtypes to increase the resolution of our analysis and to approach drug discovery from a precision medicine standpoint. We found several significant drug candidates for ER+ (P < 1E-05, Wald Test), ER– (P < 0.05, Wald Test), p53+ (P < 1E-04, Wald Test), and HER2– (P < 1E-04, Wald Test) breast cancer subtypes and no significant candidates for p53– and HER2+ subtypes (Supplementary Tables S3–S8). Furthermore, to demonstrate that drug efficacy varies across breast cancer subtypes, we compared drugs between ER+ (n = 1,518) and ER– (n = 474) breast cancer groups. Figure 6a,b shows the global P-value and hazard ratio distribution of each drug for ER+ and ER– tumors, respectively. Comparing the top 100 drug candidates from each subtype, we found that only 10 drugs were common between the two groups. This suggests that ER status is an important predictive biomarker for drug efficacy. For instance, wortmannin yielded P = 8.42E-12 (Wald test) and HR = 0.94 in ER+ samples but was not significant in ER– samples (Figure 6c,d). Conversely, repaglinide was significant in ER– samples (P = 0.02, Wald test) but not significant in ER+ samples (Figure 6e,f). These results suggest that our analysis is sensitive to differences in prognostic features exhibited by different tumor groups. Indeed, being able to identify drugs for a specific subset of patients is powerful in that it allows for the development of tailored treatments based on optimal drug efficacy.
Figure 6.
Drug candidates for ER+ and ER– patients. (a) P-value and hazard ratio distribution for all drugs for ER+ patients. (b) P-value and hazard ratio distribution for all drugs for ER– patients. Red points indicate drugs with P < 1E-5 and blue points indicate drugs with P > 1E-5. (c) Kaplan-Meier curves of patients with and for wortmannin for ER+ patients. (d) Kaplan-Meier curves of patients with and for wortmannin for ER– patients. (e) Kaplan-Meier curves of patients with and for repaglinide for ER+ patients. (f) Kaplan-Meier curves of patients with and for wortmannin for ER– patients. For ER– patients, stratifying patients at yields disproportionate sample sizes; therefore, the median DRS was used instead.
Integrative model for metastasis prediction using drug regulatory scores
Since metastasis is an important driver of cancer progression, we postulated that there would be a relationship between metastatic tumors and their DRS profiles. If DRS does indeed capture information regarding metastatic tendency, then the distribution of DRS should be different between metastatic and nonmetastatic tumors. Thus, we also aimed to evaluate the predictive power of DRS in stratifying patients based on whether their tumors became metastatic by applying IDEA to an independent breast cancer dataset from van de Vijver et al.19 We first identified 84 DRS profiles that exhibited the greatest difference between metastatic and nonmetastatic tumor samples and then clustered samples based on these DRS profiles to derive three apparent clusters corresponding to the metastatic identity of the samples (see Methods). The first cluster had 48 metastatic samples out of 103 (47%), the second cluster had 27 metastatic samples out of 99 (27%), and the third cluster had eight metastatic clusters out of 58 (14%) (Figure 7a). This indicates that DRS profiles can distinguish differences in metastatic potential between breast cancer tumors, and implies that treatment with a subset (cluster) of these drugs may predispose a tumor to take on a prometastatic molecular identity. Conversely, another subset may reverse a tumor's tendency to metastasize. To further evaluate this idea, we trained a random forest classifier with the same DRS profile features to determine if it could accurately stratify metastatic and nonmetastatic tumors, and evaluated its performance using 10-fold cross-validation. The model achieved an AUC of 0.71 calculated from the ROC curve, suggesting that DRS is an informative predictor when classifying tumors based on a known survival-associated phenotype (Figure 7b). Furthermore, we implemented IDEA in the van de Vijver et al. dataset and were able to validate 28 drugs (P < 0.05, Wald test) including wortmannin, LY-294002, and etoposide (Supplementary Table S9). Additionally, we were able to validate 20 of the 25 top candidates in an independent meta-dataset compiled and normalized by Ur-Rehman et al.,21 indicating that our methodology is robust across different datasets. (P < 0.05, Supplementary Table S10).
Figure 7.
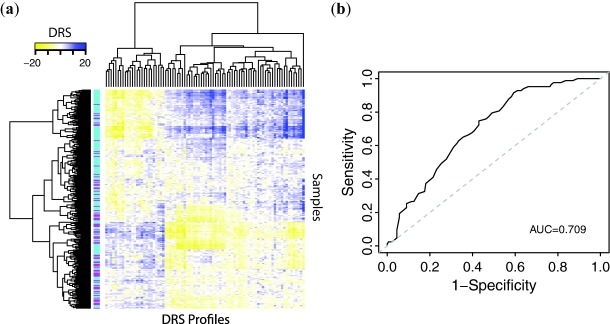
Use of DRS profiles to predict metastasis. (a) Hierarchical clustering of DRS profiles. Magenta sample labels indicate metastatic tumors and aqua sample labels indicate nonmetastatic tumors. (b) Receiver operating characteristic curve for random forest machine learning classifier, using 84 most significant DTPs.
Predicting patient response to neoadjuvant chemotherapy using drug regulatory scores
Because our previous results were derived using survival data that were collected over the course of entire treatment periods, we aimed to determine if DRS could stratify patients that would respond well to neoadjuvant chemotherapy. Thus, we focused on the paclitaxel DRS profile since paclitaxel is a common chemotherapeutic administered in the clinic. Following our claim that the efficacy of a drug can be determined by its DRS profile, we constructed a Kaplan-Meier estimator for patient survival in the METABRIC dataset using the paclitaxel DRS profile and observed that patients with DRS >0 show poor survival (Supplementary Figure S1A). Although patients in the METABRIC dataset with DRS >0 exhibited poor prognosis, the observed difference in survival rates is still indicative of pharmacological activity. We then applied the paclitaxel DTP to an independent breast cancer dataset, published by Hatzis et al.,20 that includes patients who were administered neoadjuvant paclitaxel therapy. We generated a DRS profile for paclitaxel in the Hatzis dataset and found that the DRS of RCB-I (low residual cancer burden) tumors were significantly larger than the DRS of RCB-II/III (high residual cancer burden) tumors (P = 0.01, Wilcoxon test, Supplementary Figure S1B). This indicates that the paclitaxel DRS profile can be used as a predictive marker. Additionally, this result suggests that the patients with DRS >0 (poor survival group) in the METABRIC dataset would have been more responsive to the effects of paclitaxel. Overall, we were able to validate predicted paclitaxel pharmacological activity in a separate dataset where patients were actually treated with paclitaxel.
DISCUSSION
In this study we introduce the DRS and show that by using it in conjunction with time-to-event clinical survival information we can identify novel cancer therapeutics for different breast cancer subtypes. Despite the success of our method, we remark that there are several limitations to our approach, many of which partially stem from a lack of appropriate data. First, interpreting the hazard ratio is difficult in that we, as of yet, do not understand the biological implications regarding high-matching profiles (high DRS) and low-matching profiles (low DRS). In other words, it is unknown whether patients with high DRS will benefit from the drug due to enhancement of its current GEP or if patients with low DRS will benefit more because the drug will induce an opposite effect. Indeed, both mechanisms are simultaneously possible, making interpretation even more difficult. Moreover, this implies that our drug candidates may either be therapeutic or toxic in nature, and the effects may and probably do vary across individuals. Second, our method is based on the assumption that DTPs provide a functional readout of a drug's overall biological activity, which may not always be the case. Likewise, a patient's GEP may not always reflect the molecular events responsible for cancer development. Regardless, we hold that we are able to identify bioactive agents that are indeed associated with patient survival and that this drug identification schema is a reasonable first in silico screening step. Finally, we note that DTPs are derived from MCF7 cell lines, which are ER+, and thus our results may be less accurate in ER– tumor samples. However, we reimplemented IDEA using wortmannin, LY-294002, and sirolimus DTPs from PC3 and HL60 cell lines to show that drug treatment effects remain stable across different cell types (Supplementary Table S11). More generally, cell lines themselves may not be completely representative of actual patient tumors, which are heterogeneous and complex in nature. Despite issues with tissue specificity, cell lines are still informative about the core genes that drive cancer development. We also note that our datasets contain more ER+ samples than ER– samples, which may be why no significant drug candidates were identified for ER– tumor samples after correcting for clinical confounders.
Despite these limitations, our method improves on the current state of in silico drug screening, by using the terminal effect of a drug and molecular profiling of patient tumors to guide preclinical drug development. Furthermore, our approach can be extended to other cancers and diseases for which molecular profiles and clinical information are available. As more drug and clinical data become available, this analytical pipeline can further be modified to incorporate additional information. Moreover, IDEA can be applied to any disease in which GEPs and terminal phenotype data (i.e., survival, flare-ups, outbreaks) are available. Overall, we have presented a novel, integrated, and flexible approach to in silico drug profiling that can achieve results consistent with the known drug literature, identify novel therapeutic candidates, and be potentially applied to other diseases.
Acknowledgments
This work was supported by the American Cancer Society Research grant IRG-82-003-270, the Centers of Biomedical Research Excellence (COBRE) grant GM103534, and the start-up funding package provided to CC by the Geisel School of Medicine at Dartmouth College.
CONFLICT OF INTEREST
The authors declare no conflicts of interest. The funders had no role in the design of the method, data selection and analysis, decision to publish, or preparation of the article.
AUTHOR CONTRIBUTIONS
M.H.U. and F.S.V. wrote the article; C.C. designed the research; C.C., M.H.U., and F.S.V. performed the research; C.C. and M.H.U. analyzed the data; C.C. contributed new reagents/analytical tools.
Additional Supporting Information may be found in the online version of this article.
Supporting Information
Supporting Information
Supporting Information
Supporting Information
Supporting Information
Supporting Information
Supporting Information
Supporting Information
Supporting Information
Supporting Information
Supporting Information
Supporting Information
Supporting Information
Supporting Information
Supporting Information
References
- Hurle MR, Yang L, Xie Q, Rajpal DK, Sanseau P. Agarwal P. Computational drug repositioning: from data to therapeutics. Clin. Pharmacol. Ther. 2013;93:335–341. doi: 10.1038/clpt.2013.1. [DOI] [PubMed] [Google Scholar]
- Lamb J, et al. The Connectivity Map: using gene-expression signatures to connect small molecules, genes, and disease. Science. 2006;313:1929–1935. doi: 10.1126/science.1132939. [DOI] [PubMed] [Google Scholar]
- Sirota M, et al. Discovery and preclinical validation of drug indications using compendia of public gene expression data. Sci. Transl. Med. 2011;3:96ra77. doi: 10.1126/scitranslmed.3001318. [DOI] [PMC free article] [PubMed] [Google Scholar]
- Dudley JT, et al. Computational repositioning of the anticonvulsant topiramate for inflammatory bowel disease. Sci. Transl. Med. 2011;3:96ra76. doi: 10.1126/scitranslmed.3002648. [DOI] [PMC free article] [PubMed] [Google Scholar]
- Hassane DC, et al. Discovery of agents that eradicate leukemia stem cells using an in silico screen of public gene expression data. Blood. 2008;111:5654–5662. doi: 10.1182/blood-2007-11-126003. [DOI] [PMC free article] [PubMed] [Google Scholar]
- Jahchan NS, et al. A drug repositioning approach identifies tricyclic antidepressants as inhibitors of small cell lung cancer and other neuroendocrine tumors. Cancer Disc. 2013;3:1364–1377. doi: 10.1158/2159-8290.CD-13-0183. [DOI] [PMC free article] [PubMed] [Google Scholar]
- Kinnings SL, Liu N, Buchmeier N, Tonge PJ, Xie L. Bourne PE. Drug discovery using chemical systems biology: repositioning the safe medicine Comtan to treat multi-drug and extensively drug resistant tuberculosis. PLoS Comput. Biol. 2009;5:e1000423. doi: 10.1371/journal.pcbi.1000423. [DOI] [PMC free article] [PubMed] [Google Scholar]
- van Noort V, et al. Novel drug candidates for the treatment of metastatic colorectal cancer through global inverse gene-expression profiling. Cancer Res. 2014;74:5690–5699. doi: 10.1158/0008-5472.CAN-13-3540. [DOI] [PubMed] [Google Scholar]
- Iorio F, et al. Discovery of drug mode of action and drug repositioning from transcriptional responses. Proc. Natl. Acad. Sci. U. S. A. 2010;107:14621–14626. doi: 10.1073/pnas.1000138107. [DOI] [PMC free article] [PubMed] [Google Scholar]
- Cheng F, et al. Prediction of drug-target interactions and drug repositioning via network-based inference. PLoS Comput Biol. 2012;8:e1002503. doi: 10.1371/journal.pcbi.1002503. [DOI] [PMC free article] [PubMed] [Google Scholar]
- Zhao H, et al. Novel modeling of cancer cell signaling pathways enables systematic drug repositioning for distinct breast cancer metastases. Cancer Res. 2013;73:6149–6163. doi: 10.1158/0008-5472.CAN-12-4617. [DOI] [PMC free article] [PubMed] [Google Scholar]
- Lussier YA. Chen JL. The emergence of genome-based drug repositioning. Sci. Transl. Med. 2011;3:96ps35. doi: 10.1126/scitranslmed.3001512. [DOI] [PMC free article] [PubMed] [Google Scholar]
- Crockett SD, Schectman R, Sturmer T. Kappelman MD. Topiramate use does not reduce flares of inflammatory bowel disease. Dig. Dis. Sci. 2014;59:1535–1543. doi: 10.1007/s10620-014-3040-7. [DOI] [PMC free article] [PubMed] [Google Scholar]
- Amelio I, Gostev M, Knight RA, Willis AE, Melino G. Antonov AV. DRUGSURV: a resource for repositioning of approved and experimental drugs in oncology based on patient survival information. Cell Death Dis. 2014;5:e1051. doi: 10.1038/cddis.2014.9. [DOI] [PMC free article] [PubMed] [Google Scholar]
- Pacini C, et al. DvD: An R/Cytoscape pipeline for drug repurposing using public repositories of gene expression data. Bioinformatics. 2013;29:132–134. doi: 10.1093/bioinformatics/bts656. [DOI] [PMC free article] [PubMed] [Google Scholar]
- Curtis C, et al. The genomic and transcriptomic architecture of 2,000 breast tumours reveals novel subgroups. Nature. 2012;486:346–352. doi: 10.1038/nature10983. [DOI] [PMC free article] [PubMed] [Google Scholar]
- Zhu M, Liu CC. Cheng C. REACTIN: regulatory activity inference of transcription factors underlying human diseases with application to breast cancer. BMC Genomics. 2013;14:504. doi: 10.1186/1471-2164-14-504. [DOI] [PMC free article] [PubMed] [Google Scholar]
- Cox DR. Regression models and life-tables. J. R. Stat. Soc. B. 1972;34:187. [Google Scholar]
- van de Vijver MJ, et al. A gene-expression signature as a predictor of survival in breast cancer. N. Engl. J. Med. 2002;347:1999–2009. doi: 10.1056/NEJMoa021967. [DOI] [PubMed] [Google Scholar]
- Hatzis C, et al. A genomic predictor of response and survival following taxane-anthracycline chemotherapy for invasive breast cancer. JAMA. 2011;305:1873–1881. doi: 10.1001/jama.2011.593. [DOI] [PMC free article] [PubMed] [Google Scholar]
- Ur-Rehman S, Gao Q, Mitsopoulos C. Zvelebil M. ROCK: a resource for integrative breast cancer data analysis. Breast Cancer Res. Treat. 2013;139:907–921. doi: 10.1007/s10549-013-2593-z. [DOI] [PubMed] [Google Scholar]
- Irizarry RA, et al. Exploration, normalization, and summaries of high density oligonucleotide array probe level data. Biostatistics. 2003;4:249–264. doi: 10.1093/biostatistics/4.2.249. [DOI] [PubMed] [Google Scholar]
- Benjamini Y. Hochberg Y. Controlling the false discovery rate—a practical and powerful approach to multiple testing. J. Roy. Stat. Soc. B Met. 1995;57:289–300. [Google Scholar]
- Huang DW, et al. DAVID Bioinformatics Resources: expanded annotation database and novel algorithms to better extract biology from large gene lists. Nucleic Acids Res. 2007;35:W169–175. doi: 10.1093/nar/gkm415. [DOI] [PMC free article] [PubMed] [Google Scholar]
- Wright JC, Prigot A, Wright B, Weintraub S. Wright LT. An evaluation of folic acid antagonists in adults with neoplastic diseases: a study of 93 patients with incurable neoplasms. J. Natl. Med. Assoc. 1951;43:211–240. [PMC free article] [PubMed] [Google Scholar]
- Busse D, et al. Pharmacokinetics of intravenous etoposide in patients with breast cancer: influence of dose escalation and cyclophosphamide and doxorubicin coadministration. Naunyn Schmiedeberg's Arch. Pharmacol. 2002;366:218–225. doi: 10.1007/s00210-002-0594-2. [DOI] [PubMed] [Google Scholar]
- Corbelli J. Bimla Schwarz E. Emergency contraception: a review. Minerva Ginecol. 2014;66:551–564. [PubMed] [Google Scholar]
- Li J, Li F, Wang H, Wang X, Jiang Y. Li D. Wortmannin reduces metastasis and angiogenesis of human breast cancer cells via nuclear factor-kappaB-dependent matrix metalloproteinase-9 and interleukin-8 pathways. J. Int. Med. Res. 2012;40:867–876. doi: 10.1177/147323001204000305. [DOI] [PubMed] [Google Scholar]
- Will M, et al. Rapid induction of apoptosis by PI3K inhibitors is dependent upon their transient inhibition of RAS-ERK signaling. Cancer Discov. 2014;4:334–347. doi: 10.1158/2159-8290.CD-13-0611. [DOI] [PMC free article] [PubMed] [Google Scholar]
- Fruman DA. Rommel C. PI3K and cancer: lessons, challenges and opportunities. Nat. Rev. Drug Discov. 2014;13:140–156. doi: 10.1038/nrd4204. [DOI] [PMC free article] [PubMed] [Google Scholar]
- Schultz RM, et al. In vitro and in vivo antitumor activity of the phosphatidylinositol-3-kinase inhibitor, wortmannin. Anticancer Res. 1995;15:1135–1139. [PubMed] [Google Scholar]
- Yun J, Lv YG, Yao Q, Wang L, Li YP. Yi J. Wortmannin inhibits proliferation and induces apoptosis of MCF-7 breast cancer cells. Eur. J. Gynaecol. Oncol. 2012;33:367–369. [PubMed] [Google Scholar]
- Howes AL, et al. The phosphatidylinositol 3-kinase inhibitor, PX-866, is a potent inhibitor of cancer cell motility and growth in three-dimensional cultures. Mol. Cancer Ther. 2007;6:2505–2514. doi: 10.1158/1535-7163.MCT-06-0698. [DOI] [PubMed] [Google Scholar]
- Ihle NT, et al. Molecular pharmacology and antitumor activity of PX-866, a novel inhibitor of phosphoinositide-3-kinase signaling. Mol. Cancer Ther. 2004;3:763–772. [PubMed] [Google Scholar]
- Akter R, Hossain MZ, Kleve MG. Gealt MA. Wortmannin induces MCF-7 breast cancer cell death via the apoptotic pathway, involving chromatin condensation, generation of reactive oxygen species, and membrane blebbing. Breast Cancer. 2012;4:103–113. doi: 10.2147/BCTT.S31712. [DOI] [PMC free article] [PubMed] [Google Scholar]
- Liu Y, Shreder KR, Gai W, Corral S, Ferris DK. Rosenblum JS. Wortmannin, a widely used phosphoinositide 3-kinase inhibitor, also potently inhibits mammalian polo-like kinase. Chem. Biol. 2005;12:99–107. doi: 10.1016/j.chembiol.2004.11.009. [DOI] [PubMed] [Google Scholar]
- Zhou Y, et al. LY294002 inhibits the malignant phenotype of osteosarcoma cells by modulating the phosphatidylinositol 3kinase/Akt/fatty acid synthase signaling pathway in vitro. Mol. Med. Rep. 2015;11:1352–1357. doi: 10.3892/mmr.2014.2787. [DOI] [PubMed] [Google Scholar]
- Long XH, et al. LY294002 suppresses the malignant phenotype and sensitizes osteosarcoma cells to pirarubicin chemotherapy. Mol. Med. Rep. 2014;10:2967–2972. doi: 10.3892/mmr.2014.2617. [DOI] [PubMed] [Google Scholar]
- Zhao K, et al. SN50 enhances the effects of LY294002 on cell death induction in gastric cancer cell line SGC7901. Arch. Med. Sci. AMS. 2013;9:990–998. doi: 10.5114/aoms.2013.39790. [DOI] [PMC free article] [PubMed] [Google Scholar]
- Qian YJ, et al. Effect of LY294002 on adriamycin-induced epithelial-mesenchymal transition in human breast carcinoma cells. Zhongguo Yi Xue Ke Xue Yuan Xue Bao Acta Acad. Med. Sin. 2012;34:319–323. doi: 10.3881/j.issn.1000-503X.2012.04.002. [DOI] [PubMed] [Google Scholar]
- Ma J, Xie SL, Geng YJ, Jin S, Wang GY. Lv GY. In vitro regulation of hepatocellular carcinoma cell viability, apoptosis, invasion, and AEG-1 expression by LY294002. Clin. Res. Hepatol. Gastroenterol. 2014;38:73–80. doi: 10.1016/j.clinre.2013.06.012. [DOI] [PubMed] [Google Scholar]
- Carminati PO, Donaires FS, Marques MM, Donadi EA, Passos GA. Sakamoto-Hojo ET. Cisplatin associated with LY294002 increases cytotoxicity and induces changes in transcript profiles of glioblastoma cells. Mol. Biol. Rep. 2014;41:165–177. doi: 10.1007/s11033-013-2849-z. [DOI] [PubMed] [Google Scholar]
- Wu D, et al. Phosphatidylinositol 3-kinase inhibitor LY294002 suppresses proliferation and sensitizes doxorubicin chemotherapy in bladder cancer cells. Urol. Int. 2011;87:105–113. doi: 10.1159/000322849. [DOI] [PubMed] [Google Scholar]
- Yamada T, Horinaka M, Shinnoh M, Yoshioka T, Miki T. Sakai T. A novel HDAC inhibitor OBP-801 and a PI3K inhibitor LY294002 synergistically induce apoptosis via the suppression of survivin and XIAP in renal cell carcinoma. Int. J. Oncol. 2013;43:1080–1086. doi: 10.3892/ijo.2013.2042. [DOI] [PubMed] [Google Scholar]
- Badinloo M. Esmaeili-Mahani S. Phosphatidylinositol 3-kinases inhibitor LY294002 potentiates the cytotoxic effects of doxorubicin, vincristine, and etoposide in a panel of cancer cell lines. Fundam. Clin. Pharmacol. 2014;28:414–422. doi: 10.1111/fcp.12043. [DOI] [PubMed] [Google Scholar]
- Yoshioka T, Yogosawa S, Yamada T, Kitawaki J. Sakai T. Combination of a novel HDAC inhibitor OBP-801/YM753 and a PI3K inhibitor LY294002 synergistically induces apoptosis in human endometrial carcinoma cells due to increase of Bim with accumulation of ROS. Gynecol. Oncol. 2013;129:425–432. doi: 10.1016/j.ygyno.2013.02.008. [DOI] [PubMed] [Google Scholar]
- Alayev A, Berger SM, Kramer MY, Schwartz NS. Holz MK. The combination of rapamycin and resveratrol blocks autophagy and induces apoptosis in breast cancer cells. J. Cell. Biochem. 2015;116:450–457. doi: 10.1002/jcb.24997. [DOI] [PMC free article] [PubMed] [Google Scholar]
- Desmedt C, et al. Strong time dependence of the 76-gene prognostic signature for node-negative breast cancer patients in the TRANSBIG multicenter independent validation series. Clin. Cancer Res. 2007;13:3207–3214. doi: 10.1158/1078-0432.CCR-06-2765. [DOI] [PubMed] [Google Scholar]
- Schmidt M, et al. The humoral immune system has a key prognostic impact in node-negative breast cancer. Cancer Res. 2008;68:5405–5413. doi: 10.1158/0008-5472.CAN-07-5206. [DOI] [PubMed] [Google Scholar]
Associated Data
This section collects any data citations, data availability statements, or supplementary materials included in this article.
Supplementary Materials
Supporting Information
Supporting Information
Supporting Information
Supporting Information
Supporting Information
Supporting Information
Supporting Information
Supporting Information
Supporting Information
Supporting Information
Supporting Information
Supporting Information
Supporting Information
Supporting Information
Supporting Information


