Abstract
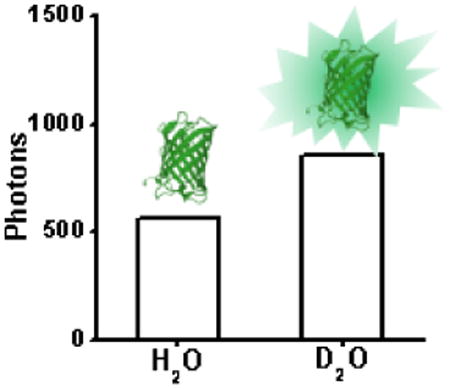
Photoactivatable fluorescent proteins (PA-FPs) are widely used in live single-molecule super-resolution imaging but emit substantially fewer photons than organic dyes do. Here, we show that in heavy water (D2O) instead of H2O, common PA-FPs emit 26 %–54 % more photons, effectively improving the localization precision in super-resolution imaging.

D2O improves the photon yield of photoactivatable fluorescent proteins and thus the localization precision for super-resolution microscopy.
Single molecule super-resolution microscopy methods, commonly referred to as photoactivated localization microscopy (PALM)1 or stochastic optical reconstruction microscopy (STORM)2,3, take advantage of photoconversion of fluorescent probes and imaging single molecules to allow images of cellular ultrastructures to be taken with resolution beyond the diffraction limit of light microscopy.
There are several common strategies in tagging biomolecules with fluorescent probes for super-resolution imaging, namely 1) genetically fusion with photoactivatible fluorescent proteins (PA-FPs); 2) immunolabeling with photoswitchable organic dyes and 3) bioorthogonal covalent labeling with photoswitchable organic dye via self-labeling protein tags such as SNAP, CLIP, TMP or Halo tag. Despite these various options, PA-FP remains the most common method for live cell labeling due to its high specificity and ease of use.4 However, PA-FP has the drawback of being generally dimmer than organic dyes (i.e. emitting fewer number of photons per activation event). Because the localization precision of an individual fluorophore is approximately proportional to the inverse of the square root of the number of photons detected, increasing the amount of photons collected during the imaging process leads to higher localization precision, and hence a higher spatial resolution.
Recently, it had been demonstrated that several photoswitching dyes, including the popular cyanine dyes Cy5 and Alexa Fluor 647,3 shows an increase in photon number in heavy water (D2O), with the maximum increase (2.6 fold) obtained from the near infrared dye Cy7.5 Considering previous studies showing that D2O can differentially affect protein structures and activities,6 we question whether it can also increase the photon yield of PA-FPs.
In this study, we demonstrated that the photon yield of PA-FPs can also be increased by varying extents by adding D2O into the imaging buffer, providing a simple solution to obtaining higher resolution images in super-resolution imaging. In particular, this method is still compatible with live imaging because the imaging experiments only require the cells to be in D2O for no more than 30 min, whereas the adverse effects of D2O, such as to slow growth, cause apoptosis of cells and whole organism and suppressing tumor genesis, tend to occur at a much longer time scale.7 For example, one study on the effect of D2O reported that 60 % of cells survived after being incubated in growth media containing 50 % D2O for 24 hrs7a. Therefore, we believed that this method would also be applicable for live cell super-resolution imaging, which typically lasts for just a few minutes.
First, we measured the photon yields of several commonly used PA-FPs, including PSCFP2,8 PAGFP,9 Dendra2,10 mEos2,11 mEos3.2,12 PAmCherry,13 PAtagRFP14 and the new mMaple315, in imaging buffers containing different amount of D2O. Each PA-FP was genetically fused to the C-terminal of membrane protein CD86, transiently transfected into CHO cells and imaged live using STORM. All PA-FPs were photoactivated using a 405 nm laser. A 488 nm laser was used to excite PSCFP2 and PAGFP, while a 561 nm laser was used to excite Dendra2, mEos2, mEos3.2, mMaple3, PAmCherry and PAtagRFP. Images were recorded at a frame rate of 60 Hz and the typical power for the lasers at the back port of the microscope was 20 mW for the 488 nm imaging laser, 40 mW for the 561 nm imaging laser and 1-500 μW for the 405 nm activation laser, resulting in a power density at the sample of approximately 0.2 kW/cm2, 0.4 kW/cm2 and 0.1-50 W/cm2, respectively. Phosphate-buffered saline (PBS), made from varying H2O to D2O ratio, was used as the imaging buffer. In order to make the method simple and cost-efficient, 100% D2O-based PBS was prepared by dissolving Na2HPO4 and KH2PO4 in D2O instead of using deutrated Na2DPO4 and KD2PO4. Buffers containing different ratio of H2O:D2O were then prepared by mixing different volume of normal PBS and D2O-based PBS.
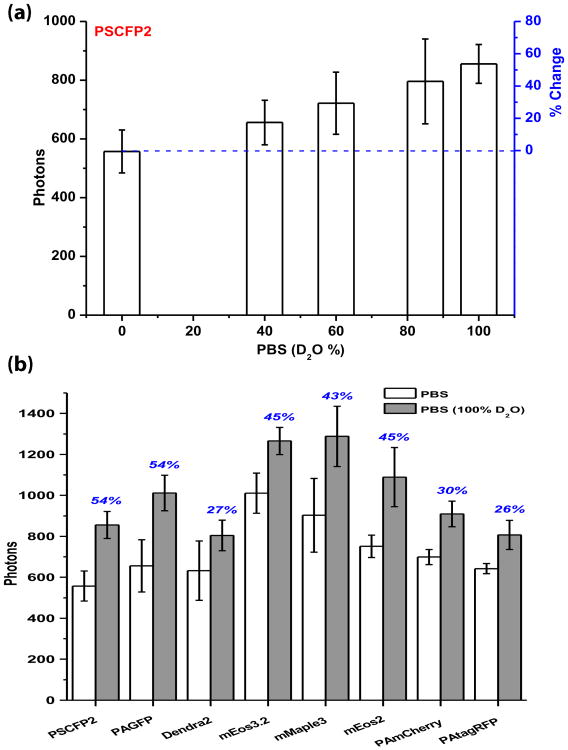
Our results showed that the mean photon numbers per photoactivation event obtained for each of the PA-FPs increased with increasing percentage of D2O in the imaging buffer (Fig. 1a and S.I. Fig. S1). Comparing the photons obtained in imaging buffer containing normal PBS and 100% D2O-based PBS, this increase ranges from 26 % to 54 % (Fig. 1b). PSCFP2 and PAGFP, which emit green fluorescence, showed the greatest increase with 54 %, while PAtagRFP, emitting red fluorescence, displayed only 26 % increase. As summarized in Fig. 1b, where the PA-FPs were arranged according to their post-activation emission wavelength, we observed a general trend where more blue-shifted PA-FP's emission have a larger increase in photon numbers. In another words, the D2O had a more pronounced effect on PA-FPs emitting in the blue-green region such as PSCFP2 and PAGFP than those emitting in the red region nearer to the infrared such as PAmCherry and PAtagRFP. The green-to-red photoconvertable FPs, namely mEos2, mEos3.2 and mMaple3, all showed a reasonably large increase of photons emitted, about 45 %, in 100% D2O-based PBS.
Figure 1.
Properties of FA-FPs in varying fraction of D2O, measured in live CHO cells. (a) An example showing the detected photon numbers per photoactivation event for PSCFP2 in PBS containing different fractions of D2O (n = 10). The percent photon number increase over H2O-based PBS is marked in blue color. (b) Summary of detected photon numbers for the 8 PAFPs tested in this study in either pure H2O- or D2O-based PBS. The blue percentage numbers indicate the photon number increase in D2O-based PBS as compared to H2O-based PBS. The PA-FPs are arranged according to their post-activation emission wavelength. Error bars denote standard deviation.
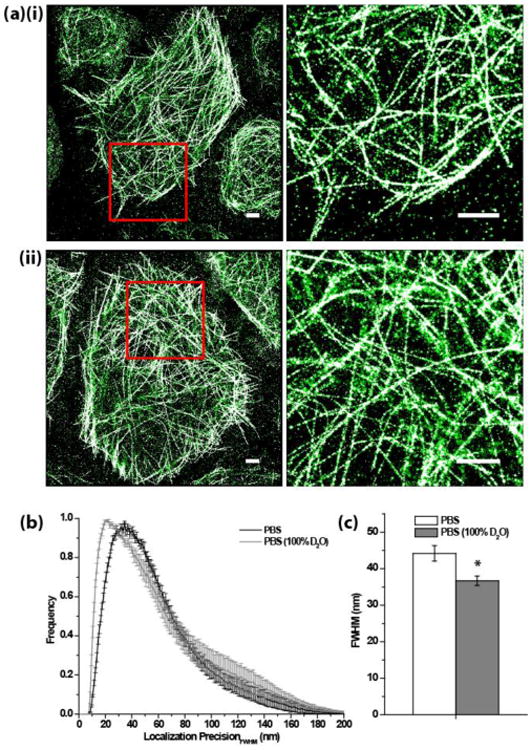
We next demonstrated the improvement in single-molecule localization precision in real cellular structure imaging using D2O-PBS. Specifically, we compared the STORM images of microtubules in fixed S2 cells by imaging mEos2-α-tubulin in either PBS or 100% D2O-based PBS (Fig. 2a). For an approximately 24 × 24 μm area in each image, we characterized the localization precision (FWHM) in either using two metrics: the precision for individual molecules calculated from the photon number and background level,16 or the mean precision in the entire area measured by correlation analysis (Fig. 2b-c). Consistent with a 31 % increase in detected photon number per mEos2 in the D2O case, the localization precision improved significantly (P < 0.01), proving the practical advantage of this method.
Figure 2.

(a) STORM images of mEos2-α-tubulin in fixed S2 cell in (i) PBS and (ii) D2O-based PBS. The image on the right is the expanded view of the region drawn with a red box on the left image. Scale bars: 2 μm. (b) The histogram of calculated localization precision16 (FWHM) for each localized mEos2. (c) The measured mean localization precision (FWHM) in an approximately 24 × 24 μm image area. Student's t-test P < 0.01. Error bars in (b) denote s.e.m. whereas those in (c) denotes standard deviation. n = 4.
The higher photon number in D2O could be attributed to either an increased brightness (extinction coefficient and quantum yield combined) or a reduction in photobleaching rate. To distinguish these two cases, we measured the fluorescence intensity of conventional GFP and mCherry17 as well as the pre-activation green state of mEos2 under low excitation intensity on a conventional wide-field fluorescence microscope. In each case, 100 S2 cells transiently expressing FP-α-tubulin were imaged live in PBS and 100% D2O-based PBS (∼0.8 W/cm2 of light around 485 nm was used for GFP and pre-activated mEos2, while ∼0.7 W/cm2 of light around 560 nm was used for mCherry). The mean fluorescence intensity were only up to about 10 % brighter in D2O (S.I. Fig. S2), indicating that the deuterium had negligible effect on the brightness of FPs. On the other hand, although we did not observe a significant change in photobleaching rate for GFP, we did record a 56 % slower photobleaching rate for post-activated mEos2 (S.I. Fig. S3), consistent with the photon number increase which we have measured in STORM experiments. These results suggest that D2O can participate in the photobleaching reaction of post-activated mEos2, slowing it down, potentially due to the isotope effect.
In summary, we have introduced a simple method for increasing the photon numbers of photoactivatable fluorescent protein in super-resolution microscopy. The method is simple, cheap and is compatible with both live and fixed imaging, allowing for images with higher resolution to be taken. Additionally, this study may provide insights for the better understanding of FP photobleaching mechanisms and for the engineering of better PA-FPs.
Supplementary Material
Acknowledgments
† We thank Steven Boxer and Xiaokun Shu for insightful discussions. The plasmid for PAtagRFP was generously provided by Vladislav Verkhusha and mEos3.2 by Pingyong Xu. This work is supported by NIH Director's New Innovator Award (DP2OD008479) and the NIH Extracellular RNA Communication Consortium (U19CA179512). Y.R.C. acknowledges support by the NSF Graduate Research Fellowship. J. S. thankfully acknowledges support from a Boehringer Ingelheim Fonds Ph.D. fellowship.
Footnotes
Electronic Supplementary Information (ESI) available: Experimental details and supplementary figures. See DOI: 10.1039/c000000x/
References
- 1.(a) Betzig E, Patterson GH, Sougrat R, Lindwasser OW, Olenych S, Bonifacino JS, Davidson MW, Lippincott-Schwartz J, Hess HF. Science. 2006;313:1642. doi: 10.1126/science.1127344. [DOI] [PubMed] [Google Scholar]; (b) Hess ST, Girirajan TPK, Mason MD. Biophys J. 2006;91:4258. doi: 10.1529/biophysj.106.091116. [DOI] [PMC free article] [PubMed] [Google Scholar]
- 2.(a) Rust MJ, Bates M, Zhuang X. Nat Methods. 2006;3:793. doi: 10.1038/nmeth929. [DOI] [PMC free article] [PubMed] [Google Scholar]; (b) Bates M, Huang B, Dempsey GT, Zhuang X. Science. 2007;317:1749. doi: 10.1126/science.1146598. [DOI] [PMC free article] [PubMed] [Google Scholar]
- 3.van de Linde S, Loschberger A, Klein T, Heidbreder M, Wolter S, Heilemann M, Sauer M. Nat Protocols. 2011;6:991. doi: 10.1038/nprot.2011.336. [DOI] [PubMed] [Google Scholar]
- 4.Fernandez-Suarez M, Ting AY. Nat Rev Mol Cell Biol. 2008;9:929. doi: 10.1038/nrm2531. [DOI] [PubMed] [Google Scholar]
- 5.(a) Lee SF, Vérolet Q, Fürstenberg A. Angew Chem Int Ed. 2013;52:8948. doi: 10.1002/anie.201302341. [DOI] [PubMed] [Google Scholar]; (b) Klehs K, Spahn C, Endesfelder U, Lee SF, Fürstenberg A, Heilemann M. ChemPhysChem. 2014;15:637. doi: 10.1002/cphc.201300874. [DOI] [PubMed] [Google Scholar]
- 6.(a) Loh SN, Markley JL. Biochemistry. 1994;33:1029. doi: 10.1021/bi00170a023. [DOI] [PubMed] [Google Scholar]; (b) Makhatadze GI, Clore GM, Gronenborn AM. Nat Struct Mol Biol. 1995;2:852. doi: 10.1038/nsb1095-852. [DOI] [PubMed] [Google Scholar]; (c) Dong A, Kendrick B, Kreilgård L, Matsuura J, Manning MC, Carpenter JF. Arch Biochem Biophys. 1997;347:213. doi: 10.1006/abbi.1997.0349. [DOI] [PubMed] [Google Scholar]; (d) Madern D, Zaccai G. Eur J Biochem. 1997;249:607. doi: 10.1111/j.1432-1033.1997.00607.x. [DOI] [PubMed] [Google Scholar]; (e) Kuhlman B, Raleigh DP. Protein Sci. 1998;7:2405. doi: 10.1002/pro.5560071118. [DOI] [PMC free article] [PubMed] [Google Scholar]; (f) Henderson RF, Henderson TR, Woodfin BM. J Biol Chem. 1970;245:3733. [PubMed] [Google Scholar]; (g) Antonino LC, Kautz RA, Nakano T, Fox RO, Fink AL. Proc Natl Acad Sci U S A. 1991;88:7715. doi: 10.1073/pnas.88.17.7715. [DOI] [PMC free article] [PubMed] [Google Scholar]; (h) Parker MJ, Clarke AR. Biochemistry. 1997;36:5786. doi: 10.1021/bi9629283. [DOI] [PubMed] [Google Scholar]; (i) Hirakura Y, Sugiyama T, Takeda M, Ikeda M, Yoshioka T. Biochim Biophys Acta. 2011;1810:218. doi: 10.1016/j.bbagen.2010.10.005. [DOI] [PubMed] [Google Scholar]
- 7.(a) Takeshi Uemura, Kouzo Moritake, Yasuhiko Akiyama, Yoriyoshi Kimura, Takashi Shingu, Toshiki Yamasaki. J Neurosurg. 2002;96:900. [Google Scholar]; (b) Hartmann J, Bader Y, Horvath Z, Saiko P, Grusch M, Illmer C, Madlener S, Fritzer-Szekeres M, Heller N, Alken RG, Szekeres T. Anticancer Res. 2005;25:3407. [PubMed] [Google Scholar]; (c) Bader Y, Hartmann J, Horvath Z, Saiko P, Grusch M, Madlener S, Maier S, Oehler L, Fritzer-Szekeres M, Heller N, Alken RG, Krupitza G, Szekeres T. Cancer Lett. 2008;259:231. doi: 10.1016/j.canlet.2007.10.010. [DOI] [PubMed] [Google Scholar]; (d) Kalkur RS, Ballast AC, Triplett AR, Spendier K. Peer J. 2014;2:e553. doi: 10.7717/peerj.553. [DOI] [PMC free article] [PubMed] [Google Scholar]
- 8.Chudakov DM, Verkhusha VV, Staroverov DB, Souslova EA, Lukyanov S, Lukyanov KA. Nat Biotechnol. 2004;22:1435. doi: 10.1038/nbt1025. [DOI] [PubMed] [Google Scholar]
- 9.Patterson GH, Lippincott-Schwartz J. Science. 2002;297:1873. doi: 10.1126/science.1074952. [DOI] [PubMed] [Google Scholar]
- 10.Gurskaya NG, Verkhusha VV, Shcheglov AS, Staroverov DB, Chepurnykh TV, Fradkov AF, Lukyanov S, Lukyanov KA. Nat Biotechnol. 2006;24:461. doi: 10.1038/nbt1191. [DOI] [PubMed] [Google Scholar]
- 11.McKinney SA, Murphy CS, Hazelwood KL, Davidson MW, Looger LL. Nat Methods. 2009;6:131. doi: 10.1038/nmeth.1296. [DOI] [PMC free article] [PubMed] [Google Scholar]
- 12.Zhang M, Chang H, Zhang Y, Yu J, Wu L, Ji W, Chen J, Liu B, Lu J, Liu Y, Zhang J, Xu P, Xu T. Nat Methods. 2012;9:727. doi: 10.1038/nmeth.2021. [DOI] [PubMed] [Google Scholar]
- 13.Subach FV, Patterson GH, Manley S, Gillette JM, Lippincott-Schwartz J, Verkhusha VV. Nat Methods. 2009;6:153. doi: 10.1038/nmeth.1298. [DOI] [PMC free article] [PubMed] [Google Scholar]
- 14.Subach FV, Patterson GH, Renz M, Lippincott-Schwartz J, Verkhusha VV. J Am Chem Soc. 2010;132:6481. doi: 10.1021/ja100906g. [DOI] [PMC free article] [PubMed] [Google Scholar]
- 15.Wang S, Moffitt JR, Dempsey GT, Xie XS, Zhuang X. Proc Natl Acad Sci U S A. 2014;111:8452. doi: 10.1073/pnas.1406593111. [DOI] [PMC free article] [PubMed] [Google Scholar]
- 16.Mortensen KI, Churchman LS, Spudich JA, Flyvbjerg H. Nat Methods. 2010;7:377. doi: 10.1038/nmeth.1447. [DOI] [PMC free article] [PubMed] [Google Scholar]
- 17.Shaner NC, Campbell RE, Steinbach PA, Giepmans BNG, Palmer AE, Tsien RY. Nat Biotechnol. 2004;22:1567. doi: 10.1038/nbt1037. [DOI] [PubMed] [Google Scholar]
Associated Data
This section collects any data citations, data availability statements, or supplementary materials included in this article.


