

Abstract
Even low levels of depressive symptoms are associated with an increased risk of cognitive decline in older adults without overt cognitive impairment (CN). Our objective was to examine whether very low, “subthreshold symptoms of depression” (SSD) are associated with Alzheimer’s disease (AD) biomarkers of neurodegeneration in CN adults and whether these associations are specific to particular depressive symptoms. We analyzed data from 248 community-dwelling CN older adults, including measurements of cortical amyloid burden, neurodegeneration markers of hippocampal volume (HV) and cerebral 18F-fluorodeoxyglucose (FDG) metabolism in a composite of AD-related regions and the 30-item Geriatric Depression Scale (GDS). Participants with GDS>10 were excluded. General linear regression models evaluated the cross-sectional relations of GDS to HV or FDG in separate backward elimination models. Predictors included GDS total score, age, sex, premorbid intelligence, a binary amyloid variable and its interaction with GDS. Principal component analyses of GDS item scores revealed three factors (the Dysphoria, Apathy-Anhedonia and Anxiety-Concentration Factors). In secondary analyses, GDS total score was replaced with the three factor scores in repeated models. Higher GDS score (p=0.03) was significantly associated with lower HV and was marginally related (p=0.06) to FDG hypometabolism. In secondary models, higher Dysphoria (p=0.02) and Apathy-Anhedonia (p=0.05) were related to lower HV while higher Apathy-Anhedonia (p=0.003) was the sole factor related to FDG hypometabolism. Amyloid was not a significant predictor in any model. In conclusion, very low-level dysphoria, apathy and anhedonia may point to neurodegeneration in AD-related regions but this association appears to be independent of amyloid burden.
Keywords: Subthreshold depressive symptoms, normal cognition, Preclinical, Alzheimer’s disease, biomarkers, neurodegeneration
INTRODUCTION
In cognitively normal (CN) older adults, affective symptoms such as depression and apathy predict increased progression to amnestic mild cognitive impairment (MCI) suggesting that these neuropsychiatric symptoms may be very early clinical markers of Alzheimer’s disease (AD) or indicators of other etiopathological processes impacting the AD pathway at the preclinical stage.[1–3] While chronic late life major depression (LLD) confers the greatest risk of transition to MCI[3], other forms of depression, such as intermittent and remitted major depression[3], or low-grade depressive symptoms measured by depression screening instruments[4] or as a neuropsychiatric symptom item[1, 3] are also associated with increased risk of cognitive decline in older individuals without objective cognitive impairment. Here, the term “subthreshold symptoms of depression” (SSD) is used to encompass lower severity depressive classifications that do not meet diagnostic criteria for major depression, such as subsyndromal depression and minor depression, as well as depressive symptoms within a low or subclinical range on depression scales.[5–9]
SSD are common in advancing age and in heterogeneous groups of older adults. Groups of older adults with SSD include those evolving into or remitting from major depression, [10, 11] those with a chronic course of SSD that may be accompanied by functional limitations and low perceived social support, [11–13] and others who may experience SSD in the context of natural conditions and psychological and physiological processes in very late life.[13] Thus, the fate of older individuals with SSD may be varied and disease processes underlying the association of SSD and cognitive decline are not well understood.
Cortisol-mediated neurotoxicity within the hippocampus[14–17] and microvascular white matter disease contributing to dysfunction in affective and cognitive control networks[18, 19] are two non-AD specific disease mechanisms that have been proposed to underlie the association of LLD and longitudinal cognitive decline that may also be relevant to SSD. It has also been proposed that affective changes, such as depression, may be very early symptoms in the AD pathway, prior to the stage of MCI, that arise from alterations in brain structure and function in regions vulnerable to AD.[1, 20–22] Prior studies have found (syndromal) LLD in CN elderly cohorts to be associated with certain AD biomarkers such as reduced cerebrospinal fluid amyloid-beta 42, [23] entorhinal cortical thinning[24], and hippocampal atrophy, including sub-regions of the hippocampus associated with AD-related disease progression. [25, 26] Conversely, two clinical-pathological studies found that the association of SSD[21] or full-spectrum depressive symptoms[27] to cognitive decline across CN, MCI and dementia stages was unrelated to amyloid plaque burden or neurofibrillary tangle density, hallmark pathologies of AD, suggesting that other depression-related pathophysiological processes, as yet uncharacterized, may influence clinical trajectories. Thus far, the relations of SSD to in vivo, AD-related biomarkers have been largely unstudied in CN elderly, defined as older adults who are without objective cognitive impairment on neuropsychological testing and do not meet criteria for MCI.
The objective of this study was to examine the cross-sectional relations of SSD to hippocampal volume (HV) [26] and resting glucose metabolism in a composite of AD-related regions, [28] that are currently utilized as research markers of neurodegeneration in the AD pathway, including the preclinical stage.[29, 30] We hypothesized that greater SSD, even within a range below the cut-off for clinical depression, would be associated with these neurodegeneration biomarkers, reduced HV and hypometabolism, as dependent variables, in separate analyses adjusting for age, sex, premorbid intelligence, antidepressant medication use, prior depression history and fibrillar cortical amyloid burden. We also examined the interaction of SSD with amyloid burden in order to assess amyloid pathology as a possible etiological mechanism linking SSD and neurodegeneration in CN elderly. Our hypothesis was based on a model of SSD as potential behavioral markers of neuronal injury corresponding to preclinical AD stage 2 and 3.[30]
MATERIALS AND METHODS
Participants
The sample was comprised of 248 older adult participants in the Harvard Aging Brain Study (HABS), an ongoing prospective cohort study of cognitive aging. Participants were English-speaking, community-dwelling men and women who met the following inclusion criteria: age 65–90, clinically normal cognition based on Clinical Dementia Rating[31] global score 0, education adjusted Mini-Mental State Examination[32] (MMSE) of 27–30, and performance on the Logical Memory Story Delayed Recall[33] within 1.5 standard deviation adjusted for education. Individuals with serious mental illness, such as schizophrenia, schizoaffective disorder or bipolar disorder, moderate or severe major depression or substance abuse within the past two years, determined by psychiatric history, were excluded from the cohort. A self-reported history of depression adequately treated with serotonin or dual serotonin-norepinephrine reuptake inhibitors, bupropion or nortryptyline was allowed. Participants with scores of 11 or greater on the 30-item Geriatric Depression Scale (GDS)[34] were also excluded from the cohort. (See Supplement for further exclusion criteria).
All participants provided informed consent prior to undergoing any study procedures. The HABS protocol was approved by the Partners Human Research Committee and was conducted in accordance with the ethical standards of the Helsinki Declaration of 1975.
Clinical measures
In addition to the cognitive tests utilized for screening, baseline clinical assessments relevant to these analyses included the American National Reading Test[35] (AMNART) intelligence quotient (IQ), a measure of premorbid intelligence (greater score indicates greater intelligence) and the GDS. We measured depression on a continuous scale (0–10) that corresponds to the subclinical range of the 30-item GDS (greater score indicates greater severity).[34] Therefore, subthreshold depression was defined as any non-zero score below the cutoff for mild depression. Self-reported history of prior depression, current depression diagnosis and current use of antidepressant medication were also elicited at baseline via history obtained by an experienced clinician, followed by medical record review if necessary. Imaging assessments were performed within a mean of 137 ± 81 days of clinical assessments.
PiB-PET data
Fibrillar cortical amyloid burden was measured using Pittsburgh Compound B (PiB)- positron emission tomography (PET) imaging conducted at the Massachusetts General Hospital (MGH) PET facility. C11-PiB synthesis and imaging, using a Siemens ECAT EXACT HR+ PET scanner, were performed as previously reported.[36–39] PiB distribution volume ratio (DVR) was calculated for an aggregate of cortical regions that typically have elevated PiB retention in AD dementia, including frontal, lateral temporal, and lateral and medial parietal regions. Amyloid classification was determined using the aggregate PiB DVR value as previously described.[40] Using a Gaussian mixture modeling approach amyloid-positive or amyloid-negative status was based on a cut off value of 1.20 that was determined using a portion of participants included in the current analysis (N=161).
FDG PET data
18F-fluorodeoxyglucose (FDG) PET imaging was completed at the MGH PET facility as previously described.[40] FDG was extracted from a MetaROI reflecting regions known to be vulnerable in AD (lateral parietal, lateral inferior temporal and posterior cingulate cortex), [28] and used as a marker of neurodegeneration. We used the identical pons/vermis reference region previously used by Landau et al., and normalized average MetaROI values by the mean from the top 50% of voxels from this reference region.[28]
MRI data
Magnetic resonance imaging (MRI) scanning was completed at the MGH Martinos Center as previously described.[36, 38] Region of interest (ROI) labeling was implemented using FreeSurfer v5.1 (http://surfer.nmr.mgh.harvard.edu/). HV was collapsed across hemispheres and used as a marker of neurodegeneration. Bilateral HV was adjusted for intracranial volume (ICV) by performing a linear regression with HV as the dependent variable and ICV as the independent variable. The residual value from this model for each participant was used as the adjusted bilateral HV.
Statistical Analyses
SAS Version 9.3 (SAS, Cary, NC) and SPSS Version 21 (IBM, Armonk, NY) statistical software were used. For our primary analyses, we employed multiple linear regression with backward elimination (GLMSelect procedure), using a p<0.1 threshold, to examine the cross-sectional relations of GDS score to each AD biomarker (HV and FDG) in separate models. For each model, the original pool of predictors included GDS total score, age, sex, AMNART IQ, prior history of depression, use of antidepressant medications, amyloid status (as a binary variable) and the interaction of GDS with amyloid status. For all models, partial regression coefficient estimates (β) with confidence intervals (CI), significance test results (p values), and percent variance accounted for by the model as a whole (R2) were reported. Residuals from the final models were examined to ensure that their distributions reasonably satisfied model assumptions of normality and homoscedasticity.
For our secondary analyses, we performed a principal component analysis (PCA) using baseline GDS items as a data reduction method and to consider whether GDS subdomains, as factors, would be differentially related to AD biomarkers. Three factors were found: the Anxiety-Concentration Factor, the Dysphoria Factor, and the Apathy-Anhedonia Factor that, together, explained 28.2% of the variance (see Figure 1; see Supplement Online for further Methods). To evaluate the relations of GDS factors to AD neurodegeneration biomarkers, we repeated the primary models for dependent variables HV and FDG but replaced the GDS total score with the three factor scores as separate predictors, along with the original pool of predictors, in separate backward elimination regression models for each biomarker.
Figure 1. GDS Factors and their Endorsement: the Apathy-Anhedonia Factor, Dysphoria Factor and Anxiety-Concentration Factor.

Numbers of individuals endorsing GDS items corresponding to the Apathy-Anhedonia Factor (unfilled bars), Dysphoria Factor (solid bars) and Anxiety-Concentration Factor (grey bars) are shown. Four of the 30 GDS items were not included in the factor analysis due to low endorsement (n=0–1) by the sample. In addition, the GDS items pertaining to social avoidance (n=16), boredom (n=19), decision-making (n=30) and to subjective memory symptoms (n=23) did not load onto any of the 3 factors and were not included in analyses. Abbreviation: GDS (Geriatric Depression Scale- 30 item version)
RESULTS
As shown in Table 1, there was a low prevalence of past depression (6.1%), current depression (6.5%) and a low mean GDS score (2.8) that ranged from 0–10, consistent with study inclusion and exclusion criteria. Two-hundred and three participants (82%) endorsed at least one GDS item and 149 (60%) endorsed two or more items. Antidepressant use among the participants was 7.6% (16 participants reported use of selective serotonin-reuptake inhibitors (Citalopram, Sertraline or Fluoxetine) while one each reported use of Nortryptiline, Bupropion and Duloxetine). Out of the total sample, 27% were classified as having high amyloid burden. Greater factor score for Apathy-Anhedonia, but not other factors, nor GDS total score, was associated with high amyloid burden (Mann-Whitney test, p=0.048). Greater factor scores for Apathy-Anhedonia (p=0.03) and Anxiety-Concentration disturbance (Mann-Whitney test, p=0.001) were associated with current antidepressant medication use. There were no significant unadjusted bivariate associations between high amyloid, past depression or current antidepressant use. Neither age nor sex was significantly related to GDS total score or GDS factor scores in unadjusted analyses (Spearman correlations and Mann-Whitney tests, respectively).
Table 1.
Baseline Demographic and Clinical Data
| N | Value | Range | SD | |
|---|---|---|---|---|
| Age (years) | 248 | 74.0 | 65, 90 | 6.1 |
| Sex (% male) | 248 | 40 | ||
| AMNART IQ | 247 | 120.1 | 78, 132 | 10.0 |
| MMSE | 248 | 28.9 | 25, 30 | 1.1 |
| Past Depression N, (%) | 248 | 15 (6.1) | ||
| Current Depression N, (%) | 248 | 16 (6.5) | ||
| Antidepressant medication use N, (%) | 248 | 19 (7.6) | ||
| GDS | 248 | 2.8 | 0,10 | 2.6 |
| High amyloid status N, (%)(Cortical PiB DVR>1.2) | 220 | 60 (27.3) | ||
| Adjusted Hippocampal Volume | 248 | 0 | −3413.2, 2372.7 | 918.6 |
| FDG metabolism | 233 | 1.3087 | 1.0637, 1.5954 | 0.1192 |
Abbreviations: MMSE (Mini-Mental State Examination), AMNART IQ (American National Reading Test score). GDS (Geriatric Depression Scale-30 item) FDG (18F-fluorodeoxyglucose) All values represent the mean except as otherwise noted.
Primary Analyses
In the first model, lower bilateral adjusted HV was significantly associated with higher GDS total score, older age, and lower AMNART IQ with the model, as a whole, being significant (see Table 2 and Figure 2). In an analogous model for dependent variable FDG metabolism, significant predictors included older age and lower AMNART, while greater GDS total score and amyloid-positive status were marginal predictors of hypometabolism, and the overall model was significant (see Table 2). The interaction of amyloid status with GDS was not retained in either model. When amyloid was used as a continuous variable rather than binary, similar results were obtained. Each model was also repeated removing any participants with a past history of depression, and there were no significant changes in these post-hoc models except that GDS total score became a non-significant (p=0.12) rather than marginal (p=0.06) predictor of FDG hypometabolism.
Table 2.
Subthreshold depressive symptoms in relation to Hippocampal Volume and FDG metabolism in CN older adults.
| Model 1: Hippocampal Volume F= 19.8, df=210, p<0.0001; R2=0.22 | |||||
|---|---|---|---|---|---|
| Predictor | Estimate (β) | 95% Confidence Interval for (β) | Standardized β | Standard Error | p value |
| GDS total score | −49.0 | −93.3, −4.5 | −0.133 | 22.5 | 0.03 |
| Age | −69.6 | −99.6, −50.7 | −0.441 | 9.6 | <0.0001 |
| AMNART IQ | 12.4 | 0.7, 24.1 | 0.128 | 5.9 | 0.04 |
| Model 2: FDG Metabolism F= 6.5, df=204, p<0.0001; R2=0.11 | |||||
| GDS total score | −0.006 | −0.012, 0.003 | −0.123 | 0.003 | 0.06 |
| High Amyloid | −0.03 | −0.07, 0.004 | −0.118 | 0.02 | 0.08 |
| Low Amyloid | 0 | ||||
| Age | −0.005 | −0.008, −0.002 | −0.245 | 0.001 | 0.0004 |
| AMNART IQ | 0.002 | 0.0002, 0.003 | 0.147 | 0.0008 | 0.03 |
Predictors retained in cross-sectional, general linear regression models with backward elimination (p<0.1 cut-off) for the dependent variables Hippocampal Volume and FDG metabolism are shown.
Abbreviations: CN (clinically normal) GDS (Geriatric Depression Scale- 30 item) AMNART IQ (American National Reading Test score intelligence quotient) FDG (18F-fluorodeoxyglucose)
Figure 2. The relation of GDS to Hippocampal Volume (A) and FDG Metabolism (B).
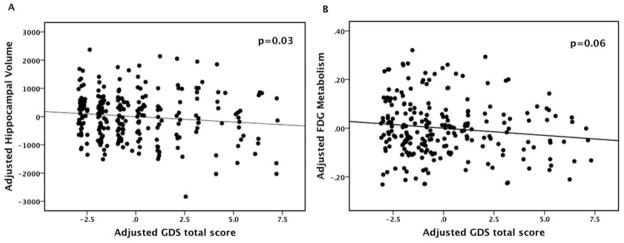
Multiple regression models with backward elimination were employed. In each model the pool of predictors included GDS, age, sex, premorbid intelligence, prior depression, antidepressant medication use, amyloid status and the interaction of GDS with amyloid. Hippocampal volume was adjusted for intracranial volume. Abbreviation: GDS (Geriatric Depression Scale-30 item) FDG (18F-fluorodeoxyglucose)
Secondary Analyses
We found that greater factor scores for Dysphoria and Apathy-Anhedonia, but not Anxiety-Concentration, were significantly associated with lower HV along with greater age and lower AMNART IQ (see Table 3 and Supplement Figure 1A and B). We also found that greater Apathy-Anhedonia Factor score was significantly related to greater hypometabolism, with greater age and lower AMNART IQ as other significant predictors (see Table 3 and Supplement Figure 1C). Neither amyloid status nor the interaction of amyloid with any of the GDS factors was retained in the secondary models. Post-hoc models that excluded participants with a history of past depression did not significantly alter these results.
Table 3.
Cross-sectional models of GDS Factors in relation to Hippocampal Volume and FDG metabolism in CN older adults.
| Model 1: Hippocampal Volume F=15.0, df=194, p<0.0001; R2=0.24 | ||||
|---|---|---|---|---|
| Predictor | Estimate (β) | 95% Confidence Interval for β | Standard Error | p value |
| Dysphoria Factor | −158.2 | −287.2, −29.2 | 65.4 | 0.02 |
| Apathy-Anhedonia Factor | −117.1 | −236.0, 1.7 | 60.3 | 0.05 |
| Age | −68.3 | −87.9, −48.8 | 9.9 | <0.0001 |
| AMNART IQ | 12.6 | 0.6, 24.7 | 6.1 | 0.06 |
| Model 2: FDG Metabolism F=9.6, df= 190, p<0.0001; R2= 0.13 | ||||
| Apathy-Anhedonia Factor | −0.026 | −0.042, −0.009 | 0.009 | 0.003 |
| Age | −0.005 | −0.008, −0.003 | 0.001 | 0.0002 |
| AMNART IQ | 12.8 | 0.8, 24.7 | 0.0009 | 0.014 |
In secondary analyses, GDS total score was replaced by the 3 GDS factors in the original pool of predictors subject to backward elimination (p<0.1 cut-off) for dependent variables Hippocampal Volume and FDG metabolism. Predictors retained in final models are shown. The Anxiety-Concentration Factor was not retained in either model.
Abbreviations: AMNART IQ (American National Reading Test score) CN (clinically normal) GDS (Geriatric Depression Scale) FDG (18F-fluorodeoxyglucose)
DISCUSSION
We examined baseline data derived from a newly established cohort of CN older adults in order to study the cross-sectional association of SSD with AD neurodegeneration biomarkers expected to be detectable in a subset of this cohort as potential preclinical markers. We found that SSD were significantly associated with lower HV in analyses adjusted for multiple possible confounders. More specifically, SSD corresponding to dysphoric mood, apathy and anhedonia (but not to symptoms of anxiety and concentration disturbance) were significantly related to low HV. The associations of SSD to HV were not modified by the presence or absence of elevated fibrillar cortical amyloid
We also found that SSD measured by the GDS total score was a marginal predictor of hypometabolism in a composite of AD-related, posterior cortical regions. On closer examination, SSD related to apathy and anhedonia were significantly related to hypometabolism, but other sub-domains of depressive symptoms were not. These associations were also not modified by amyloid burden.
GDS items concerning memory and cognitive symptoms were not part of the two factors found to be related to markers of HV and posterior cortical neurodegeneration. Thus, in older adults without cognitive impairment we demonstrate a substantial cross-sectional link between subthreshold mood and behavioral symptoms of depression and neurodegeneration in regions of interest in AD. These findings are complementary with strong epidemiological evidence that affective neuropsychiatric symptoms, such as depression, agitation, irritability, apathy and anxiety, are significant predictors of progression from preclinical to early clinical stages of AD.[1, 2]
Prior research has demonstrated associations of both higher[41] and lower [23] concentrations of soluble amyloid-beta 42 in cerebrospinal fluid of non-demented and CN individuals with LLD compared to non-depressed controls. A small number of studies have evaluated LLD in conjunction with cerebral amyloidosis using PiB-PET in CN and non-demented older adults, and have generally not found evidence for an association of high amyloid and remitted depression.[42–44] Our findings do not support fibrillar cortical amyloid pathology as a primary factor linking neurodegeneration and depressive-spectrum symptoms in CN elderly. Nonetheless, depression-related neurodegeneration may play a role in preclinical and early AD progression. Depression-spectrum symptoms, particularly apathy and anhedonia, may signal neuronal injury by other mechanisms and thus, increased vulnerability to AD pathophysiology and clinical decline. As such, depression-related pathophysiology is one possible etiological mechanism for the newly reported “neurodegeneration-first” AD pathway in which some CN elderly, initially demonstrate low HV and/or an AD pattern of hypometabolism in the absence of high amyloid burden at the preclinical stage.[45, 46]
Our primary finding, that SSD were associated with reduced HV, may be partly explained by the known association of low HV with major depression that persists in the remitted state.[24, 47, 48] However, neither prior depression nor antidepressant medication use was a significant predictor of HV in our analysis and post-hoc analyses excluding participants with past depression did not substantially alter our results. Therefore, it is unlikely that past depression alone accounts for the association of SSD with reduced HV. Rather, the relation of SSD to low HV in our sample may be mediated by multiple factors including past or current glucocorticoid neurotoxicity, underlying preclinical AD tau or soluble amyloid pathology, microvascular disease or other age-related processes.
A leading hypothesis holds that depression-related hippocampal atrophy is mediated by glucocorticoid toxicity, a mechanism by which hypercortisolemia induces hippocampal neuronal loss and dysfunction, a loss of feed-forward inhibition of corticotropin-releasing factor and hypothalamic-pituitary-adrenal (HPA) axis abnormalities, and, thereby, further depression and hippocampal damage.[14] More recent studies of older adults, have clarified, however, that hypercortisolemia is initially present in LLD but does not appear to mediate progressive hippocampal atrophy and cognitive decline, particularly in late-onset depression.[24, 49]
Longitudinal MRI studies of CN older adults have documented accelerated HV loss in preclinical stages of AD that occurs initially in subicular and CA1 regions and later in CA2 and CA3 subfields, areas that correspond to the pathological sequence of tau-related neurofibrillary tangle spread and neuronal loss.[26, 50, 51] Current evidence suggests that amyloid accumulation, when present, accelerates tau-related neurodegeneration in the hippocampus. [52] Ballmaier and colleagues found that late onset (but not early onset) depression in CN older adults was associated with bilateral hippocampal atrophy and specific local reductions in the CA1 and subicular regions that were also associated with lower performance on verbal and non-verbal memory tests,.[25] Thus, they characterized these depression-related and region-specific changes in HV and memory performance as suggestive of preclinical AD.[25] Other interacting disease mechanisms, such as microvascular ischemia may also be involved in hippocampal neurodegeneration [25] and a background rate of HV loss related to normal aging has recently been defined in older adults via unknown mechanisms.[53] Thus, hippocampal neurodegeneration in older adults, and within this sample, is likely to be due to combination of age, depression, vascular and, possibly, AD-related mechanisms either unrelated to fibrillar cortical amyloid or at a level below our power to detect in these analyses.
In our second set of models, SSD, particularly those related to apathy and anhedonia, were associated with hypometabolism in bilateral temporal, parietal and posterior cingulate cortices that undergo accelerated atrophy in preclinical and clinical stages of AD.[28, 40, 54] We also found hypometabolism to be related to greater age, compatible with studies that have demonstrated age-related cortical atrophy that includes temporo-parietal structures and is especially prominent in fronto-striatal and anterior cingulate regions, [55] areas that we did not include in our model. Prior studies of CN elderly have found SSD to be related to lower prefrontal gray matter volume and greater white matter lesions[22] and minor depression to be related to decreased anterior cingulate cortical thickness, [56] findings that may indicate vulnerability of cognitive control and affective networks to either age-related or vascular changes. Dotson and colleagues found mean depression score over 9 years (including SSD) to be longitudinally related to reductions in temporal, orbitofrontal and cingulate gray matter and frontal white matter.[57] Thus, combined etiopathologies related to age, AD, vascular and other factors may contribute to SSD within individuals and in a heterogeneous CN sample.
We add to prior work by demonstrating, more specifically, that in CN adults, GDS symptoms of apathy and anhedonia are associated with posterior cortical hypometabolism, on par with age-related effects. This finding complements other studies linking symptoms of apathy and anhedonia to functional decline. In a large national survey of older adults, anhedonia but not dysphoria predicted functional disability and higher mortality over 13 years.[58] In our own prior work, apathy was an independent predictor of functional and global decline across a continuum of older adults ranging from CN to AD dementia.[59] Numerous studies have identified apathy as an early and common behavioral symptom in MCI and AD dementia linked to clinical progression[59, 60] and, recently, to posterior cingulate cortex hypometabolism in amnestic MCI.[61] Our current findings suggest that apathy and anhehonia may also signal early neurodegeneration and, thereby, increased vulnerability to clinical decline, in CN elderly. Apathy-andedonia factor scores in our sample were also significantly associated with high amyloid burden in unadjusted bivariate analyses, implicating AD pathophysiology, and in line with evidence of an association of greater apathy with high amyloid at the stage of MCI.[62] Longitudinal analyses are necessary to test whether SSD corresponding to the Apathy-Anhedonia factor, identified here, are associated with cognitive and functional decline and progressive neurodegeneration and, thus, whether these symptoms may be useful clinical markers for preclinical AD risk assessment in CN older adults.
A large number of studies have explored the factor structure underlying the GDS, in diverse cultural and language groups, revealing significant structural variation across populations (as reviewed by Kim and colleagues).[63] Here we used PCA as a data reduction method and heuristic to explore clusters of SSD in relation to neurodegeneration markers. Our PCA results are comparable to those of Adams and colleagues who examined GDS data derived from a similar sized sample of independent and assisted-living residents with a mean GDS score of 7.5, 26% scoring at or above the depression cutoff of 10, which was used as an exclusion criterion in our cohort.[64] Their confirmatory PCA resulted in a five-factor structure closely resembling our own. The Dysphoria and Apathy-Anhedonia factors we found are equivalent to two factors in their final confirmatory model (defined as “Dysphoric Mood” and “Withdrawal-Apathy-Vigor” subscales), while our Anxiety-Concentration disturbance factor is analogous to a combination of two other factors they defined as “Worry” and “Cognitive Impairment” subscales. The fifth, “Hopelessness” subscale in the Adams model consisted of less frequently endorsed, higher acuity GDS items that were rarely endorsed by our sample, and therefore were not included in our PCA. Thus our PCA results were consistent with those of another well-characterized cohort of community-dwelling older adults.
There are a number of limitations to our study. Psychiatric history was obtained by self-report and not by standardized psychiatric assessments; therefore, prior depression history may have been underreported. The Harvard Aging Brain Study cohort excluded individuals with a history of more severe forms of depression and also excluded those with current GDS scores above the mild depression cutoff. As a consequence, the GDS distribution within our sample was right skewed with low variability, reducing our power to detect associations and effect modification with AD biomarkers that also have a more restricted variance within a CN sample. These analyses assumed that GDS measures were stable in the interval of time between clinical assessment and imaging studies. Transient, isolated or low-grade GDS symptoms, endorsed in the context of daily life stressors may not be pathological nor be associated with neurodegeneration. Considering the low burden of depressive symptoms in the sample, this may have led to Type II errors, particularly in secondary analyses. Since we measured fibrillar cortical amyloid, our findings do not address possible mechanistically relevant associations of soluble amyloid with depressive spectrum symptoms.[65] Additionally, as a relatively small number of participants were on antidepressant medications we were underpowered to assess for a potential mediating effect on the association between SSD and AD biomarkers.[65] While restricting the depression history and range of GDS scores may have limited both the power and external validity of our findings, it allowed us to focus specifically on the neural correlates of low-grade depressive symptoms, a pattern of depression that is particularly common and clinically relevant in late life. Thus, we plan to undertake future longitudinal analyses of this aging cohort that are expected to have greater statistical power to examine the physiology of depressive symptoms within the natural history of aging and AD. Further exploration of these depression sub-domains may reveal links with psychosocial influences, pathological processes and brain network dysfunction that underlie the known association of advancing age and increased depression in late-life.
In conclusion, we found that, in CN elderly, SSD relating to dysphoric mood, apathy and anhedonia were associated with neurodegenerative markers in the hippocampus and in posterior cingulate, temporal and parietal cortical regions. Subtle mood and behavioral symptoms in older adults warrant careful assessment to identify and reduce remediable sources of distress and to attend to long-term cognitive health.
Supplementary Material
Acknowledgments
ACKNOWLEDGMENTS INCLUDING SOURCES OF FUNDING
This study was supported by R03 AG045080, R01 AG027435, K23 AG033634, K24 AG035007, the Harvard Medical School Department of Psychiatry Dupont-Warren Fellowship and Livingston Award, the Massachusetts Alzheimer’s Disease Research Center (P50 AG005134) and the Harvard Aging Brain Study (P01 AGO36694, R01 AG037497).
Footnotes
CONFLICTS OF INTEREST
The authors have received research salary support from Janssen Alzheimer Immunotherapy (Drs. Marshall and Amariglio), Wyeth/Pfizer Pharmaceuticals (Drs. Marshall and Amariglio), Eisai Inc. (Dr. Marshall), Eli Lilly and Company (Dr. Marshall), Avid radiopharmaceuticals (Dr. Johnson) and Bristol-Myers-Squibb (Dr. Sperling). Dr. Marshall has also received consulting fees from Halloran and GliaCure Inc.
References
- 1.Donovan NJ, Amariglio RE, Zoller AS, Rudel RK, Gomez-Isla T, Blacker D, Hyman BT, Locascio JJ, Johnson KA, Sperling RA, Marshall GA, Rentz DM. Subjective Cognitive Concerns and Neuropsychiatric Predictors of Progression to the Early Clinical Stages of Alzheimer Disease. Am J Geriatr Psychiatry. 2014;22:1642–1651. doi: 10.1016/j.jagp.2014.02.007. [DOI] [PMC free article] [PubMed] [Google Scholar]
- 2.Geda YE, Roberts RO, Mielke MM, Knopman DS, Christianson TJ, Pankratz VS, Boeve BF, Sochor O, Tangalos EG, Petersen RC, Rocca WA. Baseline neuropsychiatric symptoms and the risk of incident mild cognitive impairment: a population-based study. Am J Psychiatry. 2014;171:572–581. doi: 10.1176/appi.ajp.2014.13060821. [DOI] [PMC free article] [PubMed] [Google Scholar]
- 3.Steenland K, Karnes C, Seals R, Carnevale C, Hermida A, Levey A. Late-life depression as a risk factor for mild cognitive impairment or Alzheimer’s disease in 30 US Alzheimer’s disease centers. J Alzheimers Dis. 2012;31:265–275. doi: 10.3233/JAD-2012-111922. [DOI] [PMC free article] [PubMed] [Google Scholar]
- 4.Barnes DE, Alexopoulos GS, Lopez OL, Williamson JD, Yaffe K. Depressive symptoms, vascular disease, and mild cognitive impairment: findings from the Cardiovascular Health Study. Archives of general psychiatry. 2006;63:273–279. doi: 10.1001/archpsyc.63.3.273. [DOI] [PubMed] [Google Scholar]
- 5.Judd LL, Akiskal HS, Paulus MP. The role and clinical significance of subsyndromal depressive symptoms (SSD) in unipolar major depressive disorder. J Affect Disord. 1997;45:5–17. doi: 10.1016/s0165-0327(97)00055-4. discussion 17–18. [DOI] [PubMed] [Google Scholar]
- 6.Lyness JM, Kim J, Tang W, Tu X, Conwell Y, King DA, Caine ED. The clinical significance of subsyndromal depression in older primary care patients. The American journal of geriatric psychiatry: official journal of the American Association for Geriatric Psychiatry. 2007;15:214–223. doi: 10.1097/01.JGP.0000235763.50230.83. [DOI] [PubMed] [Google Scholar]
- 7.Dotson VM, Beason-Held L, Kraut MA, Resnick SM. Longitudinal study of chronic depressive symptoms and regional cerebral blood flow in older men and women. Int J Geriatr Psychiatry. 2009;24:809–819. doi: 10.1002/gps.2298. [DOI] [PMC free article] [PubMed] [Google Scholar]
- 8.Lavretsky H, Kumar A. Clinically significant non-major depression: old concepts, new insights. Am J Geriatr Psychiatry. 2002;10:239–255. [PubMed] [Google Scholar]
- 9.Lyness JM, Heo M, Datto CJ, Ten Have TR, Katz IR, Drayer R, Reynolds CF, 3rd, Alexopoulos GS, Bruce ML. Outcomes of minor and subsyndromal depression among elderly patients in primary care settings. Ann Intern Med. 2006;144:496–504. doi: 10.7326/0003-4819-144-7-200604040-00008. [DOI] [PubMed] [Google Scholar]
- 10.Lyness JM, Chapman BP, McGriff J, Drayer R, Duberstein PR. One-year outcomes of minor and subsyndromal depression in older primary care patients. Int Psychogeriatr. 2009;21:60–68. doi: 10.1017/S1041610208007746. [DOI] [PMC free article] [PubMed] [Google Scholar]
- 11.Beekman AT, Geerlings SW, Deeg DJ, Smit JH, Schoevers RS, de Beurs E, Braam AW, Penninx BW, van Tilburg W. The natural history of late-life depression: a 6-year prospective study in the community. Arch Gen Psychiatry. 2002;59:605–611. doi: 10.1001/archpsyc.59.7.605. [DOI] [PubMed] [Google Scholar]
- 12.Cui X, Lyness JM, Tang W, Tu X, Conwell Y. Outcomes and predictors of late-life depression trajectories in older primary care patients. Am J Geriatr Psychiatry. 2008;16:406–415. doi: 10.1097/JGP.0b013e3181693264. [DOI] [PubMed] [Google Scholar]
- 13.Ludvigsson M, Milberg A, Marcusson J, Wressle E. Normal Aging or Depression? A Qualitative Study on the Differences Between Subsyndromal Depression and Depression in Very Old People. Gerontologist. 2014 doi: 10.1093/geront/gnt162. [DOI] [PubMed] [Google Scholar]
- 14.Sheline YI, Wang PW, Gado MH, Csernansky JG, Vannier MW. Hippocampal atrophy in recurrent major depression. Proc Natl Acad Sci U S A. 1996;93:3908–3913. doi: 10.1073/pnas.93.9.3908. [DOI] [PMC free article] [PubMed] [Google Scholar]
- 15.Steffens DC, McQuoid DR, Payne ME, Potter GG. Change in hippocampal volume on magnetic resonance imaging and cognitive decline among older depressed and nondepressed subjects in the neurocognitive outcomes of depression in the elderly study. Am J Geriatr Psychiatry. 2011;19:4–12. doi: 10.1097/JGP.0b013e3181d6c245. [DOI] [PMC free article] [PubMed] [Google Scholar]
- 16.den Heijer T, Tiemeier H, Luijendijk HJ, van der Lijn F, Koudstaal PJ, Hofman A, Breteler MM. A study of the bidirectional association between hippocampal volume on magnetic resonance imaging and depression in the elderly. Biol Psychiatry. 2011;70:191–197. doi: 10.1016/j.biopsych.2011.04.014. [DOI] [PubMed] [Google Scholar]
- 17.O’Brien JT, Lloyd A, McKeith I, Gholkar A, Ferrier N. A longitudinal study of hippocampal volume, cortisol levels, and cognition in older depressed subjects. The American journal of psychiatry. 2004;161:2081–2090. doi: 10.1176/appi.ajp.161.11.2081. [DOI] [PubMed] [Google Scholar]
- 18.Alexopoulos GS. Frontostriatal and limbic dysfunction in late-life depression. Am J Geriatr Psychiatry. 2002;10:687–695. [PubMed] [Google Scholar]
- 19.Sheline YI, Pieper CF, Barch DM, Welsh-Bohmer K, McKinstry RC, MacFall JR, D’Angelo G, Garcia KS, Gersing K, Wilkins C, Taylor W, Steffens DC, Krishnan RR, Doraiswamy PM. Support for the vascular depression hypothesis in late-life depression: results of a 2-site, prospective, antidepressant treatment trial. Arch Gen Psychiatry. 2010;67:277–285. doi: 10.1001/archgenpsychiatry.2009.204. [DOI] [PMC free article] [PubMed] [Google Scholar]
- 20.Wu D, Yuan Y, Bai F, You J, Li L, Zhang Z. Abnormal functional connectivity of the default mode network in remitted late-onset depression. J Affect Disord. 2013;147:277–287. doi: 10.1016/j.jad.2012.11.019. [DOI] [PubMed] [Google Scholar]
- 21.Royall DR, Palmer RF. Alzheimer’s disease pathology does not mediate the association between depressive symptoms and subsequent cognitive decline. Alzheimers Dement. 2013;9:318–325. doi: 10.1016/j.jalz.2011.11.009. [DOI] [PMC free article] [PubMed] [Google Scholar]
- 22.Lee JY, Park S, Mackin S, Ewers M, Chui H, Jagust W, Insel PS, Weiner MW. Differences in prefrontal, limbic, and white matter lesion volumes according to cognitive status in elderly patients with first-onset subsyndromal depression. PLoS One. 2014;9:e87747. doi: 10.1371/journal.pone.0087747. [DOI] [PMC free article] [PubMed] [Google Scholar]
- 23.Pomara N, Bruno D, Sarreal AS, Hernando RT, Nierenberg J, Petkova E, Sidtis JJ, Wisniewski TM, Mehta PD, Pratico D, Zetterberg H, Blennow K. Lower CSF amyloid beta peptides and higher F2-isoprostanes in cognitively intact elderly individuals with major depressive disorder. The American journal of psychiatry. 2012;169:523–530. doi: 10.1176/appi.ajp.2011.11081153. [DOI] [PMC free article] [PubMed] [Google Scholar]
- 24.Gerritsen L, Comijs HC, van der Graaf Y, Knoops AJ, Penninx BW, Geerlings MI. Depression, hypothalamic pituitary adrenal axis, and hippocampal and entorhinal cortex volumes--the SMART Medea study. Biol Psychiatry. 2011;70:373–380. doi: 10.1016/j.biopsych.2011.01.029. [DOI] [PubMed] [Google Scholar]
- 25.Ballmaier M, Narr KL, Toga AW, Elderkin-Thompson V, Thompson PM, Hamilton L, Haroon E, Pham D, Heinz A, Kumar A. Hippocampal morphology and distinguishing late-onset from early-onset elderly depression. Am J Psychiatry. 2008;165:229–237. doi: 10.1176/appi.ajp.2007.07030506. [DOI] [PMC free article] [PubMed] [Google Scholar]
- 26.Apostolova LG, Mosconi L, Thompson PM, Green AE, Hwang KS, Ramirez A, Mistur R, Tsui WH, de Leon MJ. Subregional hippocampal atrophy predicts Alzheimer’s dementia in the cognitively normal. Neurobiol Aging. 2010;31:1077–1088. doi: 10.1016/j.neurobiolaging.2008.08.008. [DOI] [PMC free article] [PubMed] [Google Scholar]
- 27.Wilson RS, Capuano AW, Boyle PA, Hoganson GM, Hizel LP, Shah RC, Nag S, Schneider JA, Arnold SE, Bennett DA. Clinical-pathologic study of depressive symptoms and cognitive decline in old age. Neurology. 2014;83:702–709. doi: 10.1212/WNL.0000000000000715. [DOI] [PMC free article] [PubMed] [Google Scholar]
- 28.Landau SM, Harvey D, Madison CM, Koeppe RA, Reiman EM, Foster NL, Weiner MW, Jagust WJ Alzheimer’s Disease Neuroimaging I. Associations between cognitive, functional, and FDG-PET measures of decline in AD and MCI. Neurobiol Aging. 2011;32:1207–1218. doi: 10.1016/j.neurobiolaging.2009.07.002. [DOI] [PMC free article] [PubMed] [Google Scholar]
- 29.Jack CR, Jr, Knopman DS, Jagust WJ, Petersen RC, Weiner MW, Aisen PS, Shaw LM, Vemuri P, Wiste HJ, Weigand SD, Lesnick TG, Pankratz VS, Donohue MC, Trojanowski JQ. Tracking pathophysiological processes in Alzheimer’s disease: an updated hypothetical model of dynamic biomarkers. Lancet neurology. 2013;12:207–216. doi: 10.1016/S1474-4422(12)70291-0. [DOI] [PMC free article] [PubMed] [Google Scholar]
- 30.Sperling RA, Aisen PS, Beckett LA, Bennett DA, Craft S, Fagan AM, Iwatsubo T, Jack CR, Jr, Kaye J, Montine TJ, Park DC, Reiman EM, Rowe CC, Siemers E, Stern Y, Yaffe K, Carrillo MC, Thies B, Morrison-Bogorad M, Wagster MV, Phelps CH. Toward defining the preclinical stages of Alzheimer’s disease: recommendations from the National Institute on Aging-Alzheimer’s Association workgroups on diagnostic guidelines for Alzheimer’s disease. Alzheimer’s & dementia: the journal of the Alzheimer’s Association. 2011;7:280–292. doi: 10.1016/j.jalz.2011.03.003. [DOI] [PMC free article] [PubMed] [Google Scholar]
- 31.Morris JC. The Clinical Dementia Rating (CDR): current version and scoring rules. Neurology. 1993;43:2412–2414. doi: 10.1212/wnl.43.11.2412-a. [DOI] [PubMed] [Google Scholar]
- 32.Folstein MF, Folstein SE, McHugh PR. “Mini-mental state”. A practical method for grading the cognitive state of patients for the clinician. Journal of psychiatric research. 1975;12:189–198. doi: 10.1016/0022-3956(75)90026-6. [DOI] [PubMed] [Google Scholar]
- 33.Weschler D. WMS-R Weschler Memory Scale Revised Manual. Ths Psychological Corporation, Harcourt Brace Jovanovich, Inc; New York: 1987. [Google Scholar]
- 34.Yesavage JA, Brink TL, Rose TL, Lum O, Huang V, Adey M, Leirer VO. Development and validation of a geriatric depression screening scale: a preliminary report. J Psychiatr Res. 1982;17:37–49. doi: 10.1016/0022-3956(82)90033-4. [DOI] [PubMed] [Google Scholar]
- 35.Paolo AM, Ryan JJ. Generalizability of two methods of estimating premorbid intelligence in the elderly. Arch Clin Neuropsychol. 1992;7:135–143. [PubMed] [Google Scholar]
- 36.Becker JA, Hedden T, Carmasin J, Maye J, Rentz DM, Putcha D, Fischl B, Greve DN, Marshall GA, Salloway S, Marks D, Buckner RL, Sperling RA, Johnson KA. Amyloid-beta associated cortical thinning in clinically normal elderly. Ann Neurol. 2011;69:1032–1042. doi: 10.1002/ana.22333. [DOI] [PMC free article] [PubMed] [Google Scholar]
- 37.Klunk WE, Engler H, Nordberg A, Wang Y, Blomqvist G, Holt DP, Bergstrom M, Savitcheva I, Huang GF, Estrada S, Ausen B, Debnath ML, Barletta J, Price JC, Sandell J, Lopresti BJ, Wall A, Koivisto P, Antoni G, Mathis CA, Langstrom B. Imaging brain amyloid in Alzheimer’s disease with Pittsburgh Compound-B. Ann Neurol. 2004;55:306–319. doi: 10.1002/ana.20009. [DOI] [PubMed] [Google Scholar]
- 38.Hedden T, Mormino EC, Amariglio RE, Younger AP, Schultz AP, Becker JA, Buckner RL, Johnson KA, Sperling RA, Rentz DM. Cognitive profile of amyloid burden and white matter hyperintensities in cognitively normal older adults. J Neurosci. 2012;32:16233–16242. doi: 10.1523/JNEUROSCI.2462-12.2012. [DOI] [PMC free article] [PubMed] [Google Scholar]
- 39.Johnson KA, Gregas M, Becker JA, Kinnecom C, Salat DH, Moran EK, Smith EE, Rosand J, Rentz DM, Klunk WE, Mathis CA, Price JC, Dekosky ST, Fischman AJ, Greenberg SM. Imaging of amyloid burden and distribution in cerebral amyloid angiopathy. Ann Neurol. 2007;62:229–234. doi: 10.1002/ana.21164. [DOI] [PubMed] [Google Scholar]
- 40.Mormino EC, Betensky RA, Hedden T, Schultz AP, Ward A, Huijbers W, Rentz DM, Johnson KA, Sperling RA Alzheimer’s Disease Neuroimaging I, Australian Imaging B, Lifestyle Flagship Study of A, Harvard Aging Brain S. Amyloid and APOE epsilon4 interact to influence short-term decline in preclinical Alzheimer disease. Neurology. 2014;82:1760–1767. doi: 10.1212/WNL.0000000000000431. [DOI] [PMC free article] [PubMed] [Google Scholar]
- 41.Gudmundsson P, Skoog I, Waern M, Blennow K, Palsson S, Rosengren L, Gustafson D. The relationship between cerebrospinal fluid biomarkers and depression in elderly women. Am J Geriatr Psychiatry. 2007;15:832–838. doi: 10.1097/JGP.0b013e3180547091. [DOI] [PubMed] [Google Scholar]
- 42.Madsen K, Hasselbalch BJ, Frederiksen KS, Haahr ME, Gade A, Law I, Price JC, Knudsen GM, Kessing LV, Hasselbalch SG. Lack of association between prior depressive episodes and cerebral [11C]PiB binding. Neurobiol Aging. 2012;33:2334–2342. doi: 10.1016/j.neurobiolaging.2011.11.021. [DOI] [PubMed] [Google Scholar]
- 43.Butters MA, Klunk WE, Mathis CA, Price JC, Ziolko SK, Hoge JA, Tsopelas ND, Lopresti BJ, Reynolds CF, 3rd, DeKosky ST, Meltzer CC. Imaging Alzheimer pathology in late-life depression with PET and Pittsburgh Compound-B. Alzheimer Dis Assoc Disord. 2008;22:261–268. doi: 10.1097/WAD.0b013e31816c92bf. [DOI] [PMC free article] [PubMed] [Google Scholar]
- 44.Diniz BS, Sibille E, Ding Y, Tseng G, Aizenstein HJ, Lotrich F, Becker JT, Lopez OL, Lotze MT, Klunk WE, Reynolds CF, Butters MA. Plasma biosignature and brain pathology related to persistent cognitive impairment in late-life depression. Mol Psychiatry. 2014 doi: 10.1038/mp.2014.76. [DOI] [PMC free article] [PubMed] [Google Scholar]
- 45.Jack CR, Jr, Wiste HJ, Weigand SD, Knopman DS, Lowe V, Vemuri P, Mielke MM, Jones DT, Senjem ML, Gunter JL, Gregg BE, Pankratz VS, Petersen RC. Amyloid-first and neurodegeneration-first profiles characterize incident amyloid PET positivity. Neurology. 2013;81:1732–1740. doi: 10.1212/01.wnl.0000435556.21319.e4. [DOI] [PMC free article] [PubMed] [Google Scholar]
- 46.Knopman DS, Jack CR, Jr, Wiste HJ, Weigand SD, Vemuri P, Lowe VJ, Kantarci K, Gunter JL, Senjem ML, Mielke MM, Roberts RO, Boeve BF, Petersen RC. Brain injury biomarkers are not dependent on beta-amyloid in normal elderly. Ann Neurol. 2013;73:472–480. doi: 10.1002/ana.23816. [DOI] [PMC free article] [PubMed] [Google Scholar]
- 47.Sheline YI. Hippocampal atrophy in major depression: a result of depression-induced neurotoxicity? Molecular psychiatry. 1996;1:298–299. [PubMed] [Google Scholar]
- 48.Sheline YI, Sanghavi M, Mintun MA, Gado MH. Depression duration but not age predicts hippocampal volume loss in medically healthy women with recurrent major depression. J Neurosci. 1999;19:5034–5043. doi: 10.1523/JNEUROSCI.19-12-05034.1999. [DOI] [PMC free article] [PubMed] [Google Scholar]
- 49.O’Brien JT, Lloyd A, McKeith I, Gholkar A, Ferrier N. A longitudinal study of hippocampal volume, cortisol levels, and cognition in older depressed subjects. Am J Psychiatry. 2004;161:2081–2090. doi: 10.1176/appi.ajp.161.11.2081. [DOI] [PubMed] [Google Scholar]
- 50.Schonheit B, Zarski R, Ohm TG. Spatial and temporal relationships between plaques and tangles in Alzheimer-pathology. Neurobiol Aging. 2004;25:697–711. doi: 10.1016/j.neurobiolaging.2003.09.009. [DOI] [PubMed] [Google Scholar]
- 51.Jack CR, Jr, Shiung MM, Gunter JL, O’Brien PC, Weigand SD, Knopman DS, Boeve BF, Ivnik RJ, Smith GE, Cha RH, Tangalos EG, Petersen RC. Comparison of different MRI brain atrophy rate measures with clinical disease progression in AD. Neurology. 2004;62:591–600. doi: 10.1212/01.wnl.0000110315.26026.ef. [DOI] [PMC free article] [PubMed] [Google Scholar]
- 52.Jack CR, Jr, Wiste HJ, Knopman DS, Vemuri P, Mielke MM, Weigand SD, Senjem ML, Gunter JL, Lowe V, Gregg BE, Pankratz VS, Petersen RC. Rates of beta-amyloid accumulation are independent of hippocampal neurodegeneration. Neurology. 2014;82:1605–1612. doi: 10.1212/WNL.0000000000000386. [DOI] [PMC free article] [PubMed] [Google Scholar]
- 53.Fjell AM, McEvoy L, Holland D, Dale AM, Walhovd KB Alzheimer’s Disease Neuroimaging I. Brain changes in older adults at very low risk for Alzheimer’s disease. J Neurosci. 2013;33:8237–8242. doi: 10.1523/JNEUROSCI.5506-12.2013. [DOI] [PMC free article] [PubMed] [Google Scholar]
- 54.McDonald CR, McEvoy LK, Gharapetian L, Fennema-Notestine C, Hagler DJ, Jr, Holland D, Koyama A, Brewer JB, Dale AM Alzheimer’s Disease Neuroimaging I. Regional rates of neocortical atrophy from normal aging to early Alzheimer disease. Neurology. 2009;73:457–465. doi: 10.1212/WNL.0b013e3181b16431. [DOI] [PMC free article] [PubMed] [Google Scholar]
- 55.Fjell AM, McEvoy L, Holland D, Dale AM, Walhovd KB Alzheimer’s Disease Neuroimaging I. What is normal in normal aging? Effects of aging, amyloid and Alzheimer’s disease on the cerebral cortex and the hippocampus. Prog Neurobiol. 2014 doi: 10.1016/j.pneurobio.2014.02.004. [DOI] [PMC free article] [PubMed] [Google Scholar]
- 56.Kumar A, Ajilore O, Zhang A, Pham D, Elderkin-Thompson V. Cortical Thinning in Patients With Late-Life Minor Depression. Am J Geriatr Psychiatry. 2013 doi: 10.1016/j.jagp.2012.12.010. [DOI] [PMC free article] [PubMed] [Google Scholar]
- 57.Dotson VM, Davatzikos C, Kraut MA, Resnick SM. Depressive symptoms and brain volumes in older adults: a longitudinal magnetic resonance imaging study. J Psychiatry Neurosci. 2009;34:367–375. [PMC free article] [PubMed] [Google Scholar]
- 58.Covinsky KE, Cenzer IS, Yaffe K, O’Brien S, Blazer DG. Dysphoria and anhedonia as risk factors for disability or death in older persons: implications for the assessment of geriatric depression. Am J Geriatr Psychiatry. 2014;22:606–613. doi: 10.1016/j.jagp.2012.12.001. [DOI] [PMC free article] [PubMed] [Google Scholar]
- 59.Wadsworth LP, Lorius N, Donovan NJ, Locascio JJ, Rentz DM, Johnson KA, Sperling RA, Marshall GA. Neuropsychiatric symptoms and global functional impairment along the Alzheimer’s continuum. Dementia and geriatric cognitive disorders. 2012;34:96–111. doi: 10.1159/000342119. [DOI] [PMC free article] [PubMed] [Google Scholar]
- 60.Palmer K, Di Iulio F, Varsi AE, Gianni W, Sancesario G, Caltagirone C, Spalletta G. Neuropsychiatric predictors of progression from amnestic-mild cognitive impairment to Alzheimer’s disease: the role of depression and apathy. Journal of Alzheimer’s disease: JAD. 2010;20:175–183. doi: 10.3233/JAD-2010-1352. [DOI] [PubMed] [Google Scholar]
- 61.Delrieu J, Desmidt T, Camus V, Sourdet S, Boutoleau-Bretonniere C, Mullin E, Vellas B, Payoux P, Lebouvier T Alzheimer’s Disease Neuroimaging I. Apathy as a feature of prodromal Alzheimer’s disease: an FDG-PET ADNI study. Int J Geriatr Psychiatry. 2014 doi: 10.1002/gps.4161. [DOI] [PubMed] [Google Scholar]
- 62.Marshall GA, Donovan NJ, Lorius N, Gidicsin CM, Maye J, Pepin LC, Becker JA, Amariglio RE, Rentz DM, Sperling RA, Johnson KA. Apathy is associated with increased amyloid burden in mild cognitive impairment. J Neuropsychiatry Clin Neurosci. 2013;25:302–307. doi: 10.1176/appi.neuropsych.12060156. [DOI] [PMC free article] [PubMed] [Google Scholar]
- 63.Kim G, DeCoster J, Huang CH, Bryant AN. A meta-analysis of the factor structure of the Geriatric Depression Scale (GDS): the effects of language. Int Psychogeriatr. 2013;25:71–81. doi: 10.1017/S1041610212001421. [DOI] [PubMed] [Google Scholar]
- 64.Adams KB, Matto HC, Sanders S. Confirmatory factor analysis of the geriatric depression scale. Gerontologist. 2004;44:818–826. doi: 10.1093/geront/44.6.818. [DOI] [PubMed] [Google Scholar]
- 65.Sheline YI, West T, Yarasheski K, Swarm R, Jasielec MS, Fisher JR, Ficker WD, Yan P, Xiong C, Frederiksen C, Grzelak MV, Chott R, Bateman RJ, Morris JC, Mintun MA, Lee JM, Cirrito JR. An antidepressant decreases CSF Abeta production in healthy individuals and in transgenic AD mice. Sci Transl Med. 2014;6:236re234. doi: 10.1126/scitranslmed.3008169. [DOI] [PMC free article] [PubMed] [Google Scholar]
Associated Data
This section collects any data citations, data availability statements, or supplementary materials included in this article.