Abstract
Background
Morphological divergence among related species involves changes to developmental processes. When such variation arises in development has garnered considerable theoretical interest relating to the broader issue of how development may constrain evolutionary change. The hourglass model holds that while early developmental events may be highly evolvable, there is a phylotypic stage when key developmental events are conserved. Thus, evolutionary divergence among related species should tend to arise after such a stage of reduced evolvability and, consequently, reduced variation among species. We test this prediction by comparing developmental trajectories among three avian species of varying relatedness (chick, quail, and duck) to locate their putative point of divergence. Three-dimensional geometric morphometrics and trajectory analyses were used to measure the significance of the facial shape variation observed among these species.
Results
Duck embryos, being more distantly related, differed from the more closely-related chick and quail embryos in the enlargement of their frontonasal prominences. Phenotypic trajectory analyses demonstrated divergence of the three species, most notably, duck.
Conclusions
The results demonstrate that the two more closely related species share similar facial morphologies for a longer time during development, while ducks diverge. This suggests a surprising lability of craniofacial development during early face formation.
Keywords: geometric morphometrics, facial shape, development, phenotypic trajectory, allometry, chick, quail, duck
Introduction
Evolution of morphology proceeds through changes to development. The question of to what extent developmental processes constrain and enable evolutionary change is a major issue in evolutionary biology. Clues to how this interplay unfolds can be obtained from determining at which developmental stages evolutionarily significant changes occur. The hourglass model holds that there are points in development when variation is constrained due to the influence of critical developmental events leading to similarity among species (Duboule, 1994; Kalinka and Tomancak, 2012; Fish et al, 2014; Young et al, 2014). Here, we compare three avian species to determine the embryonic stage at which their morphologies converge, then diverge again, to shed light on the more general question of how evolution acts on morphology to produce divergence among related species.
The existence of a stage during embryonic development in which the developmental trajectories of different species merge and/or subsequently diverge has been debated. Richardson (1995) points out the difficulty of establishing such a conserved period, in the face of heterochrony between various vertebrate classes and species. Also, the location of such a stage along the continuum of embryonic development is a subject of contention. Bininda-Emonds and colleagues (2003) found variation in external morphological features and traits between vertebrate species highest in the middle developmental stages, the opposite of the predicted hourglass-shaped model of phenotypic convergence in mid-development, and challenged that model’s proponents to define it more precisely. Kalinka and Tomancak (2012) provide empirical evidence to support phenotypic divergence in early embryonic development according to a phylotypic hourglass model. Young et al (2014) compared the shape changes and growth trajectories across embryonic and adult development of species from diverse vertebrate phyla (avian and non-avian) and hypothesized the existence of a phylotypic stage at the time of facial prominence fusion, after which most trajectories diverged.
One method whereby this period of divergence could be located is phenotypic trajectory analysis, in which trajectories of external craniofacial shape are mapped across a developmental period using principal components analyses to compare the orientation (general direction of the trajectory through the morphospace), shape (shape of the phenotypic trajectory through the morphospace corresponding to changes in phenotype over time), and size (relative length of the developmental pathway within shape space) of the shape change trajectories of species or groups (Mitteroecker et al, 2004; Adams and Collyer, 2009; Collyer and Adams, 2013). Geometric morphometrics has frequently been used to analyze craniofacial shape variation and developmental trajectories of embryos and adults during normal and abnormal development and across evolutionarily distinct clades (Mitteroecker et al, 2004; Zelditch et al, 2004; Mitteroecker et al, 2005; Willmore et al, 2006; Zelditch et al, 2006; Young et al, 2007; Boughner et al, 2008; Mitteroecker and Bookstein, 2009; Mitteroecker and Gunz, 2009; Young et al, 2010; Gonzalez et al, 2011; Jamniczky et al, 2011; Young et al, 2014).
In this study we compared the normal growth trajectories of chick, duck, and quail embryos over a range of developmental stages from Hamburger and Hamilton (1951) (HH) stages 22–27 using geometric morphometric analyses. The main question addressed in this study was: At what stage in development does morphological variation arise that is selected upon to produce evolutionary divergence among related avian species? More precisely, are there different stages after which selection acts, or can we assume that the earliest split is where selection can begin to act to produce divergence? Does craniofacial morphology of related species diverge from a common origin, or do species trajectories converge at a common point before diverging? At what morphological stage do interspecies differences become apparent?
For the purposes of this study, we chose these three avian species, two of which are of the order Galliformes (gamefowl: chick and quail) and one is of the order Anseriformes (waterfowl: duck); both orders belong to superorder Galloanserae (fowl). Chicks and quail are more closely related to each other than to ducks based on phylogenomic studies (Hackett et al, 2008; Kan et al, 2010). The Galliformes diverged from the Anseriformes approximately 105 mya, and within the Galliformes, chick and quail diverged much more recently at approximately 48.6 mya, based on a multilocus phylogenetic analysis (Pereira and Baker, 2006) (Figure 1). In terms of facial morphology, chick and quail embryos share more similar facial morphologies to each other than to ducks. At stage HH17, Brugmann et al (2006) found that the entire head regions of embryos from all three species were nearly identical, but at stage HH25, duck frontonasal prominences were broader than those of chick and quail (whose FNPs were of similar shape to each other). At hatching, all three species have unique facial features, however, even then, chick and quail embryos continue to resemble each other, more than the ducks, particularly in beak shape (the chick and quail have shorter, sharper beaks than the broad, long beak of the duck) (Schneider and Helms, 2003; Schneider, 2005; Brugmann et al, 2006). Brugmann et al (2006) used these morphological changes as evidence that more distantly related avian embryos show species-specific craniofacial morphologies earlier in embryogenesis, while those more closely related show more similarity in facial characteristics for a longer period during development. Here, we used a quantitative method that can identify more subtle differences between species and provide more detailed information on the nature of these differences in shape and developmental patterns.
Figure 1. Phylogeny of Galliformes (chick and quail) and Anseriformes (duck).
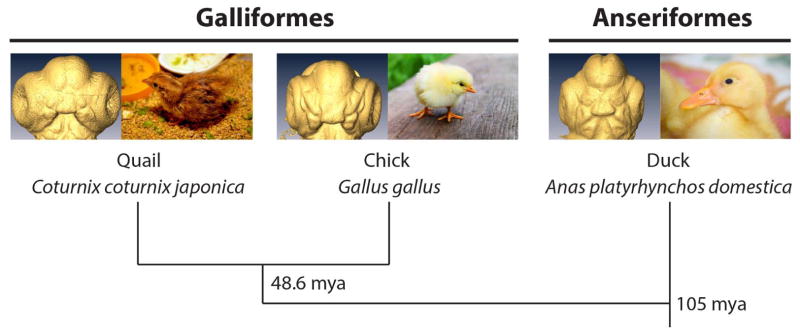
Approximately 105 mya, Galliformes and Anseriformes diverged. Much more recently (approximately 48.6 mya), within Galliformes, chick and quail diverged. Chick and quail embryos and hatchlings are more similar to each other than to the more distantly related duck embryo and hatchling. Divergence timescale estimates are derived from Pereira and Baker (2006). Photos of quail hatchling, chick, and duckling are from the public domain.
We hypothesize that the direction of morphological change through embryonic development is significantly more different in ducks than between the two more closely related species. To test this hypothesis, we compare the developmental trajectories for these three species as obtained from morphometric analysis of craniofacial landmarks in a cross-sectional sample of embryos spanning the morphogenesis of the face.
Results
Normal facial growth trajectory
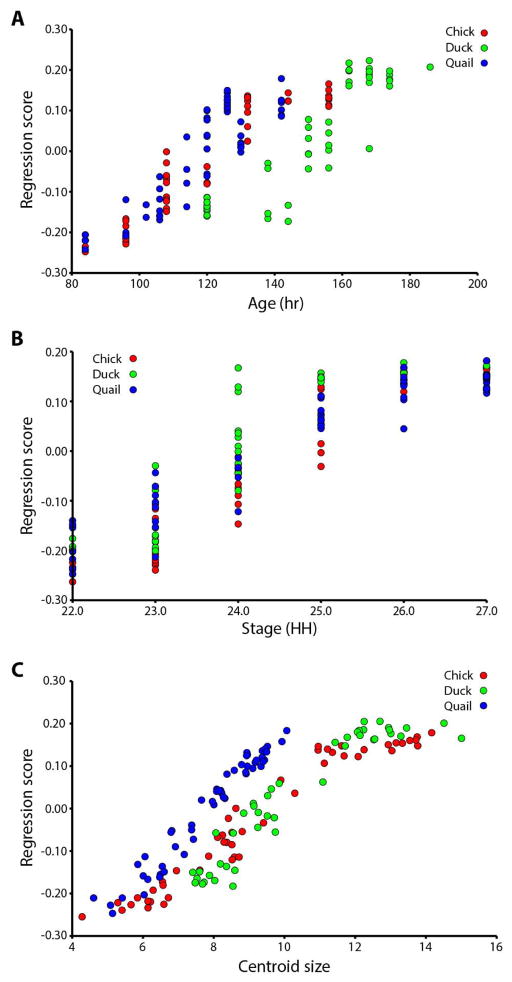
The slope of a linear regression of Procrustes coordinates against chronological age in hours (Fig. 2A) is similar for all three species, suggesting a similar speed of shape change. However, the association between age and overall craniofacial shape differs between ducks and the other two species (Fig. 2A), reflecting that ducks reach similar stages of craniofacial shape later after fertilization.
Figure 2. Regression analyses.
A. Regression on age (hours). Duck embryos are separated to the right of the other two species’ age trajectories. B. Regression on stage (HH). Duck embryos have higher shape scores at HH24 and later, compared to chick and quail. C. Regression on centroid size. Quail embryos separate to the left of the other two species’ shape-size curves.
The slope of a linear regression against HH stage (Fig. 2B) is also similar for chick and quail but different for duck. The fact that the duck embryos have a higher shape score at HH24–27 than the other species indicates that they are significantly different in shape at these HH stages.
The slope of a centroid size regression (Fig. 2C) is similar for all three species, showing similar rates of shape change. However, there is a difference in association between centroid size and shape between quail embryos and the other two species, showing that quail embryos display similar craniofacial shape to duck and chick embryos when they have smaller head sizes.
Facial shape variation among individuals
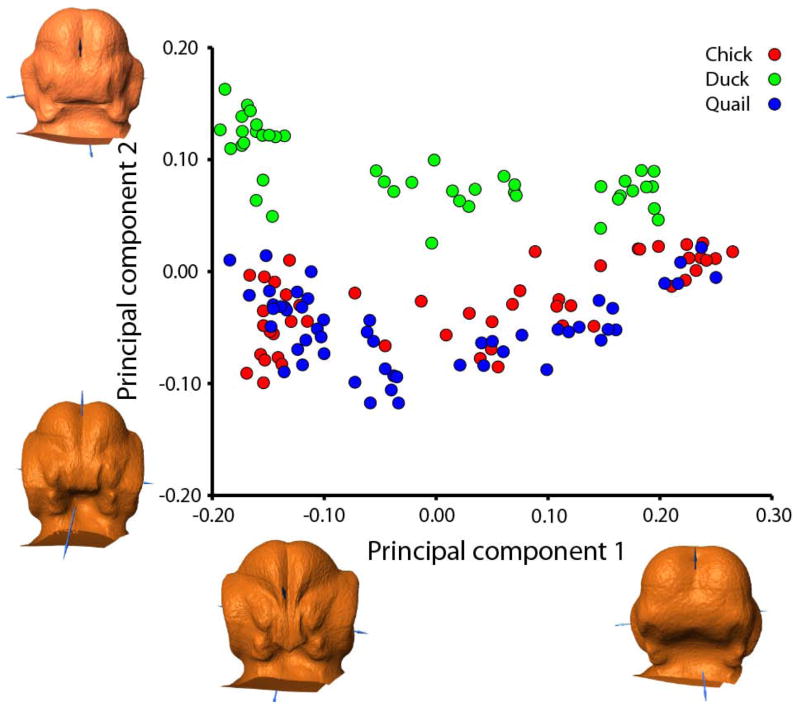
A principal components analysis (PCA) of the Procrustes coordinates shows that embryos are separated primarily by developmental age along the PC1 axis (corresponding to developmental age) (61.617% variance) by changes in the width of the frontonasal process (FNP), internasal distance, angle of nasal pits, width of the nasal pits, width of the oral cavity, distance between the maxillary processes, size of the eyes, and width of the forebrain. Duck embryos are separated from the other two species along PC2 (14.542% variance) (Fig. 3). Duck embryos have wider FNPs and oral cavities, higher forebrains, elongated heads, and smaller eyes in proportion to the head, than either chick or quail embryos.
Figure 3. Principal components analysis.
Individuals of all species are separated from each other primarily by developmental age along PC1 (changes in FNP width, internasal distance, angle and width of nasal pits, width of oral cavity, distance between maxillary processes, size of eyes, and width of forebrain). Duck embryos are separated from chick and quail by changes in FNP and oral cavity width, forebrain height, head length, and eye size (along PC2, by species).
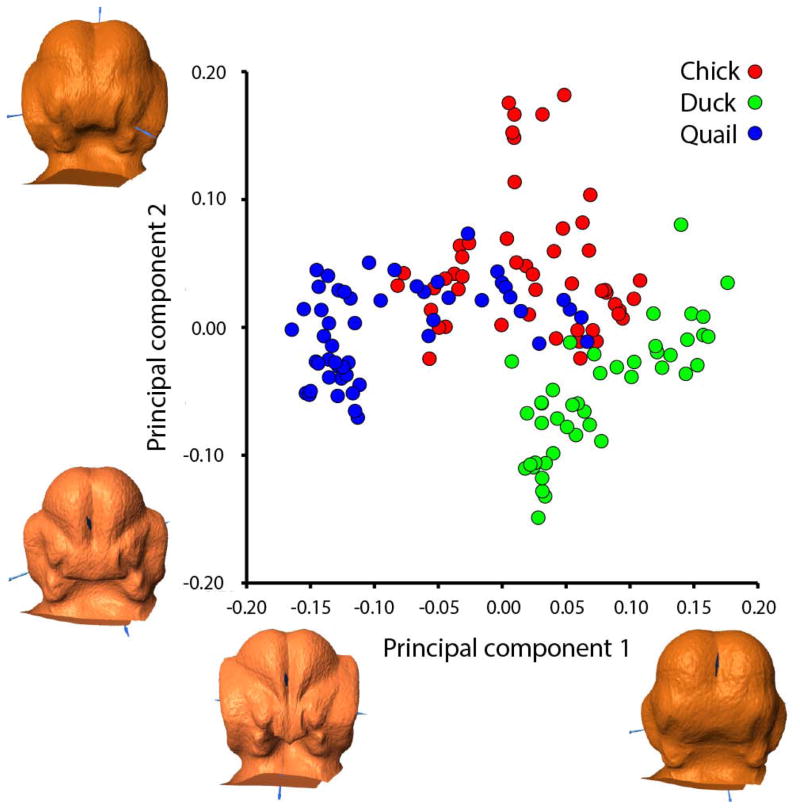
A PCA plot generated from regression residuals from a regression of Procrustes coordinates against centroid size shows primary separation of embryos by age along PC1 (43.986% variance) (changes in FNP width and shape, width of nasal pits, internasal distance, width of oral cavity, intermaxillary distance, width of forebrain, eye size, and length of head) and secondary separation by species along PC2 (20.283% variance) (FNP shape and width, internasal distance, angle of nasal pits, height of forebrain, oral cavity width, angle of maxillary processes, depth of ridge between forebrain hemispheres, and length of head and eyes) (Fig. 4). The plot for PC1 vs. PC2 for this analysis separates the species along PC2, with duck embryos separating to the lower right of the other two species. Chick and quail embryos overlap in the center of this plot of PC1 and PC2; the duck embryos hardly overlap with the others (Fig. 4).
Figure 4. Principal components analysis based on centroid size regression.
Embryos of all species are primarily separated along PC1, associated with age (changes in FNP width, FNP shape, nasal pit width, internasal distance, width of oral cavity, intermaxillary distance, forebrain width, eye size, and head length). Along PC2, there is a three-way divergence of the species (changes in shape and width of FNP, internasal distance, nasal pit angle, forebrain height, oral cavity width, maxillary process angle, depth of ridge between forebrain hemispheres, and length of head and eyes).
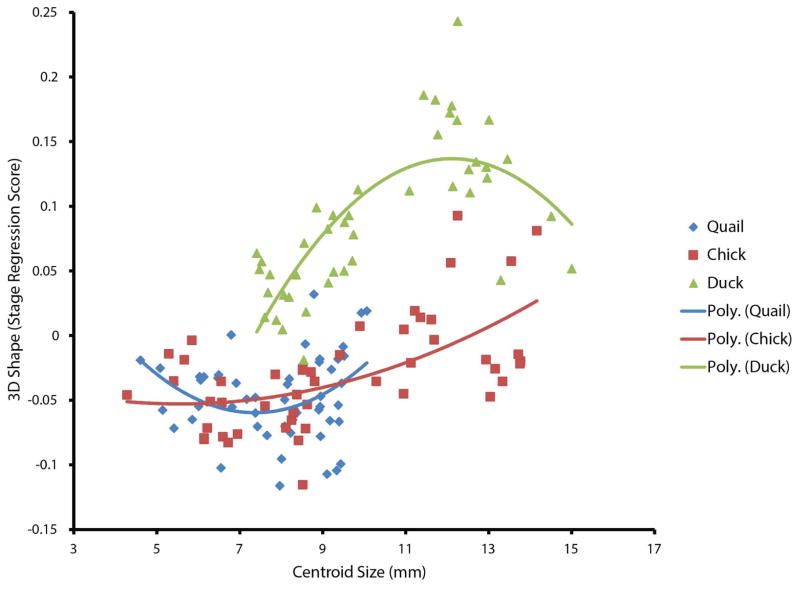
To further analyze the role of static allometry in shape variation, we regressed Procrustes coordinates on HH stage, then independently regressed these residuals on centroid size. On the 3D shape (stage regression score) vs. centroid size plot (Fig. 5), the chick and quail groups overlap, while the duck group is separated from the others, suggesting the chick and quail groups share a static allometric relationship, while the duck group diverges from them.
Figure 5. Regression of HH stage on centroid size.
While the chick and quail groups overlap and share a static allometric relationship, the ducks diverge. Trend lines (colour keyed by species) are 2nd-order polynomial.
Trajectory analysis
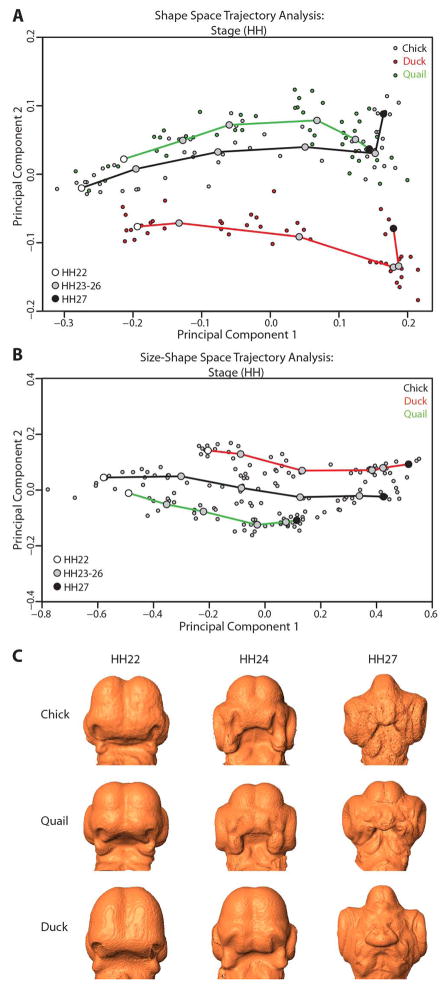
Trajectory analyses were performed to compare the developmental trajectories of the mean shapes of all three species through shape space (based on a PCA of Procrustes shape coordinates) and size-shape space (based on a PCA of Procrustes coordinates with centroid size included as an additional variable). Figure 6 depicts the results of a shape space trajectory analysis based on HH stage (Fig. 6A) and a size-shape space trajectory analysis also based on HH stage (Fig. 6B). Morphs of the average shape calculated for three representative stages (HH22, HH24, and HH27) were made for chick, quail, and duck embryos (Fig. 6C), in order to illustrate the frontonasal morphological changes evident across the developmental period under study and to allow for comparison between the species.
Figure 6. Trajectory analyses based on HH stage.
A. Shape space trajectory analysis (based solely on Procrustes coordinates) based on stage, PC1 vs. PC2 plot. Chick, duck, and quail trajectories follow significantly divergent orientations. Trajectories are of significantly different sizes between chick and quail and between duck and quail, but not between chick and duck. Trajectory shape is significantly different between duck and quail and between chick and duck (but not between chick and quail). B. Size-shape space trajectory analysis (after adding centroid size to Procrustes coordinates) based on stage, PC1 vs. PC2 plot. Chick, duck, and quail trajectories follow significantly different orientations between all species, and trajectory size differences between all species are significant. No significant trajectory shape change is evident between any of the species. C. Morphs of average shape per stage (HH22, HH24, and HH27) for chick, quail, and duck embryos.
In the shape space trajectory analysis based on stage (Fig. 6A), trajectory size (the difference in path distance) is significantly different between chick and quail (0.1743503, p=0.01) and duck and quail (0.1238611, p=0.02), but not between chick and duck (0.05048927, p=0.26). The trajectory orientation (measured as the angle in degrees) differs significantly between all three species (p=0.01 for each pairing): chick and duck (24.80187), chick and quail (18.06929), and duck and quail (21.70182). The trajectory shape difference (defined mathematically as Procrustes distance) is significant between duck and quail (0.2560213, p=0.02), barely significant between chick and duck (0.2418910, p=0.05), and not significant between chick and quail (0.1570686, p=0.46). The greatest trajectory shape change in the stage-based shape space analysis occurs near the end of the developmental trajectory (between stages HH26 and HH27) as a sharp bend upwards in the duck and chick trajectories, but there is no such change in the quail trajectory (Fig. 6A).
The trajectory analysis on stage was repeated for size-shape space in order to include the effect of scale on craniofacial form across this developmental period. In the stage-based size-shape trajectory analysis (Fig. 6B), trajectory size differs significantly among all species: chick and duck (0.2673959, p=0.01), chick and quail (0.442569, p=0.01), and duck and quail (0.175173, p=0.04). The difference in trajectory orientation is also significant among all three species (p=0.01 for each pairing): chick and duck (14.54794), chick and quail (12.36172), and duck and quail (13.08764). However there is no significant difference in trajectory shape at all among the species: chick and duck (0.1960886, p=0.30), chick and quail (0.1215659, p=0.77), or duck and quail (0.1596386, p=0.51).
The morphs (Fig. 6C) serve to illustrate the average shape for a sample chick, duck, and quail embryo at each of three representative stages (HH22, 24, and 27). At the earliest stages shown (HH22 and 24), all three species show similar shapes in the frontonasal process and prominences, but at HH27, the average duck FNP shape is larger and broader than those of the other two species, showing unique morphological divergence of duck from chick and quail.
Discussion
In this study, we addressed the question of when evolutionary differences in morphology appear in embryonic development among three species with different degrees of relatedness. As hypothesized, the more distantly related species is also the most divergent in terms of developmental trajectory. However, all three species are quite different during early face formation suggesting that significant variation exists before the stages sampled here. This suggests that developmental events occurring before and during face formation may contribute to evolutionarily significant morphological variation among related avian species. We also observed significant differences arising among the species occurring in later developmental stages.
Craniofacial morphological changes in avian embryos
Our analyses further quantify known differences in craniofacial embryonic shape development between these three species. We have observed that the craniofacial region of duck embryos develops later and is larger than that of chick and quail embryos. The duck craniofacial region also has a different shape from the other species at corresponding developmental stages. Duck frontonasal morphology diverges from the specimens of the more closely related chick and quail species during this developmental period.
The role of allometry in shape-size divergence of morphology
The three species studied differ in growth. Allometry refers to the component of shape variation correlated with size. This size-related shape variation can be further broken down into the component that is due to stage (ontogenetic allometry) and the component that is independent of stage (static allometry). To determine how much of the shape variation among the three species is due to static allometry, we conducted a morphometric analysis after regressing out the shape variation correlated with HH stage. In the resulting residuals, static allometry can be estimated by regressing the stage-normalized data on centroid size. If the difference between species is due to the shape correlates of size, shape variation within and among species should then fall along a single continuum along centroid size. Our results show that the chick and quail groups share a static allometric relationship, suggesting that some of the difference in shape between chick and quail is due to the fact that chicks are larger at each developmental stage. Ducks, however, diverge from this relationship, suggesting that allometry is not a major contributor to the difference between ducks and the other two species.
Chick, duck, and quail embryos follow divergent developmental trajectories
In both of the comparative analyses (shape space and size-shape space) of the avian developmental trajectories, all three species’ trajectories diverge in significantly different directions. In the event of divergent trajectories, there are three possible patterns of divergence (Mitteroecker et al, 2004): a common point of divergence for all trajectories, divergence of some trajectories at earlier versus later points along the common line of development or evolution, and finally, a skewing of trajectories indicating no apparent common point of divergence within the observed range of time. The divergence of avian species trajectories observed in the current study indicates the last of these three divergence patterns: the trajectories of chick, duck, and quail embryos are observed to be all significantly divergent and there is no observable point of divergence within the limited developmental range analyzed. It is possible that the putative point of divergence may have occurred earlier in development than could be seen given the limited range of embryonic stages and ages used, yet it is equally possible there is no such point of divergence. One way to find out which of these two possibilities is correct is to expand the analysis back to earlier stages and ages of embryos, until their putative divergence point appears. This is challenging, due to the difficulty of landmarking homologous craniofacial features of embryos younger than HH22, when external facial characteristics frequently do not exist.
The sharp upward bend of the duck and chick trajectories in the stage-based shape-space trajectory analysis can be explained by the convergence and fusion of the frontonasal prominences in chick and (especially) duck embryos around stage HH26, after which the direction of frontonsal morphogenesis changes in another direction (around HH27). No change in trajectory direction is evident in quail embryos. The analysis could perhaps be expanded to later stages (beyond HH27) to explore the new direction in which frontonasal morphogenesis progresses as the three species of embryos age, but a challenge potentially arises in the difficulty of landmarking homologous craniofacial features at older stages, when the relevant features disappear or are obscured by other features. Young et al (2014) have shown that after the period of convergence and divergence, there is potential for very wide divergence in many directions.
Of all three species, duck embryos are most divergent from the other two species, and chick and quail trajectories are most similar to each other in orientation. Duck embryos are the largest of the three species, have the longest gestation time (28 days to hatching, compared to 16 for quail and 21 for chick embryos). Due to the difference in gestation length among the species, duck embryos require a longer time to reach a given HH stage, while chick and quail embryos reach the equivalent stage earlier in gestation (Table 2). We have observed that ducks develop larger frontonasal prominences, longer maxillary and mandibular structures, and larger heads than chick and quail embryos (similar to the findings of Brugmann et al, 2006). Thus it is not surprising that duck embryos develop along a significantly different trajectory, while chick and quail embryos are similar to each other in size and morphology and follow more similar developmental trajectories. While Brugmann et al (2006) addressed a similar issue, our work differed from theirs in that we utilized geometric morphometrics and phenotypic trajectory analyses to quantify morphological variation and evolutionary divergence, although morphometrics is limited by the lack of clear facial landmarks on avian embryos younger than HH22.
Table 2. Range of gestation time associated with each HH stage per species.
Duck embryos require a longer time to reach a given HH stage than chicks and quail.
| Range of hours post conception associated with HH stage | ||||||
|---|---|---|---|---|---|---|
| Species (Gestation in days) | HH22 | HH23 | HH24 | HH25 | HH26 | HH27 |
| Quail (16) | 84–114 | 96–114 | 96–120 | 114–130 | 120–126 | 126–142 |
| Chick (21) | 84–96 | 96–108 | 108–120 | 108–156 | 108–156 | 144+ |
| Duck (28) | 120–138 | 120–156 | 144–168 | 144–174 | 162–174 | 174–186 |
The broader implications of our results extend beyond galliform and anseriform avian species; similar predictions could be made and tested across the broader spectrum of Aves in order to find points of divergence between orders and species within orders. At the earliest stages of development, the craniofacial morphology can be very similar among species, but evolutionarily relevant differences do arise early in development (Fish et al, 2014; Young et al, 2014). These early-arising morphological differences can influence adult morphological differences, as we have seen in duck embryos compared to chick and quail embryos. Thus, it is possible that those evolutionary processes leading to adult morphological divergence act on morphogenetic processes that occur early in development. By performing analyses on other avian species across the greater spectrum, we could address the question as to which aspects of adult phenotypic variation among species are determined early and which can be modified through changes at later stages.
Experimental Procedures
Avian Embryos
Fertile White Leghorn chicken (Gallus gallus) eggs (Petaluma Farms, Petaluma, CA), White Pekin duck (Anas platyrhynchos domestica) eggs and Japanese quail (Coturnix japonica) eggs (AA Lab Eggs Inc., Westminster, CA) were incubated in a humidified chamber (Hova-Bator, GQF Manufacturing, Savannah, GA) at 37.5°C. The day on which the eggs were placed in the incubator was designated as day 0. Avian embryos were collected on days 3 to 7 and staged using a strategy that relies on external morphological characters and that is independent of body size and incubation time (Hamilton, 1965; Ricklefs and Starck, 1998; Starck and Ricklefs, 1998). Specifically, we applied the Hamburger and Hamilton (HH) staging system, which was originally developed for chick (Hamburger and Hamilton, 1951). Other staging systems are available for duck (Koecke, 1958) and quail (Padgett and Ivey, 1960; Zacchei, 1961; Nakane and Tsudzuki, 1999; Ainsworth et al, 2010) but these embryos can also be staged using the HH system for chick (Yamashita and Sohal, 1987; Starck, 1989; Le Douarin et al, 1996; Schneider and Helms, 2003; Tucker and Lumsden, 2004; Lwigale and Schneider, 2008; Ainsworth et al, 2010; Mitgutsch et al, 2011). Criteria employed to align chick, quail, and duck at each HH stage change over time depending on which features become prominent. For the embryonic stages examined in this study, we relied primarily on growth of the limbs, facial primordia, pharyngeal arches, and eyes since these are good indicators of stage (Schneider and Helms, 2003; Lwigale and Schneider, 2008; Merrill et al, 2008; Ealba and Schneider, 2013; Fish et al, 2014; Hall et al, 2014).
Due to the difference in gestation times among the three species (16 total days of gestation for quail, 21 for chicks, and 28 for ducks), there were differences noted in the time required to reach the equivalent HH stage (Table 2). Specimens between HH22–27 were chosen because they encompass the earliest period of facial prominence growth and fusion. The width of this range was limited because homologous craniofacial landmarks cannot be defined over a wider period of development. Embryos were removed from extraembryonic membranes and sacrificed by decapitation. The embryonic heads were washed in 1X PBS (phosphate buffered saline), and fixed overnight in 4% paraformaldehyde (PFA) in 1X PBS at 4°C.
Three-dimensional Geometric Morphometrics
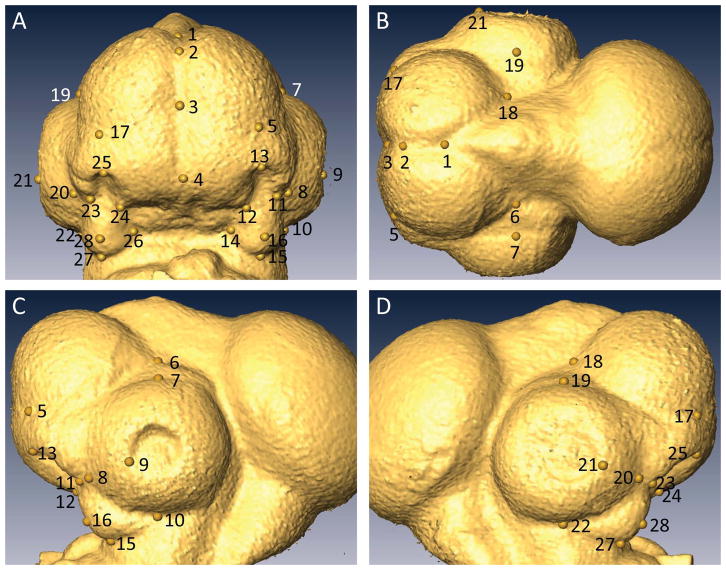
In preparation for scanning, the embryos were removed from PFA, washed in 1X PBS, and soaked in CystoConray II contrast agent (Tyco Healthcare Canada, Montreal, QC) for at least 30 minutes. After washing in 1X PBS and careful drying with a paper wipe, each specimen’s neck was mounted in a wax bed, allowing the head to be imaged in air using a Scanco μCT35 scanner (Scanco Medical AG, Bruttisellen, Switzerland). Twenty-eight morphological landmarks, homologously defined for all three species across the developmental period (Fig. 7, landmark definitions in Table 1) were identified on ectodermal surfaces derived from each μCT image within Amira 3D image visualization software (FEI Visualization Sciences Group, Burlington, MA). The 3D coordinates of these landmarks were analyzed in MorphoJ morphometric software (Klingenberg, 2011).
Figure 7. Avian embryonic landmarks.
A. Frontal view. B. Superior view. C. Left lateral view. D. Right lateral view. Landmark definitions in Table 1.
Table 1. Landmark definitions for avian embryos.
Paired landmarks are indicated by two numbers separated by /.
| Landmark | Definition |
|---|---|
| 1 | Deepest midline point in 3-way junction between forebrain hemispheres and midbrain |
| 2 | In standard lateral orientation*: Point along the midline curve between forebrain hemispheres, when the curve changes from largely horizontal to largely vertical. |
| 3 | Deepest point in 4-way junction between medial nasal processes and the base of forebrain hemispheres |
| 4 | Point at midline tip of frontonasal process, at point of greatest curvature between vertical (frontonasal) and horizontal (palatal) aspects (in embryos sub-HH25) [In embryos HH25 and older, this is a pointy tip, so place landmark at inferior-most midline point on tip] |
| 5/17 | Point at border between forebrain and nasal processes that is directly superior to the most superior point of nasal pit |
| 6/18 | Point at inferior-posterior corner of forebrain (meeting of vertical and horizontal seams) |
| 7/19 | In standard lateral orientation: Point on superior-most edge of eye |
| 8/20 | Point at edge of eye, that exists at the end of the valley between lateral nasal process and maxillary process |
| 9/21 | Point at edge of lens placode/lens pit, placed in alignment with the valley between lateral nasal process and maxillary process |
| 10/22 | In standard lateral orientation: Point on inferior-most edge of eye |
| 11/23 | Point at inferior tip of lateral nasal process, taken along midline of the lateral nasal process |
| 12/24 | Point at inferior-lateral tip of medial nasal process/FNP |
| 13/25 | Point at superior border of nasal pit |
| 14/26 | Point at juncture between palate, mandibular process, and maxillary process (Works best at younger stages (HH22–25), will be obscured at older stages (above HH25) by potential pockets of fluid scanned with the specimen) |
| 15/27 | Inferior point of maxillary process, taken along the midline of the maxillary process |
| 16/28 | Anteriormost point on the midline of the maxillary process |
Standard Lateral Orientation: View the embryo with the eye in the center of view. For younger embryos, make the anterior curve of the forebrain as vertical as possible. For older embryos, when the anterior forebrain is rounder, make the line between the anterior extent of the forebrain and the point (#3) at the midline border of the forebrain and medial nasal processes (developing beak) as vertical as possible.
After Procrustes superimposition, linear regression analysis was performed separately on centroid size (average size of a specimen around a central point determined by Procrustes superimposition), age (hours), and stage (HH). By performing separate regressions on age, stage, and centroid size, we hoped to see if there was a difference in the degree of variation related to developmental age (both in hours and in HH stages) and size (ie, whether either stage or size exerted differential effects on variation).
Principal components analysis (PCA) was used to analyze facial shape variation between specimens. The first two principal components accounted for most of the variation in craniofacial morphology. Three-dimensional morphs were generated in Landmark three-dimensional visualization software (Institute for Data Analysis and Visualization, Davis, CA) from the PC1 and PC2 coordinate data for the positive and negative extremes of the relevant PC’s scale factor range (taken from the MorphoJ data); for each PC axis, the associated morphs served to visualize the range of craniofacial morphological changes in embryos.
Because the first PCA included significant size-associated shape variation (and one of the first PCs was likely to be associated with size), a second PCA on regression residuals from the regression of Procrustes coordinates against centroid size was performed. As in the initial PCA, morphs on the principal components’ coordinate data along the scale factor range were made to visualize the range of craniofacial shape variation along the relevant PC axes.
To analyze the possible role of static allometry (defined by McGuigan et al (2010) as shape variation due to size of specimens measured within a single stage of development) in shape variation, Procrustes coordinates were regressed on HH stage to remove stage-associated variation not previously removed by the regression on centroid size. The resulting residuals were independently regressed on centroid size.
Trajectory Analysis
Trajectory analyses to compare the trajectory size, shape, and orientation were performed within the geomorph library (Adams and Otarola-Castillo, 2013) within R (R Developmental Core Team, 2008). A Procrustes superimposition was performed. We first ran a PCA solely on the Procrustes shape coordinates without accounting for size-associated shape variation (as a shape space analysis), based on HH stage. In a shape space analysis, the horizontal (PC1) axis usually represents allometric shape (the variation in shape predicted by centroid size regression) (Mitteroecker et al, 2004).
Subsequently, as first introduced by Mitteroecker et al (2004), we added in an extra column containing centroid size data corresponding to the shape coordinates, in order to analyze allometry by PCA of the data distribution in a size-shape space, again based on HH stage. Mitteroecker et al (2004) reasoned that since log centroid size would have the greatest variance of any column in the size-shape matrix, the resulting PC1 of the size-shape distribution would closely align with size.
In both the shape space and size-shape space trajectory analyses, three parameters were measured and mathematically defined in geomorph: trajectory size, orientation, and shape (Collyer and Adams, 2013). Trajectory size, the relative length of the trajectory through the morphospace, was measured as the path distance difference. The trajectory orientation, or general direction of the trajectory through the morphospace, was measured as an angle (degrees). The shape of the trajectory corresponding to phenotypic changes over time was measured in Procrustes distance (shape distance) (Collyer and Adams, 2013). Trajectories were visualized as lines running between points representing mean values for species/developmental group combinations through the shape space and the size-shape space PC1 vs. PC2 scatter plots, representing the average trajectory orientation, size, and shape. Each species’ trajectory was colour-coded for ease of identification (black for chick, red for duck, and green for quail). To establish significance of the difference between trajectories, we performed pairwise comparisons using each of the parameters (trajectory size, orientation, and shape) as test statistics (Collyer and Adams, 2013); the p value cutoff was p<0.05. Three-dimensional morphs, using an example embryo from each species for three representative stages, HH22, 24, and 27, were generated for the average shape calculated per stage in Landmark three-dimensional visualization software (Institute for Data Analysis and Visualization, Davis, CA).
Acknowledgments
We wish to thank Katie Brackora and Marta Linde in the Marcucio lab for providing avian embryos for this study. This research was funded by National Institutes of Health/National Institute for Dental and Craniofacial Research (NIH/NIDCR) and Natural Sciences and Engineering Research Council of Canada (NSERC) grants (NIH/NIDCR R01 1R01 DE021708 and 1R01 DE01963 to B.H. and R.M. and R01 DE016402 to R.A.S., and NSERC #238992-12 to B.H.).
References
- Adams DC, Collyer ML. A general framework for the analysis of phenotypic trajectories in evolutionary studies. Evol. 2009;63:1143–1154. doi: 10.1111/j.1558-5646.2009.00649.x. [DOI] [PubMed] [Google Scholar]
- Adams DC, Otarola-Castillo E. Geomorph: an R package for the collection and analysis of geometric morphometric shape data. Meth Ecol Evol. 2013;4:393–399. [Google Scholar]
- Ainsworth SJ, Stanley RL, Evans DJ. Developmental stages of the Japanese quail. J Anat. 2010;216:3–15. doi: 10.1111/j.1469-7580.2009.01173.x. [DOI] [PMC free article] [PubMed] [Google Scholar]
- Bininda-Emonds ORP, Jeffery JE, Richardson MK. Inverting the hourglass: quantitative evidence against the phylotypic stage in vertebrate development. Proc Biol Sci. 2003;270:341–346. doi: 10.1098/rspb.2002.2242. [DOI] [PMC free article] [PubMed] [Google Scholar]
- Boughner JC, Wat S, Diewert VM, Young NM, Browder LW, Hallgrimsson B. Short-faced mice and developmental interactions between the brain and the face. J Anat. 2008;213:646–662. doi: 10.1111/j.1469-7580.2008.00999.x. [DOI] [PMC free article] [PubMed] [Google Scholar]
- Brugmann SA, Kim J, Helms JA. Looking different: understanding diversity in facial form. Am J Med Genet Part A. 2006;140A:2521–2529. doi: 10.1002/ajmg.a.31361. [DOI] [PubMed] [Google Scholar]
- Collyer ML, Adams DC. Phenotypic trajectory analysis: comparison of shape change patterns in evolution and ecology. Hystrix. 2013;24:75–83. [Google Scholar]
- Duboule D. Temporal colinearity and the phylotypic progression: a basis for the stability of a vertebrate Bauplan and the evolution of morphologies through heterochrony. Dev Suppl. 1994:135–142. [PubMed] [Google Scholar]
- Ealba EL, Schneider RA. A simple PCR-based strategy for estimating species-specific contributions in chimeras and xenografts. Development. 2013;140:3062–3068. doi: 10.1242/dev.092676. [DOI] [PMC free article] [PubMed] [Google Scholar]
- Fish JL, Sklar RS, Woronowicz KC, Schneider RA. Multiple developmental mechanisms regulate species-specific jaw size. Development. 2014;141:674–684. doi: 10.1242/dev.100107. [DOI] [PMC free article] [PubMed] [Google Scholar]
- Gonzalez PN, Hallgrimsson B, Oyhenart EE. Developmental plasticity in covariance structure of the skull: effects of prenatal stress. J Anat. 2011;218:243–257. doi: 10.1111/j.1469-7580.2010.01326.x. [DOI] [PMC free article] [PubMed] [Google Scholar]
- Hackett SJ, Kimball RT, Reddy S, Bowie RCK, Braun EL, Braun MJ, Chojnowski JL, Cox WA, Han K, Harshman J, Huddleston CJ, Marks BD, Miglia KJ, Moore WS, Sheldon FH, Steadman DW, Witt CC, Yuri T. A phylogenomic study of birds reveals their evolutionary history. Science. 2008;320:1763–1768. doi: 10.1126/science.1157704. [DOI] [PubMed] [Google Scholar]
- Hall J, Jheon AH, Ealba EL, Eames BF, Butcher KD, Mak SS, Ladher R, Alliston T, Schneider RA. Evolution of a developmental mechanism: Species-specific regulation of the cell cycle and the timing of events during craniofacial osteogenesis. Dev Biol. 2014;385:380–395. doi: 10.1016/j.ydbio.2013.11.011. [DOI] [PMC free article] [PubMed] [Google Scholar]
- Hamilton HL. Lillie’s Development of the Chick: An Introduction to Embryology. New York: Holt, Rinehart and Winston; 1965. [Google Scholar]
- Hamburger V, Hamilton HL. A series of developmental stages in development of the chick embryo. J Morphol. 1951;88:49–92. [PubMed] [Google Scholar]
- Jamniczky HA, Hallgrimsson B. Modularity in the skull and cranial vasculature of laboratory mice: implications for the evolution of complex phenotypes. Evol Dev. 2011;13:28–37. doi: 10.1111/j.1525-142X.2010.00453.x. [DOI] [PubMed] [Google Scholar]
- Kalinka AT, Tomancak P. The evolution of early animal embryos: conservation or divergence? Trends Ecol Evol. 2012;27:385–393. doi: 10.1016/j.tree.2012.03.007. [DOI] [PubMed] [Google Scholar]
- Kan XZ, Yang JK, Li XF, Chen L, Lei ZP, Wang M, Qian CJ, Gao H, Yang ZY. Phylogeny of major lineages of galliform birds (Aves: Galliformes) based on complete mitochondrial genomes. Genet Mol Res. 2010;9:1625–1633. doi: 10.4238/vol9-3gmr898. [DOI] [PubMed] [Google Scholar]
- Klingenberg CP. MorphoJ: an integrated software package for geometric morphometrics. Mol Ecol Resour. 2011;11:353–357. doi: 10.1111/j.1755-0998.2010.02924.x. [DOI] [PubMed] [Google Scholar]
- Koecke H. Normalstadien der Embryonalentwicklung bei der Hausente (Anas boschas domestica) Embryologica. 1958;4:55–78. [Google Scholar]
- Le Douarin NM, Dieterlen-Lievre F, Teillet M. Quail-Chick Transplantations. In: Bronner-Fraser M, editor. Methods in Avian Embryology. San Diego: Academic Press; 1996. pp. 23–59. [PubMed] [Google Scholar]
- Lwigale PY, Schneider RA. Other chimeras: quail-duck and mouse-chick. Methods Cell Biol. 2008;87:59–74. doi: 10.1016/S0091-679X(08)00203-3. [DOI] [PubMed] [Google Scholar]
- McGuigan K, Nishimura N, Currey M, Hurwit D, Cresko WA. Quantitative genetic variation in static allometry in the threespine stickleback. Integr Comp Biol. 2010;50:1067–1080. doi: 10.1093/icb/icq026. [DOI] [PubMed] [Google Scholar]
- Merrill AE, Eames BF, Weston SJ, Heath T, Schneider RA. Mesenchyme-dependent BMP signaling directs the timing of mandibular osteogenesis. Development. 2008;135:1223–1234. doi: 10.1242/dev.015933. [DOI] [PMC free article] [PubMed] [Google Scholar]
- Mitgutsch C, Wimmer C, Sanchez-Villagra MR, Hahnloser R, Schneider RA. Timing of ossification in duck, quail, and zebra finch: intraspecific variation, heterochronies, and life history evolution. Zoological Science. 2011;28:491–500. doi: 10.2108/zsj.28.491. [DOI] [PMC free article] [PubMed] [Google Scholar]
- Mitteroecker P, Bookstein F. The ontogenetic trajectory of the phenotypic covariance matrix, with examples from craniofacial shape in rats and humans. Evol. 2009;63:727–737. doi: 10.1111/j.1558-5646.2008.00587.x. [DOI] [PubMed] [Google Scholar]
- Mitteroecker P, Gunz P. Advances in geometric morphometrics. Evol Biol. 2009;36:235–247. [Google Scholar]
- Mitteroecker P, Gunz P, Bernhard M, Schaefer K, Bookstein FL. Comparison of cranial ontogenetic trajectories among great apes and humans. J Hum Evol. 2004;46:679–698. doi: 10.1016/j.jhevol.2004.03.006. [DOI] [PubMed] [Google Scholar]
- Mitteroecker P, Gunz P, Bookstein FL. Heterochrony and geometric morphometrics: a comparison of cranial growth in Pan paniscus versus Pan troglodytes. Evol Dev. 2005;7:244–258. doi: 10.1111/j.1525-142X.2005.05027.x. [DOI] [PubMed] [Google Scholar]
- Nakane Y, Tsudzuki M. Development of the skeleton in Japanese quail embryos. Dev Growth Differ. 1999;41:523–534. doi: 10.1046/j.1440-169x.1999.00454.x. [DOI] [PubMed] [Google Scholar]
- Padgett CS, Ivey WD. The normal embryology of the Coturnix quail. Anat Rec. 1960;137:1–11. doi: 10.1002/ar.1091370102. [DOI] [PubMed] [Google Scholar]
- Pereira SL, Baker AJ. A molecular timescale for galliform birds accounting for uncertainty in time estimates and heterogeneity of rates of DNA substitutions across lineages and sites. Mol Phylogenet Evol. 2006;38:499–509. doi: 10.1016/j.ympev.2005.07.007. [DOI] [PubMed] [Google Scholar]
- R Developmental Core Team. R: A Language and Environment for Statistical Computing. Vienna, Austria: R Foundation for Statistical Computing; 2008. [Google Scholar]
- Richardson MK. Heterochrony and the phylotypic period. Dev Biol. 1995;172:412–421. doi: 10.1006/dbio.1995.8041. [DOI] [PubMed] [Google Scholar]
- Ricklefs RE, Starck JM. Embryonic Growth and Development. In: Starck JM, Ricklefs RE, editors. Avian growth and development: evolution within the altricial-precocial spectrum. New York: Oxford University Press; 1998. pp. 31–58. [Google Scholar]
- Schneider RA, Helms JA. The cellular and molecular origins of beak morphology. Science. 2003;299:565–568. doi: 10.1126/science.1077827. [DOI] [PubMed] [Google Scholar]
- Schneider RA. Developmental mechanisms facilitating the evolution of bills and quills. J Anat. 2005;207:563–573. doi: 10.1111/j.1469-7580.2005.00471.x. [DOI] [PMC free article] [PubMed] [Google Scholar]
- Starck JM. Zeitmuster der Ontogenesen bei nestfluchtenden und nesthockenden Vogeln. Cour Forsch-Inst Senckenberg. 1989;114:1–319. [Google Scholar]
- Starck JM, Ricklefs RE. Avian growth and development: evolution within the altricial-precocial spectrum. New York: Oxford University Press; 1998. p. x.p. 441. [Google Scholar]
- Tucker AS, Lumsden A. Neural crest cells provide species-specific patterning information in the developing branchial skeleton. Evol Dev. 2004;6:32–40. doi: 10.1111/j.1525-142x.2004.04004.x. [DOI] [PubMed] [Google Scholar]
- Willmore KE, Leamy L, Hallgrimsson B. Effects of developmental and functional interactions on mouse cranial variability through late ontogeny. Evol Dev. 2006;8:550–567. doi: 10.1111/j.1525-142X.2006.00127.x. [DOI] [PubMed] [Google Scholar]
- Yamashita T, Sohal GS. Embryonic origin of skeletal muscle cells in the iris of the duck and quail. Cell Tissue Res. 1987;249:31–37. doi: 10.1007/BF00215415. [DOI] [PubMed] [Google Scholar]
- Young NM, Chong HJ, Hu D, Hallgrimsson B, Marcucio RS. Quantitative analyses link modulation of sonic hedgehog signaling to continuous variation in facial growth and shape. Development. 2010;137:3405–3409. doi: 10.1242/dev.052340. [DOI] [PMC free article] [PubMed] [Google Scholar]
- Young NM, Hu D, Lainoff AJ, Smith FJ, Diaz R, Tucker AS, Trainor PA, Schneider RA, Hallgrimsson B, Marcucio RS. Embryonic bauplans and the developmental origins of facial diversity and constraint. Development. 2014;141:1059–1063. doi: 10.1242/dev.099994. [DOI] [PMC free article] [PubMed] [Google Scholar]
- Young NM, Wat S, Diewert VM, Browder LW, Hallgrimsson B. Comparative morphometrics of embryonic facial morphogenesis: implications for cleft-lip etiology. Anat Rec (Hoboken) 2007;290:123–139. doi: 10.1002/ar.20415. [DOI] [PubMed] [Google Scholar]
- Zacchei AM. The embryonic development of the Japanese quail (Coturnix coturnix japonica) Arch Ital Anat Embriol. 1961;66:36–62. [PubMed] [Google Scholar]
- Zelditch LM, Lundrigan BL, Garland T., Jr Developmental regulation of skull morphology. I. Ontogenetic dynamics of variance. Evol Dev. 2004;6:194–206. doi: 10.1111/j.1525-142X.2004.04025.x. [DOI] [PubMed] [Google Scholar]
- Zelditch LM, Mezey J, Sheets HD, Lundrigan BL, Garland T., Jr Developmental regulation of skull morphology II: ontogenetic dynamics of covariance. Evol Dev. 2006;8:46–60. doi: 10.1111/j.1525-142X.2006.05074.x. [DOI] [PubMed] [Google Scholar]


