

Abstract
Purpose:
To compare two coverage-based planning (CP) techniques with fixed margin-based (FM) planning for high-risk prostate cancer treatments, with the exclusive consideration of the dosimetric impact of delineation uncertainties of target structures and normal tissues.
Methods:
In this work, 19-patient data sets were involved. To estimate structure dose for each delineated contour under the influence of interobserver contour variability and CT image quality limitations, 1000 alternative structures were simulated by an average-surface-of-standard-deviation model, which utilized the patient-specific information of delineated structure and CT image contrast. An IMRT plan with zero planning-target-volume (PTV) margin on the delineated prostate and seminal vesicles [clinical-target-volume (CTVprostate) and CTVSV] was created and dose degradation due to contour variability was quantified by the dosimetric consequences of 1000 alternative structures. When D98 failed to achieve a 95% coverage probability objective D98,95 ≥ 78 Gy (CTVprostate) or D98,95 ≥ 66 Gy (CTVSV), replanning was performed using three planning techniques: (1) FM (PTVprostate margin = 4,5,6 mm and PTVSV margin = 4,5,7 mm for RL, PA, and SI directions, respectively), (2) CPOM which optimized uniform PTV margins for CTVprostate and CTVSV to meet the D98,95 objectives, and (3) CPCOP which directly optimized coverage-based objectives for all the structures. These plans were intercompared by computing percentile dose-volume histograms and tumor-control probability/normal tissue complication probability (TCP/NTCP) distributions.
Results:
Inherent contour variability resulted in unacceptable CTV coverage for the zero-PTV-margin plans for all patients. For plans designed to accommodate contour variability, 18/19 CP plans were most favored by achieving desirable D98,95 and TCP/NTCP values. The average improvement of probability of complication free control was 9.3% for CPCOP plans and 3.4% for CPOM plans.
Conclusions:
When the delineation uncertainties need to be considered for prostate patients, CP techniques can produce more desirable plans than FM plans for most patients. The relative advantages between CPCOP and CPOM techniques are patient specific.
Keywords: coverage, treatment planning, IMRT optimization, delineation uncertainties, prostate cancer
1. INTRODUCTION
With the development of image guided radiation therapy (IGRT), delineation (contouring) uncertainties (DUs) are becoming the dominant geometric uncertainties to be accounted for in treatment planning.1,2 Uncertainty regarding the microscopic spread of disease and the inability to reproducibly distinguish gross tumor—normal tissue boundaries in anatomical images are manifested as DUs. DUs may be influenced by many factors, such as limited image quality of employed imaging modalities, interobserver delineation uncertainties (different clinical judgments of different observers), and intraobserver delineation uncertainties (different clinical judgments of the same observer in different trials). Autocontouring tools and deformable contour mapping used in adaptive therapy are also prone to DUs.3,4 Though site and application-specific, DUs may lead to significant bias of the delineated ROI from its truth and cause a non-negligible systematic offset in the true target for treatment5 and/or cause inaccurate assessment of normal tissue complication risk. While tumor DUs can be reduced by using functional imaging, anatomical imaging remains the norm, and DUs will contribute to planning uncertainties for the foreseeable future.
Many researchers have documented measurements2,6–10 of interobserver contour deviations with different imaging modalities. Weiss et al.9 showed that the average standard deviations (SDs) from average surface meshes of five repeated delineations on FBCT vs CBCT were 1.5 vs 2.1 mm for prostate, 0.7 vs 1.4 mm for bladder, and 1.3 vs 1.5 mm for rectum. Bhardwaj et al.6 found statistically significant differences in dose-volume histograms (DVHs), tumor-control probability (TCP), and normal tissue complication probability (NTCP) values for differing observer’s contours with prostate margins. An adequate accommodation of delineation uncertainties is required to achieve the anticipated treatment goal.
In current treatment planning, DUs are implicitly accommodated via the gross-tumor-volume (GTV) to clinical-target-volume (CTV) expansion. Plans in which the CTV is equal to the GTV, such as for the prostate, lack this implicit consideration. Independent of CTV expansion, DUs and their clinical impact are not explicitly considered in current plans. One might argue that the CTV to planning-target-volume (PTV) margin provides an additional route for implicit accommodation of delineation uncertainties, although this falls outside the scope of the ICRU PTV definition11,12 (e.g., ICRU 62, Table 2.1). Conceptually, one might consider DU accommodation via a margin approach, perhaps even via use of an empirical margin recipe5,13,14 such as those suggested for CTV-to-PTV or organ-at-risk-to-planning-organ-at-risk-volume (OAR-to-PRV) margin, with the understanding that parameters required for margin recipe application are known or can be measured, and that such parameters are applicable across a population. Note, margin recipes such as the van Herk margin formula15 (VHMF) intend to ensure a certain percentage of coverage on a population basis. However, such population-based margin may not adapt to patient-specific coverage probability in the presence of delineation uncertainties.16 Alternative formulas suggested for PRVs (Ref. 17) have the same limitation.
The patient-specific residual errors due to delineation uncertainties may be compensated by using coverage-based planning (CP) techniques. The coverage probability is computed by sampling the relevant geometric uncertainties, in this case alternative ROI structures. The dose distribution is optimized to achieve prespecified coverage probabilities as opposed to simply conforming to a heuristic PTV. In our lab, two CP techniques—optimized-margin planning (CPOM)18 and coverage-optimized planning (CPCOP)19 have been developed. CPOM iteratively increases PTV margins until the predefined coverage criteria are satisfied, and CPCOP directly modifies the fluence to achieve the specified coverage criteria. Our previous studies18–20 showed that both CPOM and CPCOP can spare more normal tissue dose relative to conventional PTV-based planning when (rigid-body) setup errors or organ deformable motions were accounted for. However, the application of CPOM or CPCOP to accommodate the delineation uncertainties has yet to be studied.
To use CP techniques, a mathematical model that represents possible variations of DUs is required. As “the weakest link in the search for accuracy,”16 DUs are not easily modeled. Though recent developed autocontouring tools allow fast and consistent contours between trials, the tedious and time-consuming manual contours are usually still required for validation and corrections.3 Based on a limited number of manual contours, most researchers have been narrowly focused on evaluation of boundary visualization2,9,21–23 or development of 3D analysis tools.24–26 In this study, a three-dimensional voxel-based model was developed and incorporated into CP techniques. To simulate the possible DUs for prostate cancer treatment, this model utilized the information of patient-specific image contrast and a physician’s delineation.
We studied contour delineation variations in isolation from patient positioning and organ shape variations. In clinical practice, such uncertainties would need to be considered, yet understanding DU impact in isolation provides insight into how to best clinically consider them, especially in light of the fact that image guided adaptive therapy is reducing positioning and shape error components.
Here, a DU model was incorporated in CPOM and CPCOP techniques to optimize the dose distribution for each prostate patient. The potential clinical benefit of these two CP techniques was investigated by comparing target coverage and normal tissue sparing with the conventional fixed margin-based (FM) planning.
2. METHODS
The base flow of this study is as follows: for each of the 19 patients (see Sec. 2.A), an IMRT plan using a zero PTV margin was created. The 95% coverage probabilities of D98 of both prostate and seminal vesicles were evaluated based on the dosimetric consequences of 1000 alternative ROI structure sets simulated by a patient-specific DU model (see Sec. 2.C), which considers interobserver contouring difference and CT image quality. This established the need to consider DUs during treatment planning. To achieve the desired coverage probabilities, treatment plans were created using three different techniques: FM, CPOM, and CPCOP (see Sec. 2.B.2). Then, these plans were compared with each other to determine which technique can best accommodate contouring variability (see Sec. 2.D.2). The plan comparison was based on the probability of achieving the desired dose-volume metrics and the probability for complication-free control (P +). Each aspect is described in further detail below.
2.A. Prostate plans
A 19 patient cohort obtained from Netherlands Cancer Institute (NKI) was involved in this study. There were 8–13 fan-beam CT images for each patient and the image resolution was 0.094 × 0.094 × 3 mm3. More details of this patient cohort have been described in earlier published work.20,27,28 A single physician at VCU contoured the structures of prostate (CTVprostate), seminal vesicles (CTVSV), rectum, bladder, left femur, and right femur on each image. Contours of CTVSV, rectum, and bladder were modified slightly to eliminate overlapping region with CTVprostate or with other structures.
For each patient, the first CT was selected as the reference image for IMRT treatment planning to prescribe 78 Gy to CTVprostate and 66 Gy to CTVSV in 30 fractions. As we are studying delineation uncertainty in isolation, the other image sets were not utilized in this study. Seven coplanar (transverse) photon beams with gantry angles 30°, 80°, 130°, 180°, 230°, 280°, 330° were utilized with the beam isocenter at the prostate centroid. The in-house IMRT criteria used for CPOM, CPCOP, and FM were the same as a recent published work.20 For the CP techniques, the coverage probability objectives34 were CTVprostate D98,95 ≥ 78 Gy, D2,5 ≤ 81 Gy, CTVSV D98,95 ≥ 66 Gy, bladder D70,5 ≤ 18 Gy, D50,5 ≤ 36 Gy, D30,5 ≤ 57 Gy, D20,5 ≤ 66 Gy, D14,5 ≤ 69 Gy, D9,5 ≤ 75 Gy, D2,5 ≤ 81 Gy, and rectum D50,5 ≤ 36 Gy, D30,5 ≤ 51 Gy, D20,5 ≤ 66 Gy, D5,5 ≤ 69 Gy, D2,5 ≤ 75 Gy. To achieve the static dose–volume criteria (used for FM or CPOM) for 95% of the alternative structure sets simulated, q = 95% and q = 5% coverage values were selected for minimum (target) or maximum (OAR) percentile DVH (pDVH) criteria used for CPCOP.35 All of the optimizations were performed using direct machine parameter optimization (DMPO) in the pinnacle 3 (research version 9.100) TPS (Philips Medical Systems, Fitchburg, WI). The optimizer was run for maximal 50 iterations and dose grid resolution was 2 × 2 × 2 mm3 for both evaluation and optimization.
2.B. Coverage evaluation and coverage-based optimization
2.B.1. Coverage evaluation—pDVH
Coverage probability for each potential treatment plan was evaluated by mimicking dose delivery for 1000 alternative ROI structure sets. Each alternative structure of each set was independently sampled from the DU model, yielding different dose evaluations for each ROI. The 1000 alternative DVHs per ROI rendered a distribution from which the likelihood of achieving the specified dose-volume metric was determined.
From the DVH distribution, a percentile DVH at a specific coverage probability q was constructed by finding the line with equal coverage probability as a function of dose. Readers are referred to the previous19,20 work for details. The pDVHs were used in not only plan evaluation to estimate the chance that dose volume criteria may be met, but also in the CPCOP dose optimization to drive the pDVHs toward the desired coverage metrics.
2.B.2. Planning techniques: FM, CPCOP, and CPOM
FM is a basic PTV-based IMRT planning technique using empirically predefined PTV margins. Here, the fixed PTV margins utilized by FM for all the patients in RL, PA, and SI were 4, 5, and 6 mm for CTVprostate and 4, 5, and 7 mm for CTVSV. The margins M were calculated according to the VHMF—M = 2.5Σ, where Σ refers to the SD values (Table I) of systematic error as a result of contouring variability.
TABLE I.
SD values in mm of in RL(x), PA(y), and SI(z) directions used in ASSD model for ROIs of prostate cancer patients.
CPCOP optimized the beam fluence and dose with probabilistic dose-volume criteria obtained from pDVHs. CPCOP included all the voxels that covered the dynamic ROI as sampled from the DU model for the different alternative structures, and weighted these voxels according to their potential contribution to the ROI dose. Then, the ROI dose was optimized based on Newton’s method and minimizing the sum of a series of pDVH objectives [e.g., like Xu et al.20 but with the DU model (see Sec. 2.C) used in the pDVH computation as opposed to the PCA organ deformation model]. The probabilistic dose volume metrics included D98,95 for CTV structures and D2,5 for bladder and rectum drove plan optimization to maximally achieve 95% coverage probability for target D98 and 5% coverage probability for OAR D2 criteria. The details on the CPCOP algorithm can be found in our previous work.19,20 As in our prior work, dose shift invariance28 was assumed to reduce required computations during the CPCOP optimization.
CPOM utilizes the method developed by Gordon and Siebers,18 starting with the IMRT plan using 0 PTV margins for CTVprostate and CTVSV and same dose-volume objectives as those used in FM technique. PTV margin adequacy is judged by the 1000 alternative ROI set coverage evaluation. When the evaluation showed insufficient coverage, the size of PTV margin was iteratively expanded uniformly by a 1 mm increment until the margin was sufficient such that the prescribed D98,95 for both CTVs is achieved.
2.C. Delineation uncertainties model—average-surface-of-standard-deviation (ASSD)
Coverage probability evaluations require a DU model. Creation of such a model poses practical challenges. One might create such a model by having multiple observers contour patient image sets multiple times, then use the resultant contour sets as input to a model to determine a mean contour with some variance. Besides being resource intensive, such a model might poorly represent uncertainties as those contouring may have similar training and bias.
To execute this study, we created an ASSD model which estimates the patient-specific DUs to determine the alternative ROI structures relative to the delineated contours. In other words, DUs for a ROI were quantified by the deviation between the physician contoured volume and alternative possible volumes. The contoured to alternative ROI variation was incorporated as a deformation, contraction, or expansion, corresponding to the delineator who delineated in a conservative versus liberal manner. The ASSD model assumed that image contrast perception was the source of contouring delineation variations, with the deformation being a function of image contrast in voxels adjacent to the contoured surface. The model seems reasonable for contouring prostate, seminal vesicles, bladder, and rectum in pelvis, based on the work from Baudry et al.29
In the ASSD model, for each ROI voxel, the magnitude of the DUs was scaled by a voxel-specific delineated-to-alternative-location displacement vector as
| (1) |
where Dx, Dy, Dz are x [= right–left (RL)], y [= posterior–anterior (PA)], and z [= superior–inferior (SI)] components of . With r representing (x,y,z), (Dr)i,k is the DUs’ component of the ROI voxel i for alternative ROI structure with index k. (Dr)i,k is written as
| (2) |
where (FSD)r,k is a variable representing the base contouring uncertainty and (FCT)r,i is an individualized factor determined by the CT image intensity gradient on the location at voxel i. (FSD)r,k is assumed to vary with the different alternative structure as
| (3) |
where norminv() is an inverse standard normal cumulative density function and (pRand)k is a random probability sampled from a uniform distribution with range from 0 to 1 for the alternative structure k. 0 and SDr are the Gaussian mean and the SD in r direction. The mean of the Gaussian distribution was zero because the average of the delineated ROI surface is assumed the best available estimate of the true ROI surfaces. The SD values of the Gaussian distribution RL(x), PA(y), and SI(z) are determined empirically based on the literature in Table I.
(FCT)r,i is a function of CT image intensity gradient for voxel i. The expression of (FCT)r,i depended on voxel location. If voxel i is on the surface of ROI, (FCT)r,i in the r direction is written as
| (4) |
where (gradCT)r,i is the CT number gradient of voxel i in r direction, | ⋅ | denotes its absolute value, and a is a constant gradient use to normalize the maximum (FCT)r,i to 1. For extremely poor contrast with zero |(gradCT)r,i|, (FCT)r,i = 1. For ideal image contrast with sharp gradient , (FCT)r,i = 0. If a is too small, e.g., 1, FCT will be only sensitive to very low gradient, e.g., up to only 20 HU/mm, while in fact, the delineator’s eyes may not catch the difference within this low range of gradient very well. If a is too large such as 10 000, the FCT may not change with most gradients of interest since they are negligible to a. Here, a = 50 was selected as a reasonable base gradient. The constant a was selected such that it fell in a range where a did not affect the sensitivity of (FCT)r,i to various |(gradCT)r,i|.
The voxel-specific (gradCT)r,i is obtained from equation
| (5) |
where (gradCT)r,i is the ratio of CT number difference and position difference of two neighboring voxels in positive(+) r and negative(−) r sides of voxel i. is equivalent to two times the voxel size in the r direction. Analysis of our patient data, we find that in the rectum-CTVprostate boundary region, the (gradCT)r,i ranges from 0 to higher than 500 HU/mm, with average about 90, 90, 40 HU/mm in x, y, z directions.
When voxel i is an interior ROI voxel, its (FCT)r,i is interpolated from its two nearest surface voxels, denoted as i_surf + and i_surf −, in the positive and the negative r directions,
| (6) |
An illustration of FCT-dependent vectors (with FSD vectors of magnitude of one in an expansion direction) on a transverse slice of a rectum is shown in Fig. 1. Lower gradient (= poor image contrast) is associated with a larger DU displacement vector.
FIG. 1.

CT image slice in transverse plane for rectum (solid-line contour) and corresponding (Dr)i,k = (FSD)r,k ⋅ (FCT)r,i with |(FSD)r,k| = 1 for display purposes.
2.D. Treatment planning decision flow
A treatment planning decision flow was designed to (1) validate that an uncertainty compensation strategy (e.g., FM, CPOM, or CPCOP) was needed to accommodate the dosimetric variability caused by contour DUs and (2) address which plan was the most preferred among the FM, CPOM, and CPCOP plans.
2.D.1. Zero margin evaluation
To determine the dosimetric effect of ASSD-modeled DUs, a zero-PTV-margin IMRT plan with PTV 1 = CTVprostate and PTV 2 = CTVSV was evaluated in terms of D98,95 for both CTV structures via the alternative ROI simulations. Denote D98,95,Rx as the prescribed dose (78 Gy for CTVprostate and 66 Gy for CTVSV). If the inherent dosimetric-margin30 of the treatment plan exceeds the ASSD-modeled CTV variability for both CTVprostate and CTVSV, then D98,95 ≥ D98,95,Rx, the optimal margin would be zero, and a contour uncertainty compensation strategy would not be needed. In addition to coverage probabilities, two additional quantities were computed for the CTVs of all the zero-PTV plans. One was the percentage dose degradation %ΔD98,95, which was the percentage difference of D98,95 relative to D98,95,Rx when D98,95 < D98,95,Rx or 0 when D98,95 ≥ D98,95,Rx. The other was the percentage DVH variability %ΔDV H98,5–95, the percentage difference between D98,95 and D98,5. This quantity indicates the spread of DVHs obtained from different alternative ROI structures.
2.D.2. FM vs CPOM vs CPCOP
FM, CPOM, and CPCOP plans were created and compared to each other to determine which planning technique was most preferred. The primary criteria of the most preferred plan were the target coverage probabilities corresponding to the optimization objectives, i.e., CTVprostate D98,95 ≥ 78 Gy, CTVSV D98,95 ≥ 66 Gy. Considering the uncertainty of coverage calculation (see Sec. 4), an optimized dose slightly lower than coverage objective is regarded as acceptable (within 1%). For each final plan for each method, the P + (probability of complication free control) value representing TCP/NTCP distributions of the 1000 virtual treatment courses was examined for a secondary comparison. The equations and parameters to calculate P+ can be found in Xu et al.20
3. RESULTS
3.A. Zero margin evaluation
As Fig. 2 illustrates, the inherent dosimetric margin was insufficient to yield acceptable coverage probability for all of the zero-PTV-margin IMRT plans, although it did yield sufficient dose spillage to ensure CTVSV coverage for three patients (ID 6–8). The dose degradation %ΔD98,95 due to DUs ranged from 3.2% to 12.2% for CTVprostate and from 0% to 12.9% for CTVSV. The resulting %ΔDV H98,5–95 was 2.9%–13.6% for CTVprostate and 3.8%–13.8% for CTVSV.
FIG. 2.

(a) Percentage degraded dose (%ΔD98,95) and (b) DVH variability (%ΔDV H98,5–95) at prescribed dose of CTVprostate (black bins) and CTVSV (upward diagonal bins) for 19 zero-PTV-margin plans with delineation uncertainties considered using the ASSD model.
3.B. FM vs CPOM vs CPCOP
For each of the 19 patients, FM, CPCOP, and CPOM plans were created. The resultant patient-specific uniform margins from CPOM are listed in Table II. The optimized PTV margin for the target structures varies with patient: 2–5 mm for CTVprostate and 0–4 mm for CTVSV.
TABLE II.
The optimized PTV margins of CTVprostate (P) and CTVSV (S) obtained by CPOM technique for 19 prostate cancer patients. The margins are quite different from the fixed PTV margins used in FM technique, which are 4 mm (RL), 5 mm (PA), 6 mm (SI) for CTVprostate and 4 mm (RL), 5 mm (PA), 7 mm (SI) for CTVSV.
| Patient ID | COPOM PTV (mm) |
|---|---|
| 1 | P : 3 S : 2 |
| 2 | P : 5 S : 2 |
| 3 | P : 4 S : 3 |
| 4 | P : 3 S : 2 |
| 5 | P : 3 S : 2 |
| 6 | P : 2 S : 2 |
| 7 | P : 3 S : 0 |
| 8 | P : 3 S : 2 |
| 9 | P : 5 S : 2 |
| 10 | P : 5 S : 2 |
| 11 | P : 3 S : 3 |
| 12 | P : 5 S : 2 |
| 13 | P : 5 S : 2 |
| 14 | P : 3 S : 2 |
| 15 | P : 4 S : 3 |
| 16 | P : 3 S : 2 |
| 17 | P : 3 S : 2 |
| 18 | P : 5 S : 4 |
| 19 | P : 2 S : 2 |
The comparison results of CPCOP, CPOM, and FM plans in terms of their target coverage probabilities and P + values are summarized in Table III. CPCOP plans were preferred for 11/19 cases, followed by CPOM (7/19) and FM (1/19). Preference was mainly based on improved P + indicating superior normal tissue sparing.
TABLE III.
Patient ID, best planning technique and its gain relative to the other two plans in terms of target dose coverage (D98,95), and probability of complication free control P +.
| ID | Best plan | Gain relative to the other plans | |
|---|---|---|---|
| 1 | CPOM | CPCOP (+10.0%P +) | FM (+6.4%P +) |
| 2 | CPCOP | CPOM (+17.5%P +) | FM (+16.5%P +) |
| 3 | CPCOP | CPOM (+4.8%P +) | FM (+9.2%P +) |
| 4a | CPOM | CPCOP (+3.5%CTVprostateD98,95) | FM (+6.9%P +) |
| 5 | CPOM | CPCOP (+1.0%P +) | FM (+7.1%P +) |
| 6 | CPOM | CPCOP (+2.4%P +) | FM (+22.0%P +) |
| 7a | CPOM | CPCOP (+2.5%CTVSVD98,95) | FM (+10.8%P +) |
| 8 | CPCOP | CPOM (+6.5%P +) | FM (+12.6%P +) |
| 9 | CPCOP | CPOM (+15.1%P +) | FM (+15.1%P +) |
| 10 | CPCOP | CPOM (+14.2%P +) | FM (+16.2%P +) |
| 11 | CPOM | CPCOP (+4.6%P +) | FM (+7.9%P +) |
| 12 | CPCOP | CPOM (+9.0%P +) | FM (+7.0%P +) |
| 13 | CPCOP | CPOM (+13.4P +) | FM (+14.4%P +) |
| 14 | CPCOP | CPOM (+5.0P +) | FM (+16.1%P +) |
| 15 | CPCOP | CPOM (+5.7%P +) | FM (+8.6%P +) |
| 16 | CPCOP | CPOM (+7.0%P +) | FM (+16.4%P +) |
| 17 | CPOM | CPCOP (+0.2%P +) | FM (+10.4%P +) |
| 18a | FM | CPCOP (+2.4%CTVprostateD98,95) | CPOM (+4.7%P +) |
| 19 | CPCOP | CPOM (+4.6%P +) | FM (+10.3%P +) |
COP plan that fails to achieve target D98,95.
Comparing to only the FM plans, CP plans were preferred plans because of the P+ gain, which ranged from 6.4% to 22.0%. This indicated that the PTV margins used in FM were oversized. By shaving the redundant margin using coverage-based objectives, CP plans in most cases successfully reduced the OAR dose while maintaining the desirable target coverage. The only exceptions were 3/19 plans (patient IDs 4, 7, and 18) which failed to achieve CTVprostate or CTVSV coverage objective. The resultant D98,95 was up to 3.5% lower than the objective dose. CPCOP’s coverage failure is due to the fact that this method alone considered the OAR coverage probabilities in the objective function. The objective-weighted resultant plan sacrificed target coverage in favor of normal tissue sparing. The CTV coverage objectives could be met by increasing their relative weight in the cumulative objective function. In direct comparisons between CPCOP and CPOM, CPCOP reduced the OAR dose(s) further as a result of balancing the weighted OAR objectives. The average P+ gain for the 11 preferred CPCOP plans was 9.3%. This gain was larger than that from CPOM plans; the average P + improvement for the seven preferred CPOM plans was 3.4%. Though less beneficial in normal tissue sparing, CPOM plans guaranteed target coverage since achieving coverage indicated PTV margin sufficiency. In general, the relative advantages between three plans were patient-specific for the 19 patients.
4. DISCUSSION
The evaluation or optimization of treatment planning should include the information of the coverage probability of achieving isodose coverage in the presence of geometric uncertainties. By using a CP technique, a patient treatment plan can be quality-assured with respect to the plan’s robustness to geometric uncertainties and altered so that the desired target coverage is achieved while sparing adjacent normal tissue sparing.
This work proposed CP techniques for treatment planning evaluation and optimization to account for DUs for prostate cancer patients. The dosimetric influence of the geometric uncertainties other than DUs is beyond the scope of this paper. With the advancement of immobilization methods and IGRT techniques, the geometric uncertainties other than DUs (such as setup uncertainties and interfraction organ motions) should continue to decrease, leaving the contour delineation as an increasingly important uncertainty source. This work addressed the question as to what can be done to savvily account for DUs in the foreseeable scenario that other geometric uncertainties are well compensated.
This work utilized a new ASSD model to account for DUs. To overcome the lack of sufficient repeatedly delineated contours, the quasitrue ROI contour was assumed to follow population-based Gaussian distribution near the delineated contour. The Gaussian distribution utilized parameters from published papers on contouring difference by other researchers5,7,9,22,27 where statistics were more representative than could be obtained by the limited repeatedly delineated contours. Similar to a study which evaluated the delineation accuracy (particularly for small and low contrast lesions) under the influence of imaging quality from using different CT scanners,31 our ASSD model assumed that the DUs of each voxel were associated with the CT image contrast. The CT gradient near the voxel was calculated to scale the magnitude of DUs. Larger CT gradient (and equivalently better image contrast) rendered smaller deviation from the delineated to the true anatomies.16 In the future, this model could be further refined by using, e.g., three-dimensional-orientation-dependent SD for Gaussian-based interobserver contour differences.
Inherent limitations of our methods include (a) the assumption that the quasitrue ROI contour represents the true, or more appropriately mean ROI from multiple contours and (b) validity of the ASSD model. Assumption (a) is justified by the fact that we have no other method to estimate the true ROI; therefore, we apply the common technique of using the available measurement as the best estimate of the mean. With respect to the validity of the ASSD model, the ASSD only needs to follow the trend of contour variability for our conclusions to be useful. Specifically, if ASSD underestimates true DUs, the dosimetric influence of DUs is larger (and more significant) than what we report. On the other hand, if ASSD overestimates DUs, the clinical benefit of CP technique relative to FM techniques in terms of normal tissue sparing will be more pronounced, as a result of the oversized margin used in FM. Regardless, the ASSD model has its value in allowing an initial study on DUs and the advanced planning technique to accommodate them.
In isolation, the dosimetric impact of DUs based on the ASSD model is non-negligible and degrades the patient treatment plan. While we have not evaluated the contribution of contouring uncertainties in relation to other geometric uncertainties and their compensation strategies, we acknowledge that it is reasonable to assume that some level of protection may come from the margins for other geometric uncertainties. However, as other geometric uncertainties are reduced, the fractional contribution from contouring DUs will increase, therefore, requiring more attention during the treatment planning process. For example, assume that DUs, deformable organ motions, and setup uncertainties are independent and their effects can be added in quadrature. If the margin from the VHMF, applied for setup-errors with standard deviations σ = 2 mm (random) and ∑ = 2 mm (systematic), combines in quadrature with an OM = 4 mm for the possible organ deformations,20 and OM = 4 mm for contouring DUs, the combined margin increases only from 8 to 9 mm. If, however, setup error σ = 1 mm and ∑ = 1 mm and deformable organ motion OM = 2 mm, the margin increases by more than 40% from 3.8 to 5.4 mm to accommodate DUs. Our future work is to study the dosimetric consequences of all the geometric uncertainties—setup uncertainties, organ motion and deformation, and delineation uncertainties.
From Table III, CP techniques turned out to be beneficial in adapting DUs to patient-specific coverage probabilities for high-risk prostate cancer treatment. The VHMF-based PTV margins used in FM, in contrast, were often much larger then needed on per patient basis. The inadequacy of VHMF-based PTV margins has also been reported for other geometric uncertainties (e.g., setup uncertainties18,32,33 and deformable interfraction motions20).
The relative advantages between CPCOP, CPOM, and FM were patient-specific. The characteristics of different dose distributions of these three plans for one patient are illustrated in Fig. 3. For the CPCOP plan, the dosimetric margin between CTVprostate and the 78 Gy treated volume (TV) was smallest in the region of bladder due to the competing target and OAR objectives. CPOM had less burden of OAR sparing and the optimized PTV can be continuously enlarged when it is needed to boost the current prescribed target coverage.
FIG. 3.
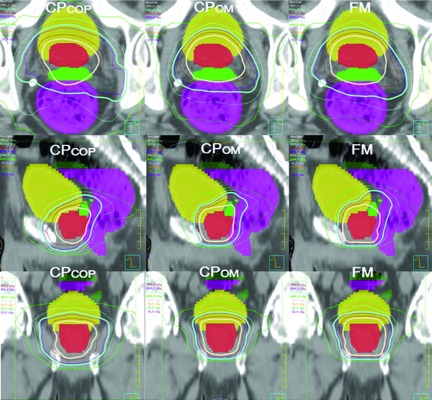
Axial, sagittal, and coronal dose distributions of CPCOP versus CPOM versus FM plans on one slice for patient 8 when delineation uncertainties are considered. The thick isodose surfaces are the 78 Gy (seashell) TV for the CTVprostate (red colorwash) and the 66 Gy (aquamarine) TV for CTVSV (green colorwash). The yellow and magenta colorwashs are the bladder and rectum. The thin isodose surfaces are 75 Gy (maroon), 69 Gy (slateblue), 57 Gy (lightblue), and 40 Gy (green). Compared to CPOM and FM plans, the CPCOP dosimetric margin (the distance between the CTVprostate and the 78 Gy TV) on the sides of bladder and rectum is, in general, smaller due to CPCOP’s inclusion of OAR uncertainties in the objective function. This explains why a CPCOP plan is more likely to have better normal tissue sparing and sometimes lower target coverage.
Since the initial planning objectives were based on a FM clinical standard, alternative CP optimization objectives and weights may show more potential clinical benefit. The complexity of the plan segments needed for delivery of FM, CPCOP, or CPOM plan has been reviewed by comparing the fractional monitor units of each plan (Table IV). A larger number indicates an increased complexity (number monitor units and/or segments) needed for delivery. In most cases, CPOM plan was least complex among the three, while CPCOP and FM plans were comparable for most of the patients.
TABLE IV.
The monitor units (MUs) per fraction for CPCOP plans and percentage deviation from CPCOP for the CPOM and FM plans. Summary statistics indicate that averaged over all patients, the intermethod MUs are well one standard deviation.
| ID | CPCOP | CPOM (%) | FM (%) |
|---|---|---|---|
| 1 | 572 | −28 | −22 |
| 2 | 662 | −21 | −17 |
| 3 | 601 | −7 | 5 |
| 4 | 552 | −14 | −9 |
| 5 | 589 | −22 | −15 |
| 6 | 442 | −14 | 4 |
| 7 | 401 | −4 | 3 |
| 8 | 400 | −6 | 5 |
| 9 | 477 | −6 | −4 |
| 10 | 498 | −3 | 1 |
| 11 | 544 | −4 | 10 |
| 12 | 559 | −4 | −9 |
| 13 | 601 | −19 | −17 |
| 14 | 461 | −4 | 10 |
| 15 | 441 | 0 | 2 |
| 16 | 451 | −4 | −2 |
| 17 | 600 | −16 | −4 |
| 18 | 567 | −5 | −4 |
| 19 | 417 | −3 | 4 |
| Avg. ± SD(MU) | 518 ± 80 | 464 ± 57 | 497 ± 61 |
This coverage probability estimation based on simulating 1000 alternative ROI structures was assumed to be sufficient. To test this assumption, tests were performed on two arbitrarily selected patients. The accuracy was checked by calculating ΔDv,q, the absolute percentage difference of dose volume metric Dv corresponding coverage probability q using 10, 100, 200, and 500 alternative ROI structures to see how q converges relative to that using 1000 courses. For CTVprostate and CTVSV, ΔD98,95 decreased to 0.2% as the number of alternative structures increases from 10 to 500. For the bladder and rectum, the absolute percentage dose difference was mostly below 0.5%. The precision was tested by reproducing each Dv,q based on 1000 alternative ROI sets for 7–10 times. The maximum absolute percentage difference among all the repeated estimated values was 0.3% and 0.2% for CTVprostate and CTVSV, respectively, and less than 1% for the OARs. These test cases supported that coverage estimation using 1000 alternative structures was adequate.
5. CONCLUSION
To ensure desirable target coverage and normal tissue sparing, the dosimetric variations of delineation uncertainties should be considered in treatment planning for the high-risk prostate patients treated by external beam radiation therapy. An ASSD model to simulate delineation uncertainties gave a quantitative evaluation of the plan quality. With this model incorporated, CPCOP or CPOM techniques resulted in either better target dose coverage probability or lower normal tissue doses than the FM technique that uses empirical fixed PTV margins, thereby providing a theoretical benefit in terms of complication free control.
ACKNOWLEDGMENTS
This work is supported in part by NIH Grant No. P01CA116602 and by a research contract with Philips Medical Systems. The authors thank the Netherlands Cancer Institute for providing the image sets, Ford Sleeman and Dr. Mirek Fatyga for the initial processing of the image sets, and Dr. Elizabeth Weiss for contouring the image sets.
REFERENCES
- 1.Njeh C. F., Dong L., and Orton C. G., “IGRT has limited clinical value due to lack of accurate tumor delineation,” Med. Phys. 40, 040601(4pp.) (2013). 10.1118/1.4789492 [DOI] [PubMed] [Google Scholar]
- 2.Weiss E. and Hess C. F., “The impact of gross tumor volume (GTV) and clinical target volume (CTV) definition on the total accuracy in radiotherapy theoretical aspects and practical experiences,” Strahlenther. Onkol. 179, 21–30 (2003). 10.1007/s00066-003-0976-5 [DOI] [PubMed] [Google Scholar]
- 3.Huyskens D. P., Maingon P., Vanuytsel L., Remouchamps V., Roques T., Dubray B., Haas B., Kunz P., Coradi T., Bühlman R., Reddick R., Esch A. V., and Salamon E., “A qualitative and a quantitative analysis of an auto-segmentation module for prostate cancer,” Radiother. Oncol. 90, 337–345 (2009). 10.1016/j.radonc.2008.08.007 [DOI] [PubMed] [Google Scholar]
- 4.Gu X., Dong B., Wang J., Yordy J., Mell L., Jia X., and Jiang S. B., “A contour-guided deformable image registration algorithm for adaptive radiotherapy,” Phys. Med. Biol. 58, 1889–1901 (2013). 10.1088/0031-9155/58/6/1889 [DOI] [PMC free article] [PubMed] [Google Scholar]
- 5.van Herk M., “Errors and margins in radiotherapy,” Semin. Radiat. Oncol. 14, 52–64 (2004). 10.1053/j.semradonc.2003.10.003 [DOI] [PubMed] [Google Scholar]
- 6.Bhardwaj A. K., Kehwar T. S., Chakarvarti S. K., Sastri G. J., Oinam A. S., Pradeep G., Kumar V., Indranil M., and Sharma S. C., “Variations in inter-observer contouring and its impact on dosimetric and radiobiological parameters for intensity-modulated radiotherapy planning in treatment of localised prostate cancer,” J. Radiother. Pract. 7, 77–88 (2008). 10.1017/s1460396908006316 [DOI] [Google Scholar]
- 7.Fiorino C., Reni M., Bolognesi A., Cattaneo G. M., and Calandrino R., “Intra- and inter-observer variability in contouring prostate and seminal vesicles: Implications for conformal treatment planning,” Radiother. Oncol. 47, 285–292 (1998). 10.1016/S0167-8140(98)00021-8 [DOI] [PubMed] [Google Scholar]
- 8.Petric P., Dimopoulos J., Kirisits C., Berger D., Hudej R., and Pötter R., “Inter- and intraobserver variation in HR-CTV contouring: Intercomparison of transverse and paratransverse image orientation in 3D-MRI assisted cervix cancer brachytherapy,” Radiother. Oncol. 89, 164–171 (2008). 10.1016/j.radonc.2008.07.030 [DOI] [PubMed] [Google Scholar]
- 9.Weiss E., Wu J., Sleeman W., Bryant J., Mitra P., Myers M., Ivanova T., Mukhopadhyay N., Ramakrishnan V., Murphy M., and Williamson J., “Clinical evaluation of soft tissue organ boundary visualization on cone-beam computed tomographic imaging,” Int. J. Radiat. Oncol., Biol., Phys. 78, 929–936 (2010). 10.1016/j.ijrobp.2010.02.007 [DOI] [PMC free article] [PubMed] [Google Scholar]
- 10.Vorwerk H., Beckmann G., Bremer M., Degen M., Dietl B., Fietkau R., Gsänger T., Hermann R. M., Alfred Herrmann M. K., Höller U., van Kampen M., Körber W., Maier B., Martin T., Metz M., Richter R., Siekmeyer B., Steder M., Wagner D., Hess C. F., Weiss E., and Christiansen H., “The delineation of target volumes for radiotherapy of lung cancer patients,” Radiother. Oncol. 91, 455–460 (2009). 10.1016/j.radonc.2009.03.014 [DOI] [PubMed] [Google Scholar]
- 11.ICRU, “Prescribing, recording and reporting photon beam therapy,” ICRU Report 50 (ICRU Publications, Bethesda, MD, 1994). [Google Scholar]
- 12.ICRU, “Prescribing, recording and reporting photon beam therapy (Supplement to ICRU Report 50),” ICRU Report 62 (ICRU Publications, Bethesda, MD, 2000). [Google Scholar]
- 13.Stroom J. C., Koper P. C., Korevaar G. A., van Os M., Janssen M., de Boer H. C., Levendag P. C., and Heijmen B. J., “Internal organ motion in prostate cancer patients treated in prone and supine treatment position,” Radiother. Oncol. 51, 237–248 (1999). 10.1016/S0167-8140(99)00061-4 [DOI] [PubMed] [Google Scholar]
- 14.Stroom J. and Heijmen B., “Limitations of the planning organ at risk volume (PRV) concept,” Int. J. Radiat. Oncol., Biol., Phys. 66, 279–286 (2006). 10.1016/j.ijrobp.2006.05.009 [DOI] [PubMed] [Google Scholar]
- 15.van Herk M., Remeijer P., Rasch C., and Lebesque J. V., “The probability of correct target dosage: Dose-population histograms for deriving treatment margins in radiotherapy,” Int. J. Radiat. Oncol., Biol., Phys. 47, 1121–1135 (2000). 10.1016/S0360-3016(00)00518-6 [DOI] [PubMed] [Google Scholar]
- 16.Njeh C., “Tumor delineation: The weakest link in the search for accuracy in radiotherapy,” J. Med. Phys. 33, 136–140 (2008). 10.4103/0971-6203.44472 [DOI] [PMC free article] [PubMed] [Google Scholar]
- 17.McKenzie A., van Herk M., and Mijnheer B., “Margins for geometric uncertainty around organs at risk in radiotherapy,” Radiother. Oncol. 62, 299–307 (2002). 10.1016/S0167-8140(02)00015-4 [DOI] [PubMed] [Google Scholar]
- 18.Gordon J. J. and Siebers J. V., “Coverage-based treatment planning: Optimizing the IMRT PTV to meet a CTV coverage criterion,” Med. Phys. 36, 961–973 (2009). 10.1118/1.3075772 [DOI] [PMC free article] [PubMed] [Google Scholar]
- 19.Gordon J. J., Sayah N., Weiss E., and Siebers J. V., “Coverage optimized planning: Probabilistic treatment planning based on dose coverage histogram criteria,” Med. Phys. 37, 550–563 (2010). 10.1118/1.3273063 [DOI] [PMC free article] [PubMed] [Google Scholar]
- 20.Xu H., Vile D. J., Sharma M., Gordon J. J., and Siebers J. V., “Coverage-based treatment planning to accommodate deformable organ variations in prostate cancer treatment,” Med. Phys. 41, 101705 (14pp.) (2014). 10.1118/1.4894701 [DOI] [PMC free article] [PubMed] [Google Scholar]
- 21.Zhou S. M., Bentel G. C., Lee C. G., and Anscher M. S., “Differences in gross target volumes on contrast vs. noncontrast CT scans utilized for conformal radiation therapy treatment planning for prostate carcinoma,” Int. J. Radiat. Oncol., Biol., Phys. 42, 73–78 (1998). 10.1016/S0360-3016(98)00190-4 [DOI] [PubMed] [Google Scholar]
- 22.Rasch C., Barillot I., Remeijer P., Touw A., van Herk M., and Lebesque J. V., “Definition of the prostate in CT and MRI: A multi-observer study,” Int. J. Radiat. Oncol., Biol., Phys. 43, 57–66 (1999). 10.1016/S0360-3016(98)00351-4 [DOI] [PubMed] [Google Scholar]
- 23.Gao Z., Wilkins D., Eapen L., Morash C., Wassef Y., and Gerig L., “A study of prostate delineation referenced against a gold standard created from the visible human data,” Radiother. Oncol. 85, 239–246 (2007). 10.1016/j.radonc.2007.08.001 [DOI] [PubMed] [Google Scholar]
- 24.Remeijer P., Rasch C., Lebesque J. V., and van Herk M., “A general methodology for three-dimensional analysis of variation in target volume delineation,” Med. Phys. 26, 931–940 (1999). 10.1118/1.598485 [DOI] [PubMed] [Google Scholar]
- 25.Korporaal J. G., van den Berg C. A. T., Groenendaal G., Moman M. R., van Vulpen M., and van der Heide U. A., “The use of probability maps to deal with the uncertainties in prostate cancer delineation,” Radiother. Oncol. 94, 168–172 (2010). 10.1016/j.radonc.2009.12.023 [DOI] [PubMed] [Google Scholar]
- 26.Wu J., Murphy M. J., Weiss E., Sleeman W. C., and Williamson J., “Development of a population-based model of surface segmentation uncertainties for uncertainty-weighted deformable image registrations,” Med. Phys. 37, 607–614 (2010). 10.1118/1.3284209 [DOI] [PMC free article] [PubMed] [Google Scholar]
- 27.Deurloo K. E. I., Steenbakkers R. J. H. M., Zijp L. J., de Bois J.A., Nowak P. J. C. M., Rasch C. R. N., and van Herk M., “Quantification of shape variation of prostate and seminal vesicles during external beam radiotherapy,” Int. J. Radiat. Oncol., Biol., Phys. 61, 228–238 (2005). 10.1016/j.ijrobp.2004.09.023 [DOI] [PubMed] [Google Scholar]
- 28.Sharma M., Weiss E., and Siebers J. V., “Dose deformation-invariance in adaptive prostate radiation therapy: Implication for treatment simulations,” Radiother. Oncol. 105, 207–213 (2012). 10.1016/j.radonc.2012.10.011 [DOI] [PMC free article] [PubMed] [Google Scholar]
- 29.Baudry M., Benlakhel A., and Vincent N., A Contour Extraction Method Based on Uncertainty Management and Fuzzy Modeling (2001), pp. 1461–1466, http://www.wseas.us/e-library/conferences/malta2001/papers/146.pdf.
- 30.Gordon J. J. and Siebers J. V., “Evaluation of dosimetric margins in prostate IMRT treatment plans,” Med. Phys. 35, 569–575 (2008). 10.1118/1.2826558 [DOI] [PMC free article] [PubMed] [Google Scholar]
- 31.Ho Y. W., Wong W. K. R., Yu S. K., Lam W. W., and Geng H., “Accuracy in contouring of small and low contrast lesions: Comparison between diagnostic quality computed tomography scanner and computed tomography simulation scanner-a phantom study,” Med. Dosim. 37, 401–405 (2012). 10.1016/j.meddos.2012.03.002 [DOI] [PubMed] [Google Scholar]
- 32.Gordon J. J., Crimaldi A. J., Hagan M., Moore J., and Siebers J. V., “Evaluation of clinical margins via simulation of patient setup errors in prostate IMRT treatment plans,” Med. Phys. 34, 202–214 (2007). 10.1118/1.2400842 [DOI] [PubMed] [Google Scholar]
- 33.Xu H., Gordon J. J., and Siebers J. V., “Sensitivity of postplanning target and OAR coverage estimates to dosimetric margin distribution sampling parameters,” Med. Phys. 38, 1018–1027 (2011). 10.1118/1.3544364 [DOI] [PMC free article] [PubMed] [Google Scholar]
- 34.Format DV%q with V% being the volume percentage and q being the coverage probability.
- 35.Since q is the probability that the dose is greater than or equal to the objective value, q = 5% for OARs is equivalent to q′ = 95%, where q′ is the confidence that the dose is less than or equal to the objective value.