

Abstract
The main objective of this study was to characterize the N-linked glycosylation profiles of recombinant hemagglutinin (HA) proteins expressed in either insect or plant hosts, and to develop a MS-based workflow that can be used in quality control to assess batch-to-batch reproducibility for recombinant HA glycosylation. HA is a surface glycoprotein of the influenza virus that plays a key role in viral infectivity and pathogenesis. Characterization of the glycans for plant recombinant HA from the viral strain A/California/04/09 (H1N1) has not yet been reported. In this study, N-linked glycosylation patterns of the recombinant HAs from both insect and plant were characterized by precursor ion scan-driven data dependent analysis followed by high resolution MS/MS analysis of the deglycosylated tryptic peptides. Five glycosylation sites (N11, N23, N276, N287 and N481) were identified containing high mannose type of glycans in plant-expressed HAs, and complex type of glycoforms for the insect-expressed HA. More than 95% site occupancy was observed for all glycosylation sites except N11, which was 60% occupied. MRM-based quantitation analysis was developed for each glycopeptide isoform and the quantitative results indicate that the Man8GlcNAc2 is the dominant glycan for all sites in plant-expressed HAs. The relative abundance of the glycoforms at each specific glycosylation site and the relative quantitation for each glycoform among three HAs were determined. Little differences in the glycosylation profiles were detected between the two batches of plant HAs studied, but there were significant differences between the glycosylation patterns in the HAs generated in plant and insect expression hosts.
Keywords: Influenza hemagglutinin, MRM, Plant recombinant protein, Quantitative glycoforms, Site occupancy, N-linked glycosylation
1 Introduction
Glycosylation represents one of the most important post-translational modifications of proteins affecting protein function and cell activities, and it is estimated that 50% of all proteins are glycosylated [1, 2]. Carbohydrates function as energy generating molecules, as structural entities, as signaling molecules and as recognition markers for the assembly of protein complexes affecting protein folding, solubility, stability and interactions. Further emphasizing their functional importance, abnormal protein glycosylation has often been associated with diseases [3-5]. Consequently, understanding the detailed structure of glycoproteins has the potential to provide valuable insights to guide biomedical research and drug discovery.
Prokaryotic and eukaryotic cells are covered with a complex array of glycoproteins. While much of the early knowledge concerning the biology of carbohydrates and glycoproteins was generated through the study of plants, in recent years, most research in glycobiology has focused on mammalian systems particularly in the context of biomedical applications [6, 7]. Consequently, far less detail is known about plant glycosylation, although in general it has been established that while plant cells contain many of the same glycans as those found in animal cells, they also synthesize several distinct glycan classes with important roles that are unique to the plant life cycles. However, a lack of knowledge concerning the biological processes responsible for their synthesis and degradation currently limits our ability to optimize recombinant glycoprotein production in plants.
Recently an important factor that has been driving a renaissance of interest in plant glycobiology is the desire to develop plants as pharmacological factories for the production biopharmaceuticals including vaccines and therapeutic antibodies [8, 9]. Approximately one third of all approved biopharmaceuticals are glycoproteins whose activity depends on correct glycosylation [10]. There is, therefore, great interest in identifying cheap and effective heterologous expression systems for producing therapeutic glycoproteins with acceptable glycoprofiles, and plants represent a potentially attractive option with advantages of decreased cost, increased ease of delivery and scale up, and decreased risk of contamination with animal and human pathogens [8, 9]. However, the distinct differences in the glycosylation machinery between plants and mammals represent an important obstacle [11]. While the high mannose-type N-glycans that decorate plant and mammalian glycoproteins have the same structure, plant complex-type-glycans are structurally divergent. For example, β-1,3-galactose and fucose that are 1,4-linked to the terminal GlcNAc of plant N-glycans form the Lea structure, whereas a β-1,4-galactose residue is often combined with sialic acid in mammals [12]. Indeed, in Lea, core α-1,3-fucose, along with the β-1,2-xylose residues are immunogenic for most laboratory mammals and elicit glycan-specific antibodies in humans [13], limiting their efficacy in vivo as therapeutic agents. This has been one of the bottlenecks in the development of plants as pharmacological factories. To overcome these limitations there has been much interest in developing protocols to “humanize” plant derived N-glycans, and several strategies have been developed that involve inactivating the native enzymes responsible for the immunogenic glycosylation, or by expressing heterologous enzymes that can catalyze mammalian-like glycosylation [14].
HA protein is a membrane-bound glycoprotein that localizes to the influenza virus surface and plays a key role in viral infectivity and pathogenesis. As a result, HA has become a major target for subunit vaccine development [9, 15] and an insect derived commercial product is already available. However, given the advantages of plants as hosts for recombinant glycoprotein production, plant-derived HA-based influenza vaccines are being actively pursued by several groups. For example, the large-scale production of recombinant HA in plants as a subunit vaccine has recently been reported [15]. In this case, the recombinant HA was biochemically and immunologically characterized; however, no detailed characterization of its glycosylation was reported.
To evaluate the success of any strategy for generating mammalian-like glycosylation and to demonstrate the absence of immunogenic glycosylation motifs for recombinant plant proteins, it is necessary to develop methods for their complete characterization, particularly with respect to their glycosylation profiles. This represents a considerable analytical challenge for several reasons, not the least of which is that a known DNA sequence predicts only the position of potential N-glycosylation sites and gives no information as to whether a particular site is actually occupied, the degree of its occupancy, nor does it reveal the composition, structure and distribution of glycoforms present at each site. There is also no consensus sequence or motif available concerning the position or nature of any O-glycosylation. Such information can only be obtained by experimentation.
Structural elucidation of glycans has historically been difficult as they are typically highly heterogeneous and chemically complex, with different absolute configurations and numerous isoforms. Unlike many other biopolymers, glycans can be branched and contain a wide variety of different glycan linkages [16]. Additionally, the hydrophilic nature of glycans has often caused reproducibility issues associated with poor retention by reverse phase (RP)-chromatography and variable mass spectrometry (MS) signal response among samples.
MS has emerged as the preeminent tool for the identification and characterization of glycoproteins and glycopeptides. The development of new hybrid instruments incorporating high mass accuracy and resolution, improved sensitivity and rapid scanning capabilities has allowed detailed glycoprotein structural characterization, with accurate empirical information concerning the position and degree of occupancy of the glycosylation sites (both N- and O-linked), as well as the composition, structure and distribution of glycoforms. Currently, most quantitative MS strategies involve either a labeling approach or label-free analysis [17]. Targeted proteomics allows the use of information obtained through the initial characterization to develop specific selected (multiple) reaction monitoring (SRM/MRM) transitions for verification and quantitation of selected peptides in complex samples. MRM is a well-established LC-MS/MS method from the field of small-molecule quantitation that has been recently adapted to proteomics [18-21] and glycoproteomics [4, 22] by many groups. In MRM assays, sequential selection of a target peptide precursor ion occurs in the Q1 mass analyzer while monitoring a characteristic fragment ion in the Q3 mass analyzer after fragmentation in the Q2 collision cell. The specific transitions from precursor to fragment ions for individual peptides are targeted, monitored and recorded as a function of LC elution time, providing the most selective, sensitive and reliable approach for quantitative analysis through integration of chromatographic peaks.
The aim of this current study was to develop a MS-based workflow for glycosylation profiling of recombinant HAs, with particular focus on those synthesized in plants, in order to assess potential batch-to-batch variation in site occupancy and heterogeneity among glycoforms. Here we describe a workflow for complete characterization of the glycosylation state of a humanized recombinant HA glycoprotein produced in a plant. This analytical pipeline incorporates precursor ion (PI) scan-driven information dependant analysis (IDA) to rapidly identify and structurally characterize its component glycopeptides. The characterization information is then used to develop specific MRM transitions that are utilized to quantitatively compare the nature and extent of glycosylation among three production batches of HA produced in both plant and insect hosts. A comparison of the estimates of the relative abundance of each specific glycoform between the MRM strategy and a conventional extracted ion chromatogram (XIC) approach was also investigated. The percent occupancy of each glycosylation site was also determined after treatment of tryptic digests of HA with PNGase F and MS/MS analysis on a high resolution instrument capable of distinguishing between peptides incorporating an aspartic acid (glycoform) or an asparagine (apo form). We demonstrate with this newly developed workflow that the MRM-based quantitative analysis can be used to directly compare the glycoforms present at each N-linked site in the sample material. This strategy has a great potential for assessing batch-to-batch variation in recombinant glycoprotein production.
2 Materials and methods
2.1 Chemicals and reagents
Sequence grade acetonitrile (ACN), Optima grade water, trifluoroacetic acid (TFA), and formic acid (FA) were purchased from Fisher Scientific (Fair Lawn, NJ). The recombinant influenza hemagglutinin from A/California/04/09 (H1N1) expressed in a baculovirus expression system in an insect cell line (Spodoptera frugiperda) was purchased from Protein Biosciences Corp. (Meriden, CT) and named HA1 in this study. Modified trypsin was purchased from Promega (Madison, WI), and the PNGase F was purchased from New England BioLabs (Ipswich, MA). Precast SDS-gels and colloidal Coomassie blue staining kits were purchased from Invitrogen (Carlsbad, CA). Omix C18 tips were purchased from Varian (Palo Alto, CA). Other chemical reagents including DTT and iodoacetamide, unless otherwise noted, were obtained from Sigma-Aldrich (St. Louis, MO).
2.2 Preparation of plant recombinant HA proteins
The recombinant HA nucleotide sequence was expressed in tobaco (Nicotiana benthamiana) plants. The recombinant product contained amino acids 18-530 of the A/California/04/09 strain of influenza virus with the addition of a 6x His tag and the ER retention signal (KDEL) at the C-terminal. Aerial tissue of infiltrated Nicotiana benthamiana were harvested and homogenized in a phosphate buffered extraction solution. The clarified extracts were used for purification of HA protein by sequential immobilized metal ion chromatography (IMAC), hydrophobic interaction and anion-exchange chromatography as described recently [15]. Two different batches of plant HA proteins, HA p12 and HA p14, were used in this study. The concentrations for the plant produced HA’s were determined from theoretical extinction coefficient as described in methods of Edelhoch [23] and Pace [24].
2.3 Gel separation, in-gel digestion/extraction and deglycosylation
The insect recombinant HA protein (HA1, 5 μg) along with identical amounts of HA p12 and HA p14, were separated by SDS-PAGE using 10-20% tris-glycine gradient gels, which were visualized with colloidal Coomassie blue (Invitrogen, Carlsbad, CA). The corresponding HA protein bands as shown in supplemental Fig. S1 were excised and subjected to in-gel digestion followed by extraction of the tryptic peptide as reported previously [25]. Briefly, gel slices were destained, reduced with 10 mM DTT and alkylated by treatment with 55 mM iodoacetamide in 20 mM ammonium bicarbonate (in the dark at room temperature for 1hr). Samples were treated at 35 °C for 16 hours with 0.5 μg trypsin by incubating gel slices in 40 μl of 25 mM ammonium bicarbonate. The resultant peptides were collected after centrifugation for 2 min at 4,000 x g. The residual peptides in the gel were then extracted in two additional washes by sonication in 50 μl of 5% formic acid in 50% acetonitrile and collected similarly. All three fractions of tryptic peptides were combined and evaporated to dryness in a Speedvac SC110 (Thermo Savant, Milford, MA). The tryptic peptides were reconstituted in 100 μL of 0.2% formic acid (FA) for direct precursor ion scanning MS and MRM analyses. Half of the reconstituted peptides for each sample were further treated with 500 units of PNGase F at 37 °C for 3 hrs following the vendor’s recommended protocol. The PNGase F treated samples were cleaned up using Omix C18 tips, and reconstituted in 25 μL of 0.2% FA prior to high resolution MS and MS/MS analysis.
2.4 NanoLC-MS/MS analyses
The nanoLC-ESI-MS/MS analysis for characterization of glycosylation profiles was performed on an UltiMate3000 nanoLC (Dionex, Sunnyvale, CA) coupled with a hybrid triple quadrupole linear ion trap mass spectrometer, the 4000 Q Trap equipped with a Micro Ion Spray Head II ion source (Applied Biosystems/MDS SCIEX, Framingham, MA). The tryptic peptides (1 to 4 μL) of HAs were injected with an autosampler onto a PepMap C18 trap column (5 μm, 300 μm × 5 mm, Dionex) with 0.1% FA at 20 μL/min for 1 min and then separated on a PepMap C18 RP nano column (3 μm, 75 μm × 15 cm, Dionex) and eluted in a 60-minute gradient of 10% to 35% ACN in 0.1% FA at 300 nL/min, followed by a 3-min ramp to 95% ACN-0.1% FA and a 5-min hold at 95% ACN-0.1% FA. The column was re-equilibrated with 0.1% FA for 20 min prior to the next run.
MS data acquisition was performed using Analyst 1.4.2 software (Applied Biosystems) for PI scan triggered IDA analysis [26] and an enhanced MS-based IDA analysis. The precursor ion scan of the oxonium ion (HexNAc+ at m/z 204.08) [27] was monitored using a step size of 0.2 Da cross a mass range of m/z 500 to 1600 for detecting glycopeptides containing the N-acetylhexoamine unit. The nanospray voltage was 1.9 kV, and was used in the positive ion mode for all experiments. The declustering potential was set at 50 eV and nitrogen was used as the collision gas. For the IDA analysis, after each precursor ion or EMS scan, the two (for PI scan) to three (for EMS scan) highest intensity ions with multiple charge states were selected for MS/MS using a rolling collision energy that was applied based on the different charge states and m/z values of the ions.
For quantitative analysis of the glycoforms of each glycoprotein (in relative terms) across three recombinant HAs, MRM analysis for selected target glycopeptides and their apo peptides, was also applied to the same gel-extracted samples using the nanoLC-4000 Q Trap platform. The nanoLC-MRM analysis was performed in triplicate for all three HA samples. The PI scan-IDA data on all detected glycopeptides with different glycoforms were used to select precursor → fragment ion m/z values (transition pairs) for MRM assays. The EMS-IDA data on the unmodified targeted peptides and three independent HA tryptic peptides serving as reference peptides were also used to determine their transition pairs using MRMPilot 2.0 software (Applied Biosystems) for selection of the three best fragment ions per precursor. Selection for MRM analysis was based on four main criteria: (i) three transition pairs were selected for each precursor m/z ion; (ii) the three reference peptides chosen were detected by EMS-IDA with no missed cleavages and 99% confidence in identification, and covered elution time from earlier (~11 min), middle (~20 min) and late (~32 min) stages of the chromatogram; (iii) the m/z value of fragment ions for monitoring transition pairs was always larger than that of their precursor ions to enhance the selectivity for reference peptides and unmodified targeted peptides; and (iv) three product ions selected for each glycoform of glycopeptides included the Y+1 or Y2+1 (protonated peptide+HexNAc), a characteristic oxonium ion at m/z 366 (protonated HexNAc-Hex) and another high intensity y ion were monitored. As a result, three independent MRM acquisition methods were generated for monitoring N287, N481, N11, N23 and N276 sites and their free targeted peptides. Each MRM method consists of 35 to 60 transition pairs with a dwell time at 30 to 50 ms for each pair in the nanoLC-MRM analysis with a cycle time of less than 2 sec. The same collision energy used in the PI scan-IDA and EMS-IDA was used for each precursor ion in the MRM analysis. The detailed transition ion pairs (Q1 to Q3), associated collision energy and dwell times for each N-linked site and its glycoforms are listed in supplemental Table S1.
To confirm the N-linked glycosite identification and determine the glycosylation site occupancy, high resolution nanoLC-MS/MS analysis of tryptic peptides derived from PNGase F treated HAs was carried out using the UltiMate3000 RSLCnano (Dionex, Sunnyvale, CA) coupled with a LTQ-Orbitrap Velos (Thermo-Fisher Scientific, San Jose, CA) mass spectrometer equipped with a “Plug and Play” nano ion source (CorSolutions LLC, Ithaca, NY). The same nanoLC conditions were used as mentioned above except that the gradient time was reduced from 60 min to 30 min. The Orbitrap Velos was operated in positive ion mode with the nano spray voltage set at 1.5 kV and source temperature at 275 °C. The calibrants were either the background polysiloxane ion signal at m/z 445.120025 as a lock mass internal calibrant, or the Ultramark 1621 external calibrant for the Fourier Transform (FT) mass analyzer. The instrument was utilized in the parallel data-dependent acquisition (DDA) mode using the FT mass analyzer for one survey MS scan on precursor ions followed by MS/MS scans of the 7 highest intensity multiply charged ions with a threshold ion count > 7,500 in both the LTQ mass analyzer and the HCD-based FT mass analyzer at a resolution of 7,500 (fwhm at m/z 400). An MS survey scan was acquired at a resolution of 60,000, for the mass range of m/z 375-1800. Dynamic exclusion parameters were set at repeat count 1 with a 20 s repeat duration, an exclusion list size of 500, 30 s exclusion duration with ±10 ppm exclusion mass width. Collision induced dissociation (CID) parameters were set at the following values: isolation width 2.0 m/z, normalized collision energy 35 %, activation Q at 0.25, and activation time 10 ms. The activation time was 0.1 ms for HCD analysis. All data were acquired using Xcalibur 2.1 operating software (Thermo-Fisher Scientific).
2.5 MS data analysis
The acquired MS/MS spectra from the 4000 Q Trap (EMS-IDA) and LTQ Orbitrap Velos instruments were submitted to Mascot 2.3 (Matrix Science, Boston, MA) for database searching using an in-house, licensed Mascot server and the search was performed to query to the NCBInr database (taxonomy: viruses) downloaded on June 23, 2011 with 812,281 entries. The enzyme specificity was set to trypsin with two missed cleavages allowed. The peptide mass tolerance was set to 1.2 Da and MS/MS mass tolerance was set to 0.6 Da for the data from the 4000 Q Trap. For the Orbitrap DDA data, the peptide tolerance was set to 10 ppm and the MS/MS tolerance was set to 0.6 Da (for MS/MS spectra acquired by LTQ) and 0.05 Da (MS/MS spectra acquired by the Orbitrap FT mass analyzer). A fixed carbamidomethyl modification of cysteine and variable deamidation of asparagine and glutamine, and methionine oxidation were applied. Only scores for the peptides defined by Mascot probability analysis (www.matrixscience.com/help/scoring_help.html#PBM) greater than “identity” were considered significant for peptide identification and modification site determinations. All MS/MS spectra for the identified peptides with Asn deamidation were manually inspected and validated using both Proteome Discoverer 1.2 and Xcalibur 2.1 software (Thermo-Fisher Scientific, San Jose, CA).
All acquired MS/MS spectra triggered by PI scan on m/z 204 were manually inspected and interpreted with Analyst 1.4.2 and BioAnalysis 1.4 software (Applied Biosystems) for the identification of the N-linked glycosylation sites and glycan structure. The GlycoMod Tool software [28] was also used to provide predictions of potential glycan compositions for the glycan masses determined from MS/MS analysis. The peak areas of the detected precursor ions were determined by the XIC at each specific m/z representing the parent glycopeptide isoforms. When different charge states were observed for a given glycoform, the sum of peak areas for all charged states was used to estimate the glycoform distribution. The relative abundance of the various glycoforms was estimated based on precursor ion peak areas under the assumption that all glycan isoforms linked to the same core peptide have identical or similar ionization efficiency. This assumption is based on the following evidence: the relative quantiation of the five glycan forms (Man5 to Man9) released from Ribonuclease B by the anthrone assay, was 57, 31, 4, 7, 1% respectively [29]. These results are consistent with the ratios reported by Zhang and Williamson [30] obtained by MS survey scan of a Ribonuclease B tryptic digest (54.7, 31.9, 4.6, 7.7 and 1.1%). Furthermore, a parallel comparison of UV 280nm absorbance and MRM detection and quantitation of HILIC separated glycoforms of a glycopeptide (EEQYNSTYR) from the monoclonal antibody trastuzumab yielded nearly identical quantitation profiles [31], suggesting similar ionization efficiency among the different glycopeptide forms. The percentage of each glycoform for each specific core peptide was defined as the peak area for the specific glycoform/sum of peak areas for all the glycoforms associated with the same core peptide. The XICs from Orbitrap DDA files for both the apo form and deamidated form of all target core peptides containing N-linked site were generated with Xcalibur 2.1 software with a mass tolerance at 5 ppm and a mass precision at the 4th decimal point. The ratio of XIC peak areas for deamidated form to apo form was used to determine the glycosylation site occupancy in the recombinant HAs.
The MRM data for the three HA samples were obtained in triplicate runs and analyzed using MultiQuant 2.0 software (Applied Biosystems). All MRM peak areas were automatically integrated and inspected manually. In the case where the automatic peak integration by MultiQuant failed, manual integration was performed using the MultiQuant software. The peak areas for each MRM transition pair were then exported to Excel (Microsoft) files for further analysis. The average and standard deviation (SD) of the % abundance of each glycoform was determined from the triplicate runs of each recombinant HA. Three reference peptides, each with three transition pairs, were used as reference points for normalization of initial HA peptide abundance and reduction of run-to-run variation.
3 Results
3.1 Experimental design
Due to the impurities (≤90%) particularly in the form of HA cleaved fragments found in the commercial product from insects (see Fig. S1), the first step in the workflow was SDS PAGE separation, rather than direct solution-based analysis, followed by LC-MS/MS analysis of in-gel digests of the excised gel bands (~75 kD for the glycosylated HAs). A precursor ion scan of m/z 204 was performed to determine the retention time and the masses of all the glycosylated tryptic peptides and their various glycoforms. PI scan-triggered MS/MS analysis was used to identify glycosylation sites and to elucidate the glycan structures of all the glycoforms detected. The subsequent target-based MRM analysis was developed for comparison of glycosylation profiles among the three batches of HA proteins. The XICs of the detected glycoforms from the PI scan were also used to estimate the relative abundance of glycoforms at a given glycosylation site to obtain a glycosylation profile. Finally, the workflow also included deglycosylation of HA tryptic peptides for confirmation of the glycosylation sites and determination of glycosylation site occupancy. An overview of the experimental strategy and workflow conducted in this study is shown in Fig. 1 for characterizing the N-linked glycosylation profiles of recombinant HA proteins expressed in either insect or plant cells, and assessing the potential batch-to-batch variation of the glycoforms in plant recombinant HAs [9].
Figure 1.

Experimental design and schematic diagram of workflow used in this study. Three nanoLC-MS/MS techniques were used to obtain N-linked glycosylation profiles of the recombinant HAs from insect and plant. These techniques include PI scan-triggered MS/MS analysis and subsequent MRM quantitative analysis for the target glycoforms in 4000 Q Trap, and high resolution data dependent MS/MS analysis in Orbitrap for verification of the identified glycosylation sites and determination of glycosylation site occupancy.
3.2 Identification of N-linked glycosylation sites and glycoforms by PI scan driven MS/MS
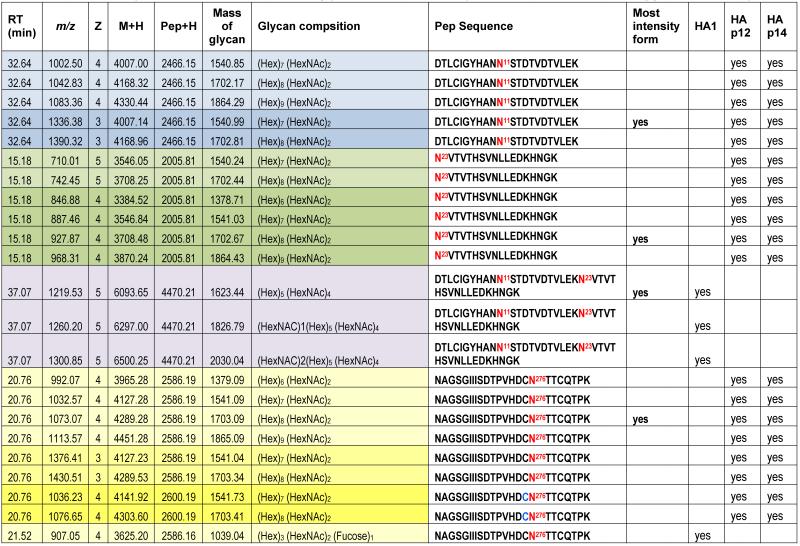
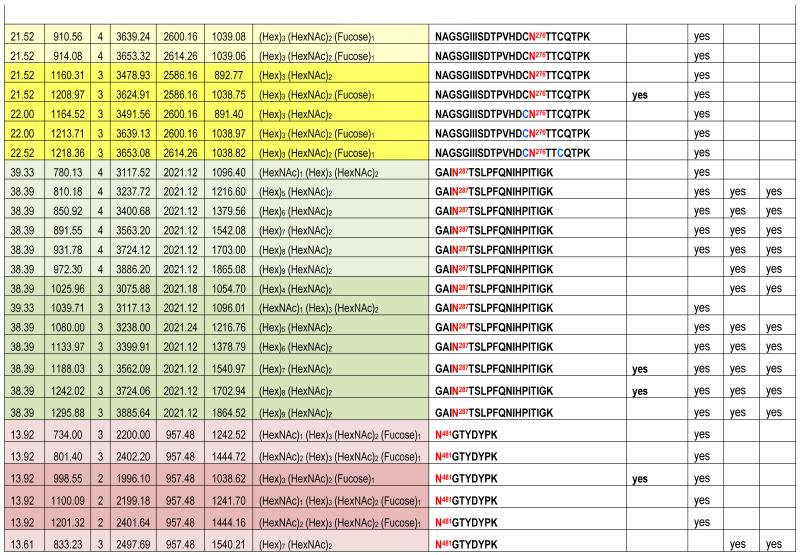
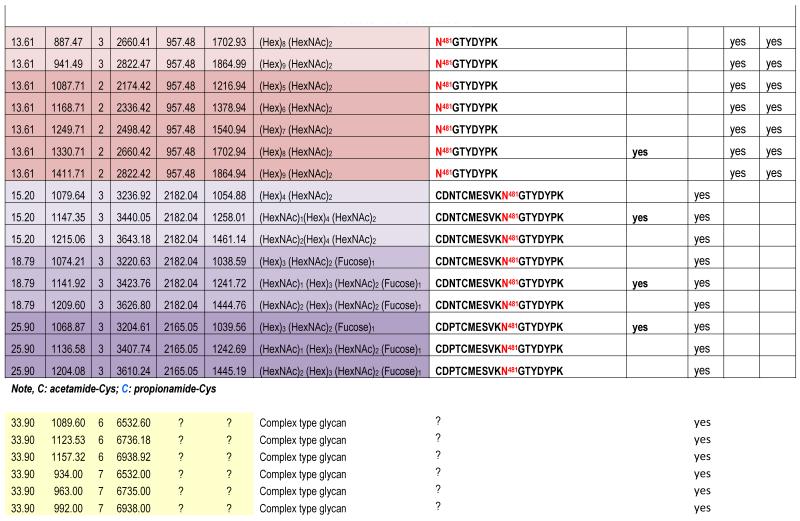
The theoretical molecular weights (MWs) of the insect recombinant HA1 and the plant recombinant HA p12 and HA p14 are 61.4 kD and 59.0 kD, respectively. The 2.4 kD difference was confirmed in the SDS gel after deglycosylation by PNGase F treatment for both insect and plant proteins (Fig. S1). The experimentally determined MW for all three proteins, as determined by SDS-PAGE, was ~75 kD (Fig. S1), suggesting that the glycan masses of the insect HA and plant HAs are ~13.6 kD and 16 kD, respectively. Both insect and plant HAs have 7 potential N-linked glycosylation sites based on the N-X-S/T consensus glycosylation sequence (N10, N11, N23, N87, N276, N287 and N481). Six of the 7 potential sites (the exception being N10) have been reported as being glycosylated [15]. In this study, the hybrid triple quadrupole/linear ion trap feature of the 4000 Q Trap allowed us to perform precursor ion scans for the characteristic oxonium ion of N-acetylhexoamine (HexNAc) at m/z 204.1, when operating in its triple quadrupole mode to selectively detect glycan-containing peptide ions. The subsequent MS/MS on the detected precursor ions was acquired by rapid switch to the linear ion trap mode in 4000 Q Trap for enhancing sensitivity [30]. In this PI scan triggered IDA mode, all ions of significant abundance identified in the PI scan as peptidyl-glycans were sequentially selected for product ion experiments to provide glycan structural information and to identify the glycosylation site. A base peak chromatogram of a typical LC-MS precursor ion scan-triggered IDA for gel-extracted tryptic digests of plant HA p12 is shown in Fig. 2A, where at least five peaks (eluting at 13.5 min, 15.5min, 19.8 min, 32.8 min and 38.5 min) were found containing multiple glycoforms associated with core peptides containing N481, N23, N276, N11 and N287, respectively. A representative MS spectrum of the PI scan peak at 38.5 min for HA p12 sample yielded 6 triply-charged ions, differing by 54 m/z along with the 5 quadruply-charged ions, differing by 40.5 m/z (Fig. 2B). These results indicate that at least 6 different glycoforms were detected from a single core peptide that produced the characteristic oxonium product ion. Collision-induced fragmentation of the triply and quadruply-charged ions demonstrated the presence of 6 different high-mannose type glycoforms (Man4-9GlcNAc2) on the N287 residue in the tryptic peptide 284-GAINTSLPFQNIHPITIGK-302 of HA p12. Fig. 3A shows an example of an MS/MS spectrum for the triply-charged precursor (m/z 1243.05), which was identified to be the Man8GlcNAc2 glycoform at the N287 site. The MS/MS spectrum provides direct evidence for the high mannose-type glycosylation linked to the N287 site. A summary of all N-linked sites and the heterogeneous glycoforms identified in this PI scan-triggered IDA study for all three batches of HA proteins is given in Table 1. The HA1 protein was also found to have 6 different glycoforms at N287, including Man5-9GlcNAc2 plus a complex type form: HexNAc-Man3GlcNAc2 where a mono HexNAc unit was linked to the core structure (Man3GlcNAc2) at its non-reducing end (Table 1). Fig. 3B shows the MS/MS spectrum of a triply-charged ion at m/z 1336.74 from HA p12 digest, confirming the presence of an N11 glycosylation site (1-DTLCIGYHANNSTDTVDTVLEK-22) containing a high mannose type glycosylation form (Man7GlcNAc2) and further indicating there is no glycosylation on the putatively glycosylated N10 residue, despite the presence of the consensus glycosylation motif. Two additional MS/MS spectra of the quadruply-charged ions at m/z 927.99 and m/z 1073.51 from HA p12 digest are shown in Supplemental Fig. S2A and S2B, for the identification of the glycan Man8GlcNAc2 at the N23 site (23-NVTVTHSVNLLEDKHNGK-40) and the N276 site (260-NAGSGIIISDTPVHDCNTTCQTPK-283). Surprisingly, no glycopeptides were detected that contained only N11 or N23 in the insect HA1 proteolytic digest. Rather, these were detected in a partial digestion product containing a single missed cleavage. Analysis of the data generated from this ion revealed that both the N11 and N23 sites contain three different glycoforms (Table 1). The glycosylation of N481 was also detected in both HA1, HA p12 and HA p14 (Table 1); however, three isoforms at the core peptide level were detected, indicating the presence of a missed cleavage and a sequence mutation (N473P) in the HA1 digest. The MS/MS spectra of the three ions at m/z 998.482+, m/z 1074.323+ and m/z 1068.853+ (Fig. 4) lead to the identification of the glycoform (Man3GlcNAc2Fuc1) at the N481 site in the core peptide: 481-NGTYDYPK-488 (Fig. 4A); 471-CDNTCMESVKNGTYDYPK-488 (Fig. 4B) and 471-CDPTCMESVKNGTYDYPK-488 (Fig. 4C), respectively. For the plant HAs, only the single target peptide: 481-NGTYDYPK-488 was identified by the initial PI scan-IDA analysis and was associated with 5 different high mannose type glycoforms as Man5-9GlcNAc2 (Table 1). However, subsequent MRM analysis demonstrated that the three core peptide forms associated with N481 glycosylation in HA1 are also present in digests of both plant HA samples (see below).
Figure 2.


Precursor ion scan triggered data dependent MS/MS analysis was used for characterizing N-linked glycosylation of recombinant HAs from insect and plant. A representative base peak chromatogram of a LC-MS precursor ion scan (on m/z 204.08) triggered IDA for gel-extracted tryptic digests of a plant HA (A) where the five N-linked glycosylation sites identified in this study are labeled. A representative of MS spectrum acquired from a peak identified by the LC-MS precursor ion scan (+204.08) triggered IDA analysis eluted at 38.5 min (B). Five to six high mannose type of glycoforms associated with N287 tryptic peptide distributed over two different charge states were detected and characterized by the MS/MS on each of the glycoform ions.
Figure 3.


MS/MS spectra used for identifying N-linked glycopeptides, defining the glycosylation sites and elucidation of the glycan structure by the selective PI scan triggered IDA. A MS/MS Spectrum of m/z 1242.053+ ion identifying the N287 glycopeptide as the Man8GlcNAc2 glycoform from HA p12 digest (A); A MS/MS Spectrum on m/z 1336.744+ ion identifying the N11 glycopeptide at its Man7GlcNAc2 glycoform (B).
Table 1. Summary of N-linked sites and their glycoforms identfied by nanoLC-PI scan (+204) triggered IDA analysis.
|
Figure 4.


MS/MS spectra used to characterize the N-481 associated glycopeptides from the insect HA1 tryptic digest by PI scan triggered IDA. Five high mannose type of glycoforms were identified in the tryptic peptide 481-NGTYDYPK-488A. Three high mannose type of glycoforms were identified in an incomplete digestion product that included residues 471 to 488 and its N471P mutated peptide. The MS/MS spectra of the three ions at m/z 998.482+, m/z 1074.323+ and m/z 1068.853+ lead to the identification of the glycoform (Man3GlcNAc2Fuc1) at N481 site in three core peptide: 481-NGTYDYPK-488 (A); 471-CDNTCMESVKNGTYDYPK-488 (B) and 471-CDPTCMESVKNGTYDYPK-488 (C), respectively.
This analysis demonstrates that there is a significant difference in the glycoform composition of 4 of the 5 identified N-linked sites (N11, N23, N276, and N481) between the insect HA and the plant HAs. As shown in Table 1, a complex type N-linked glycoform with either a fucose linked to the innermost HexNAc unit, or one or more HexNAc units linked to the Hex residues at the non-reducing end were identified in the recombinant HA1 protein. In contrast, only high mannose type of glycoforms were identified in the two plant HAs. N287 is the only glycosylation site with a high mannose type glycosylation in both insect and plant HAs.
3.3 Verification of the glycosylation sites and determination of site occupancy
To verify the glycosylation sites identified by the PI scan-IDA analysis and to determine the glycosylation site occupancy, a portion of each HA tryptic digest was treated with PNGase F to remove glycans from the target glycopeptides. During the deglycosylation reaction, the target Asn residue was deamidated to Asp, leading to a mass increase of 0.984 Da in the deglycosylated peptide compared to its native Asn-containing peptide. The mass spectral data was acquired at high resolution and accuracy as described above making it possible to distinguish between the apo or deaminated forms. After complete deglycosylation, all heterogeneous glycoforms of a particular core peptide will collapse into the apo form significantly enhancing sensitivity. As a result, the identification of the peptides with deaminiated Asn located at N-linked consensus motifs has been often used as an empirical approach for confirming the identity of N-linked glycosylation sites. Another benefit of the deglycosylation treatment prior to LC-MS/MS analysis is that the relative quantitation of the deamidated form versus the apo form for the target peptide can be obtained through the XIC of its precursor m/z at <5 ppm mass tolerance. Although the difference of Asp and Asn may cause slight variation in ionization efficiency and retention times, these differences are usually very small and inconsequential in practice. Therefore, the quantitation of the apo form (Asn) and deamidated form (Asp) can be used to determine the glycosylation site occupancy as [Asp]/{[Asp] +[Asn]}.
In this study, the relative quantitation of glycosylation site occupancy was determined for all three HA proteins (Table 2). More than 95% occupancy was found for the N23, N276, N287 and N481 sites and about 60% site occupancy for the N11 site. The site occupancy for the N11-N23 missed cleavage peptide was ~78%, which is significantly higher than the N11 peptide alone, suggesting that there might be some contributions from spontaneous nonspecific deamidation at the other three Asn residues in the peptide. Our data also demonstrate that there is no significant difference in site occupancy among the three HAs, despite the fact that there was significant difference in the glycan composition between insect HA and plant HAs. The results in Table 2 also provide direct evidence for the increased sensitivity in response to the deglycosylation treatment. For example, we failed to detect the N11-N23 miscleavaged peptide for both plant HAs in the PI scan triggered IDA analysis (Table 1). But after deglycosylation, the deglycosylated target peptides were identified in all three samples (Table 2). A similar phenomenon was also observed for the N11 and N23 individual peptides in HA1 and another N23 peptide: N23VTVTHSVNLLEDK in all three HAs, which were identified only after deglycosylation (Table 1, 2).
Table 2. N-linked glycosylated site occupancy of hemagglutinin.
| Pep Sequence | % Occupancy* | ||
|---|---|---|---|
| HA1 | HA p12 | HA p14 | |
| DTLCIGYHANN11STDTVDTVLEK | 59.8 | 57.7 | 64.9 |
| N23VTVTHSVNLLEDK | 99.9 | 99.5 | 99.8 |
| N23VTVTHSVNLLEDKHNGK | 90.1 | 99.1 | 98.6 |
| DTLCIGYHANN11STDTVDTVLEKN23VTVTHSVNLLEDKHNGK | 78.2 | 77.6 | 79.9 |
| NAGSGIIISDTPVHDCN276TTCQTPK | 94.1 | 90.7 | 93.1 |
| GAIN287TSLPFQNIHPITIGK | 99.0 | 93.2 | 95.7 |
| CDNTCMESVKN481GTYDYPK | 98.7 | 99.5 | 99.6 |
average of duplicate runs
3.4 Glycosylation profiling of HAs by MRM analysis and extracted ion chromatograms
Once all glycosylation sites have been identified and the composition and structure of the various glycoforms have been determined, it is possible to develop more efficient-targeted methods to evaluate the quality of the material generated from successive production runs of the glycoprotein. These methods could be used as a means of quality control and in the assessment of batch-to-batch reproducibility as would be required for glycoproteins intended for therapeutic use. With this in mind, we implemented an MRM approach for quantitative analysis of all glycoforms identified in the three HA proteins. Since there was a significant difference in the glycoform composition of the 4 glycosylation sites (N11, N23, N276, and N481) between the insect HA and plant HAs, our initial focus was on the glycosylation profiling of the high mannose type N287 site. MRM assays were developed for all three HAs including a total of 7 distinct glycoforms plus the apo form of the target peptide (284-GAINTSLPFQNIHPITIGK-302). A comparison of the relative distribution of the 6 N287 glycoforms from the individual HA samples revealed that the two batches of plant HAs have a nearly identical glycoform distribution. Man8GlcNAc2 was the most abundant glycoform for all three HAs (Fig. 5), accounting for about 45% for HA1, and nearly 70% for plant HAp12 and HAp14. The most significant difference between insect HA and plant HAs was found in the glycoform consisting of Man9GlcNAc2, which was present at more than 20% of the plant HAs and is the second most abundant species, whereas it was the least abundant form in the insect HA, accounting for less than 1% of the total abundance. The relative orders of abundance of the other glycoforms are consistent between insect and plant HAs. In agreement with the results from the PI scan-IDA results, no complex type glycoform (e. g., HexNAc1Hex3HexNAc2) was detected in plant HAs and no detectable Man4GlcNAc2 glycoform was found in HA1. The relative quantitation of the 7 glycoforms and the apo peptide across the three HAs by MRM analysis is shown in Fig. 6. The data for each of the 6 glycoforms plus the apo peptide detected in the insect HA (HA1) were normalized to 1 unit as indicated in the blue column. The relative ratios for each of the 6 glycoforms and the apo peptide detected in the two batches of plant HAs (HA p12 and HA p14) were then normalized to those of HA1. No difference was found between the two batches of plant HAs, but significant differences were observed between insect HA1 and the plant HAs. The biggest difference was the abundance of Man9GlcNAc2, which was ~60-fold higher in the plant HAs, while the other glycoforms (Man5-8GlcNAc2) displayed a ~3-fold difference between insect and plant HAs. Interestingly, nearly 20-fold more apo core peptide was found in the plant HAs than in HA1, suggesting that the glycosylation efficiency was higher in the insect system. Nevertheless, a very high degree of glycosylation was achieved in both expression hosts, (95% and 99% in plants and insects, respectively). The inset of Fig. 6 shows an example XICs from three MRM transition pairs for each of the three reference peptides (A, B), a glycoform of Man6GlcNAc2 (C, D) and a glycoform of Man9GlcNAc2 (E, F).
Figure 5.

Comparison of relative distribution of the N287 glycoforms within a given recombinant HA from insect and plant is obtained by MRM analysis after normalization to three reference peptides in each run. The relative abundance of each glycoform was calculated as percentage of total glycoforms for each HA sample. The % glycoform abundance in each HA is then compared to each other for three HAs.
Figure 6.

The relative quantitation of the seven glycoforms and the apo peptide across three HAs by MRM analysis. The data for each of the six glycoforms plus the apo peptide detected in the insect HA (HA1) was normalized to 1 as indicated in the blue column. The relative fold change ratios on each of the six glycoforms and apo peptide detected in the two batches of plant HAs (HA p12 indicated by red column and HA p14 denoted by green column) were then normalized to those of HA1. The inset shows that XIC of the MRM for three transition ion pairs of three reference peptides, and two N-287 glycoforms of recombinant HAs from insect (A, C and E) and plant (B, D and F). The three reference peptides, given in the order of retention time, are 106-GVTAACPHAGAK-117 (ref pep1), 78-EQLSSVSSFER-88 (ref pep2) and 215-ITFEATGNLVVPR-227 (ref pep3). The transition pairs are 570.37/580.32, 570.37/811.44, 570.37/740.40 for ref pep1; 634.88/898.43, 634.88/811.39, 634.88/1011.48 for ref pep2; and 708.97/754.44, 708.97/926.52, 708.97/855.48 for ref pep3 (see Table S1). The transition pairs for the N287 glycoform (Hex)6(HexNAc)2 in panel C and D are 1134.30/1112.88 (blue), 1134.30/366.10 (red) and 1134.30/628.56 (green), and for the N287 glycoform (Hex)9(HexNAc)2 in panel E and F are 1296.75/1112.88 (blue), 1296.75/366.10 (red) and 1296.75/628.56 (green).
To assess possible variation in the glycosylation sites between the two batches of plant HAs, additional MRM analysis was carried out for the rest 4 sites. For the N481 site, three different core peptides were involved so the analysis was carried out on a total of 11 glycopeptide forms with 5 distinct glycoforms (Table S1). The relative distribution of the N481 associated glycoforms for each of the three core peptide forms in the two plant HAs samples was compared and is shown in Supplemental Fig. S3A. Similar glycoform distributions were observed for all glycoforms in each of the three core peptides containing the N481 site, and, as with the N287 site, the Man8GlcNAc2 glycoform dominated (50% to 70%) in three core peptides for both HA p12 and HA p14. However, unlike the case with N287, the Man9GlcNAc2 was the least abundant of the glycoforms detected at the N481 site. Supplemental Fig S3B shows the relative quantitation of the apo and glycoforms for each of the N481 core peptides between the two HAs. No differences were found for any of the five glycoforms and the apo peptide in the core peptide 481-NGTYDYPK-488 between the two batches of plant HAs. However, an approximately 2-fold increase in HA p14 over HA p12 was found for the Man9GlcNAc2 form in the core peptides containing the miscleaved core, despite the observation that there was no change in the relative abundance of the apo peptides. The MRM analysis for N11, N23 and N276 also provided similar results. As demonstrated in Fig. S4A, the relative glycoform distribution for all glycoforms on all three sites is identical between the two HAs. For the N23 and N276 sites, the Man8GlcNAc2 glycoform was confirmed as the most abundant form (>70%), but at the N11 site, an equal distribution among the three glycoforms was observed. Similarly, equivalent results for the relative quantitation of glycoforms at the N23 and N276 sites between the two batches of HAs were also demonstrated (Fig. S4B), although a significant lower yield of glycoforms (~3-fold) at the N11 site was detected in HA p14 when compared to HA p12.
For cross-validation of the glycoform distribution data determined by MRM analysis, XIC traces of the PI scan-IDA data for all glycoforms at the N287 site were used to estimate the relative abundance of the glycoforms within a given HA protein. The relative glycoform distribution (abundance) determined independently from both the MRM and PI scan XIC approaches are compared for each of the three HAs (Table 3). When the relative abundance of each glycoform is listed in rank-order both the MRM and XIC of PI scan methods result in a consistent order of abundance, but the exact percentages vary, particularly for the low abundance glycoforms. Nevertheless, for the relative abundance of the two most abundant glycoform (Man8GlcNAc2, ~65% and Man9GlcNAc2, ~23%), the RSD (relative standard deviation) between the two independent quantitative methods was less than 10%. Even for the 4 lowest abundance glycoforms (from only 0.3% to 3% relative distribution), the RSD between the two methods was between 37 to 45%. A large discrepancy between the two methods was also found in HA1 for the complex type of glycoform, HexNAc1Hex3HexNAc2, which comprises 20.9% in the XIC of PI scan compared with 4.4% from the MRM analysis. However, for the other 5 high mannose type of glycoforms, the abundance determined by the two methods was consistent (see Table 3).
Table 3. Comparison of quantitaitve N287 (GAINTSLPFQNIHPITIGK) glycoforms by XIC of PI scan-IDA and MRM analyses.
| RT (min) |
m/z | Z | Glycan compsition |
Peak Area by XIC of PI scan-IDA |
Peak Area by XIC of MRM | Realtive Abundance % by XIC of PI scan-IDA |
Realtive Abundance % by XIC of MRM |
||||||||
|---|---|---|---|---|---|---|---|---|---|---|---|---|---|---|---|
| HA1 | HA p12 | HA p14 | HA1 | HA p12 |
HA p14 |
HA1 | HA p12 |
HA p14 |
HA1 | HA p12 |
HA p14 |
||||
| 39.33 | 780.13 | 4 | (HexNAc)1 (Hex)3 (HexNAc)2 |
1.97E+06 | 0.00 | 0.00 | ND | ND | ND | ||||||
| 38.39 | 810.18 | 4 | (Hex)5 (HexNAc)2 |
1.73E+06 | 9.34E+05 | 9.92E+05 | ND | ND | ND | ||||||
| 38.39 | 850.92 | 4 | (Hex)6 (HexNAc)2 |
3.28E+06 | 1.34E+06 | 1.01E+06 | ND | ND | ND | ||||||
| 38.39 | 891.55 | 4 | (Hex)7 (HexNAc)2 |
7.76E+06 | 3.05E+06 | 1.42E+06 | ND | ND | ND | ||||||
| 38.39 | 931.78 | 4 | (Hex)8 (HexNAc)2 |
1.49E+07 | 5.18E+07 | 6.18E+07 | ND | ND | ND | ||||||
| 38.39 | 972.30 | 4 | (Hex)9 (HexNAc)2 |
6.61E+05 | 2.61E+07 | 3.34E+07 | ND | ND | ND | ||||||
| 38.39 | 1025.96 | 3 | (Hex)4 (HexNAc)2 |
0.00 | 1.32E+06 | 1.30E+06 | 0.0E+00 | 1.0E+04 | 6.8E+03 | 0.0 | 0.7 | 0.6 | 0.0 | 0.3 | 0.3 |
| 39.33 | 1039.71 | 3 | (HexNAc)1 (Hex)3 (HexNAc)2 |
2.77E+07 | 0.00 | 0.00 | 2.0E+04 | 0.0E+00 | 0.0E+00 | 20.9 | 0.0 | 0.0 | 4.4 | 0.0 | 0.0 |
| 38.39 | 1080.00 | 3 | (Hex)5 (HexNAc)2 |
2.25E+07 | 6.80E+06 | 7.48E+06 | 5.3E+04 | 5.3E+04 | 3.7E+04 | 17.1 | 4.0 | 3.7 | 11.8 | 1.8 | 1.4 |
| 38.39 | 1133.97 | 3 | (Hex)6 (HexNAc)2 |
1.48E+07 | 6.50E+06 | 5.51E+06 | 6.5E+04 | 7.0E+04 | 5.6E+04 | 12.7 | 4.0 | 2.8 | 14.3 | 2.3 | 2.1 |
| 38.39 | 1188.03 | 3 | (Hex)7 (HexNAc)2 |
2.44E+07 | 8.06E+06 | 8.34E+06 | 9.9E+04 | 9.0E+04 | 7.6E+04 | 22.6 | 5.7 | 4.3 | 22.0 | 3.0 | 2.9 |
| 38.39 | 1242.02 | 3 | (Hex)8 (HexNAc)2 |
2.22E+07 | 6.99E+07 | 8.53E+07 | 2.1E+05 | 2.1E+06 | 1.8E+06 | 26.1 | 62.4 | 63.9 | 46.4 | 69.6 | 69.3 |
| 38.39 | 1295.88 | 3 | (Hex)9 (HexNAc)2 |
2.07E+05 | 1.94E+07 | 2.32E+07 | 4.2E+03 | 6.8E+05 | 6.3E+05 | 0.6 | 23.3 | 24.6 | 0.9 | 22.9 | 24.1 |
4 Discussion
Analysis of HA glycosylation has previously involved mostly biochemical approaches such as lectin chromatography [32], radioactive labeling with gel electrophoresis [33] and NMR spectroscopy [34]. Crystal structure of an insect recombinant HA from the viral strain A/California/04/09 (H1N1) has been published recently [35, 36], but no details for characterization of the glycans in the HA have been reported. Recently a LC-MS/MS analysis on the targeted N-linked glycosylation analysis of HA (H5N1) was reported for determination of site occupancy [37]. In this current study, the goal was to develop a generally applicable MS-based workflow for glycosylation profiling of proteins as a means to assess the batch-to-batch glycoform variation. As a test case we characterized the N-linked glycosylation of three production batches of HA (H1N1) produced in both plant and insect hosts. To our knowledge, there is no existing report presenting the detailed characterization of N-linked glycosylation sites of recombinant HA (H1N1) from plant host.
In the LC-PI scan-IDA analysis, monitoring of the characteristic oxonium ion allows selective identification of glycopeptides in a digest mixture. The precursor ions that generate this characteristic ion represent the various glycoforms present in the sample. Those that co-elute chromatographically represent the glycoforms associated with the same core peptide. Subsequent MS/MS analysis can yield the amino acid and glycan sequence for the selected glycoform ion. It should be noted that the Y1 ion (with the innermost GlcNAc residue attached to the peptide) [38] was often one of the most abundant Y type product ions observed and can be used to determine the mass of peptide and glycan, facilitating manual interpretation of the MS/MS spectra for the glycopeptide forms. Five of the 7 possible sites containing the N-linked consensus motif (N-X-S/T) were identified and fully characterized (N11, N23, N276, N287 and N481). Analysis of the N11 glycosylation site further revealed that one of the predicted glycosylation sites, N10, was not glycosylated in either the insect or plant samples (Fig.3B), and this was further confirmed by the deglycosylation treatments with subsequent high resolution MS/MS analysis (no deamidated N10 was identified). Another predicted glycosylation site is N87 located on the T7 tryptic peptide (residue 55-102). This 48-residue peptide has a calculated mass of 5,460.4 Da and together with an associated glycan, is expected to be too large to be identified in our LC-MS/MS analysis. However, MS spectra corresponding to the precursor ion scan peak at 33.9 min for the HA1 sample yielded three glycoforms at the 6+ and 7+ charged states with a total calculated mass of 6,533 Da, 6,736 Da and 6,939 Da (see Table 1). This observation together with the fact that no O-linked glycosylation has been reported in HA proteins [37], suggests the three complex type of glycoforms detected at 33.9 min are likely the glycopeptides associated with the peptide containing N87 tryptic peptide. Additional chymotrypsin digestion followed by LC-MS/MS analysis is required for complete characterization of N87 glycosylation.
A comparison of the different glycoforms identified in the five sites between the insect HA and plant HAs revealed that all glycoforms in the plant HAs are of the high mannose type and that the Man8GlcNAc2 and Man9GlcNAc2 forms predominated. This suggests that the KDEL sequence-mediated retention of HA in the endoplasmic reticulum (ER) limited the attachment of complex glycans, such as those containing fucose and xylose, in the recombinant plant expressed HA proteins. This KDEL retention approach therefore represents a potentially effective strategy for minimizing the production in plants of recombinant glycoproteins that are immunogenic for mammals, while maintaining the mammalian-like glycosylation for possible vaccine candidates and therapeutic drugs. This result is in contrast with other reports in the literature suggesting that recombinant proteins with an H/KDEL sequence at the carboxyterminus can exhibit N-glycan modifications that are known to occur in the Golgi and should no longer be considered to be free of potentially immunogenic modifications [39, 40], and demonstrates the value of the analytical methods presented here that allow an empirical characterization of the glycosylation. In insect HA, all five site glycoforms show a mixture of high mannose type and complex type glycosylation. At four of the five sites, the dominant glycoform is the basic N-link core structure with a fucose linked at Y1β position (Hex3HexNAc2Fuc1). This result is consistent with observed banding pattern in the SDS-PAGE gel showing (Fig. S1), which indicated a lower total glycan mass (~13.6 kD) associated with the insect HA than that (~16 kD) for the plant HAs. Another difference between the insect HA versus plant HA samples was that more miscleaved products associated with glycosylation were found in the digests of the insect sample. For example, in the insect HA digest analyzed by PI-scan IDA analysis, only the missed cleavage product was observed in a glycopeptide with two potential glycosylation sites. The N11-N23 glycopeptide was detected in the insect protein, whereas both the N11 and N23 tryptic glycopeptides were detected in plant HAs (Table 1). The same result was seen with the N481 site, where the partial digestion product: 471-CDNTCMESVKNGTYDYPK-488 was detected in insect HA1 digests by PI-scan IDA analysis, but not in the plant HA samples. This conclusion is further supported by the results from the N473P mutation (Table 1). These results, plus the fact that both missed cleavages occurred at a lysine residue followed by either an asparagines (N23 or N481) glycosylation site, lead us to believe that the fucose site linked to the inmost HexNAc residue limits the ability of trypsin act at the adjacent lysine site resulting in the accumulation of missed cleavage products. Surprisingly, during our initial glycosylation analysis, the N473P mutated peptide was only identified in the insect HA protein. However, upon further examination of the tryptic digests of the plant HAs, we consistently identified the N473P mutation in all three HAs. The MS/MS spectra for the peptide 471-CDNTCMESVK-480 and its N473P mutated peptide are shown in supplemental Fig. S5A and S5B, respectively. Since there is a substantial difference in the nucleotide sequences that can encode N and P residues, nucleotide substitution during the transformation and expression procedure in both insect and plant appears unlikely. There is no literature report for potential chemical conversion from N to P. At present, we don’t know what causes the N473P mutation.
All five glycosylation sites identified for both insect and plant HAs were confirmed by the conversion to Asp residues following deglycosylation of the tryptic peptides with PNGase F and high resolution LTQ Orbitrap analysis. Several glycosylation sites such as N11, N23 and N481, were also confirmed in spite of the occurrence of missed cleavages. The glycosylation site occupancy was determined for each of the above 5 sites, 4 of which (N23, N276, N287 and N481) were >95% under trypsin digestion, while N11 was ~60% occupied. Interestingly, both insect and plant HAs exhibited almost identical site occupancy for all 5 identified glycosylation sites, despite the significant difference of the glycan compositions between them. It is surprising that we did not detect the peptide: 481-NGTYDYPK-488 in either the apo or deamidated (D481) form in the LTQ Orbitrap analysis for all three HAs. However, we were able to identify the miscleaved peptide (471-CDNTCMESVKNGTYDYPK-488) in all three HAs, which allowed us to determine the glycosylation occupancy for the N-481 site (see Table 2).
Recently, LC-MS/MS quantitation analysis of HA has been reported for a selection of conserved peptide targets within a subtype in order to determine amino acid differences among subtypes [41, 42]. However, the quantitative changes in the peptides containing potential glycosylation sites were not investigated. In our glycosylation profiling of the recombinant plant derived HAs, we were particularly interested in assessing quantitative changes in the various glycoforms using LC-MS/MS analysis. Historically, quantitation of glycopeptides has been extremely challenging even with access to the most advanced MS instrumentation. In part, this is due to the hydrophilic nature of glycan, which causes relatively poor ionization efficiency of glycopeptides and poor retention capacity in C18 based chromatography. The co-elution of structurally heterogeneous glycopeptides that bear a mixture of glycoforms requires fast scan rates and sensitive MS instruments in order to offset possible ion suppression. Furthermore, the relatively large glycopeptides are often detected in different charge states and, more importantly, incorporating different charge species such as Na+, K+ adducts etc., which causes further degeneracy in the target molecules and complicates the mass spectra. The labile nature of the glycan components of glycopeptides subjected to in-source fragmentation during electrospray ionization (ESI) could also reduce experimental reproducibility. In addition, there is no currently available stable isotope-labeled standard glycopeptide that might serve as an internal standard, as is used for most routine quantitative LC-MS/MS work. For these reasons, the quantitation of glycopeptide is extremely challenging. We decided to use an MRM approach based on the following considerations: 1) characterization of HA protein glycosylation was performed using the hybrid triple quadrupole/linear ion trap mode and the resulting data and appropriate parameters for the MRM analysis are readily available for directly implementing the analysis using the same 4000 Q Trap; 2) excellent MS/MS spectra, corresponding to both glycan and peptide fragments were acquired for most of the glycoforms from each of the identified glycosylation sites; 3) the fast scan rate achievable in MRM mode allowed simultaneously monitoring of >50 transition pairs in < 2 sec cycle time resulting in at least 15 data points across each of the MRM peaks, ensuring reliable integration of peak intensity; and 4) there were no significant charge carriers present in our initial PI scan IDA analysis other than H+.
We performed two levels of quantitative analysis of each glycoform at each N-linked glycosylation site, as was recently reported by Rebecchi et al [17], for the acquired MRM data. In the first tier of the analysis, the relative abundance of all glycoforms within each sample was determined based on the assumption that all glycoforms associated with the same core peptide have similar ionization efficiencies. This result allowed us to both evaluate the dominant glycoforms and also to assess whether there was any difference in the glycoform distribution among the different N-linked sites for each HA sample. If there is a distribution discrepancy among the different N-linked sites, the variable N-linked distribution of the glycoform within a given HA can be compared to those of the other HAs allowing an estimation of batch-to-batch variation. In this analysis, we consistently demonstrated that the high mannose type glycan Man8GlcNAc2 is the dominant glycoform for 4 N-linked sites (N287, N23, N276 and N481) with ~70% in the plant HAs, and for the N287 site (~45%) of the insect HA1 (see Fig. 5, Fig. S3A and S4A). Moreover, there are significant differences in the glycoforms attached to the other N-linked sites. For example, the relative abundance of Man9GlcNAc2 in plant HAs, is 22% for N287, 1% for N23, 7% for N276 and 4% for N481. The relative abundance for the three glycoforms at N11 site of plant HAs is well distributed (Fig. S4A), which is significantly different from the general pattern. The fact that only 60 % occupancy was found at N11 (Table 2), suggests that glycosylation at the N11 residue might be subject to decreased efficiency due to its proximity to the N-terminus. Despite the variability found at different N-linked sites for the relative abundance of the glycoforms within each of the HA samples, the relative abundance of the glycoforms for each N-linked site between the two plant produced HAs is almost identical at all 5 sites for all different glycoforms. This demonstrates that the two batches of plant HA proteins (HA p12 and HA p14) have a consistent glycoform distribution at each N-linked site.
The MRM-based data related to relative abundance of glycoforms was further validated by conventional XIC of PI scan-IDA for each of the six glycoform ions at N287. As shown in Table 3, the rank-order of the 6 glycoforms for both plant HA samples is consistent between the two methods, suggesting that MRM analysis is a viable approach. The variation for relative distribution of the two most abundant glycoforms (Man8GlcNAc2 and Man9GlcNAc2) by the two methods is less than 10% RSD. A relatively large variation was observed for the other 4 glycoforms between the MRM and XIC from PI scan-IDA methods. However, while only 4-5 data points were collected for each chromatographic peak with the PI scan approach, and more than 15 data points were collected for each MRM peak, plus the higher selectivity and sensitivity observed by MRM analysis, we believe that the MRM data should be more accurate and relatively reliable, particularly for low abundance glycoforms.
In the second tier of the quantitative analysis, we compared MRM data for each glycoform at each corresponding N-linked site between samples. This comparison can be readily used in a “global” glycosylation profile of targeted glycoproteins, and is expected to have more variation, including sample preparation, instrument, run-to-run variation and biological replicate (HA p12 to HA p14) than the results from the first tier analysis. The results can provide insights into the reliability of the MRM method and can support its use in as a quality control procedure in glycoprotein production. As described in the experimental section, the MRM design included three reference peptides for normalization of the tryptic peptides in HA digests loaded on the column between the samples and minimizing run-to-run variation. As shown in Fig. 6, Fig. S3B and S4B, the relative quantitative ratios for each glycoform indicated a consistent 1:1 ratio for all glycoforms at N287, N481, N23 and N276 sites in the two batches of plant HAs. The relative ratio for all 5 unmodified core peptides covering the N287, N481 and N276 sites used in this MRM analysis also was 1:1 ratio between the two plant HAs after normalization, suggesting that the MRM analysis using three reference peptides for normalization, is effective for non-glycopeptides. This result for the aglycopeptides suggests that the relative ratios determined for the other glycoforms by MRM analysis are reasonably accurate. In this relative quantitation analysis, the most significant difference was observed between insect HA1 and the plant HAs. It should be noted that nearly 20-fold more apo core peptides found in the plant HA samples than in the insect HA1 (Fig. 6) seems to indicate that the glycosylation efficiency at the N287 site is lower in the plant expression system than in the insect cells. However, this apo core peptide was present in very small percentage compared to the glycosylated forms in both the insect and plant HAs as shown in Table 2 and that in both cases a high degree of glycosylation was achieved. Consistent with the glycosylation site occupancy at the N287 residue with 99% for HA1 and 94% for plant HAs, the insect system yields higher glycosylation efficiency than the plant system for the N287 site of the recombinant HAs. It is interesting to see that the significantly lower yield of glycoforms (~3-fold) on N11 site was consistently detected in the batch HA p14 than the HA p12. Again, the relatively large variation at the N11 site between the two batches of HA samples could be attributed to its location near the N-terminus of the protein, which may exhibit variable glycosylation in ER.
The determination of relative abundance of the glycoforms at each specific glycosylation site and the relative quantitation of each glycoform among three HAs was the major focus of this study and the workflow presented here is valuable as a quality control measure to assess batch-to-batch reproducibility for recombinant HA glycosylation. However, development of protocols for the absolute quantitation of the glycoforms for each specific glycosylation site is also critically important for bio-pharmaceutical development, although it represents a significant challenge in the MS-based analytical field primarily because of the challenges of chemically synthesizing isotopically labeled glycopeptides to serve as standards as is required for absolute quantitation by MRM analysis. Nevertheless, we believe there are two indirect approaches which can be used for absolute quantitation of N-linked glycopeptides. The first approach could be based on the deglycosylation of Asn-linked glycopeptides followed by conventional MRM absolute quantitation for the deaminated (Asn converted to Asp), and deglycosylated core peptides by spiking isotopically labeled standard peptides. As a result of the absolute quantification of the core glycopeptides the absolute concentration of each of the glycoforms can be calculated from the relative abundance of the glycoforms at each specific glycosylation site. Alternatively, a more accurate measurement of N-linked glycosylation site occupancy can be achieved using PNGase F-based deglycosylation in H2O18 buffer followed by MRM quantitaiton of both Asn- and Asp-containing targeted core peptides spiked with two isotopically labeled standard peptides as previously reported [4]. However, this alternative approach requires O18 incorporation into the carboxyl group of the newly formed Asp, which can be challenging experimentally, and two isotopically labeled standard peptides for each glycosylation site, which increases the cost of the assay significantly. It would be valuable to conduct a side-by-side comparison of both site occupancy approaches and evaluate their effectiveness with respect to determining the absolute concentrations of the glycoforms.
In conclusion, we have characterized the glycosylation profiles in detail of three recombinant HA protein samples, derived from either insect or plant expression systems. We have developed an MRM-based analytical workflow for the quantitative analysis of the glycan distribution associated with each core N-linked glycosylation site within a given sample. Importantly, the MRM-based quantitative analysis can be used for direct comparison of each of the glycoforms at each corresponding N-linked site between samples. The workflow has been tested as a potential quality control assay and analytical method for assessing batch-to-batch variation in the recombinant glycoprotein production.
Supplementary Material
ACKNOWLEDGEMENTS
This work was partially supported by NIH SIG grant 1S10RR025449-01, ARS CRIS project numbers 1907-21000-033/034-00D, NSF Plant Genome Grant DBI-0606596 and DBI-0606595.
Abbreviation
- HA
hemagglutinin
- XIC
extracted ion chromatogram
- MW
molecular weight
- IDA
information dependent acquisition
- EMS
enhanced mass spectrometry
- MRM
multiple-reaction monitoring
- DDA
data dependent acquisition
- FA
formic acid
- PI scan
precursor ion scan
- GlcNAc
N-acetylglucosamine
- HexNAc
N-acetylhexosamine
- HCD
high-energy collision dissociation
Footnotes
The authors have declared no conflict of interest.
5 References
- [1].Apweiler R, Hermjakob H, Sharon N. On the frequency of protein glycosylation, as deduced from analysis of the SWISS-PROT database. Biochim Biophys Acta. 1999;1473:4–8. doi: 10.1016/s0304-4165(99)00165-8. [DOI] [PubMed] [Google Scholar]
- [2].Budnik BA, Lee RS, Steen JA. Global methods for protein glycosylation analysis by mass spectrometry. Biochim Biophys Acta. 2006;1764:1870–1880. doi: 10.1016/j.bbapap.2006.10.005. [DOI] [PubMed] [Google Scholar]
- [3].Dwek RA. Glycobiology: more functions for oligosaccharides. Science. 1995;269:1234–1235. doi: 10.1126/science.7652569. [DOI] [PubMed] [Google Scholar]
- [4].Hulsmeier AJ, Paesold-Burda P, Hennet T. N-glycosylation site occupancy in serum glycoproteins using multiple reaction monitoring liquid chromatography-mass spectrometry. Mol Cell Proteomics. 2007;6:2132–2138. doi: 10.1074/mcp.M700361-MCP200. [DOI] [PubMed] [Google Scholar]
- [5].Zhao J, Qiu W, Simeone DM, Lubman DM. N-linked glycosylation profiling of pancreatic cancer serum using capillary liquid phase separation coupled with mass spectrometric analysis. J Proteome Res. 2007;6:1126–1138. doi: 10.1021/pr0604458. [DOI] [PubMed] [Google Scholar]
- [6].An HJ, Kronewitter SR, de Leoz ML, Lebrilla CB. Glycomics and disease markers. Curr Opin Chem Biol. 2009;13:601–607. doi: 10.1016/j.cbpa.2009.08.015. [DOI] [PMC free article] [PubMed] [Google Scholar]
- [7].Pan S, Chen R, Aebersold R, Brentnall TA. Mass spectrometry based glycoproteomics--from a proteomics perspective. Mol Cell Proteomics. 2011;10:R110–003251. doi: 10.1074/mcp.R110.003251. [DOI] [PMC free article] [PubMed] [Google Scholar]
- [8].Thomas DR, Penney CA, Majumder A, Walmsley AM. Evolution of plant-made pharmaceuticals. Int J Mol Sci. 2011;12:3220–3236. doi: 10.3390/ijms12053220. [DOI] [PMC free article] [PubMed] [Google Scholar]
- [9].Yusibov V, Streatfield SJ, Kushnir N. Clinical development of plant-produced recombinant pharmaceuticals: Vaccines, antibodies and beyond. Hum Vaccin. 2011;7:313–321. doi: 10.4161/hv.7.3.14207. [DOI] [PubMed] [Google Scholar]
- [10].Walsh G, Jefferis R. Post-translational modifications in the context of therapeutic proteins. Nat Biotechnol. 2006;24:1241–1252. doi: 10.1038/nbt1252. [DOI] [PubMed] [Google Scholar]
- [11].Nothaft H, Szymanski CM. Protein glycosylation in bacteria: sweeter than ever. Nat Rev Microbiol. 2010;8:765–778. doi: 10.1038/nrmicro2383. [DOI] [PubMed] [Google Scholar]
- [12].Lerouge P, Cabanes-Macheteau M, Rayon C, Fischette-Laine AC, et al. N-glycoprotein biosynthesis in plants: recent developments and future trends. Plant Mol Biol. 1998;38:31–48. [PubMed] [Google Scholar]
- [13].Bardor M, Faveeuw C, Fitchette AC, Gilbert D, et al. Immunoreactivity in mammals of two typical plant glyco-epitopes, core alpha(1,3)-fucose and core xylose. Glycobiology. 2003;13:427–434. doi: 10.1093/glycob/cwg024. [DOI] [PubMed] [Google Scholar]
- [14].Gomord V, Fitchette AC, Menu-Bouaouiche L, Saint-Jore-Dupas C, et al. Plant-specific glycosylation patterns in the context of therapeutic protein production. Plant Biotechnol J. 2010;8:564–587. doi: 10.1111/j.1467-7652.2009.00497.x. [DOI] [PubMed] [Google Scholar]
- [15].Shoji Y, Chichester JA, Jones RM, Manceva SD, et al. Plant-based rapid production of recombinant subunit hemagglutinin vaccines targeting H1N1 and H5N1 influenza. Human Vaccines. 2011;7:41–50. doi: 10.4161/hv.7.0.14561. [DOI] [PubMed] [Google Scholar]
- [16].Zaia J. Mass spectrometry of oligosaccharides. Mass Spectrom Rev. 2004;23:161–227. doi: 10.1002/mas.10073. [DOI] [PubMed] [Google Scholar]
- [17].Rebecchi KR, Wenke JL, Go EP, Desaire H. Label-free quantitation: a new glycoproteomics approach. J Am Soc Mass Spectrom. 2009;20:1048–1059. doi: 10.1016/j.jasms.2009.01.013. [DOI] [PubMed] [Google Scholar]
- [18].Anderson L, Hunter CL. Quantitative mass spectrometric multiple reaction monitoring assays for major plasma proteins. Mol Cell Proteomics. 2006;5:573–588. doi: 10.1074/mcp.M500331-MCP200. [DOI] [PubMed] [Google Scholar]
- [19].Addona TA, Abbatiello SE, Schilling B, Skates SJ, et al. Multi-site assessment of the precision and reproducibility of multiple reaction monitoring-based measurements of proteins in plasma. Nat Biotechnol. 2009;27:633–641. doi: 10.1038/nbt.1546. [DOI] [PMC free article] [PubMed] [Google Scholar]
- [20].Schiess R, Wollscheid B, Aebersold R. Targeted proteomic strategy for clinical biomarker discovery. Mol Oncol. 2009;3:33–44. doi: 10.1016/j.molonc.2008.12.001. [DOI] [PMC free article] [PubMed] [Google Scholar]
- [21].Werner JJ, Ptak AC, Rahm BG, Zhang S, Richardson RE. Absolute quantification of Dehalococcoides proteins: enzyme bioindicators of chlorinated ethene dehalorespiration. Environ Microbiol. 2009;11:2687–2697. doi: 10.1111/j.1462-2920.2009.01996.x. [DOI] [PubMed] [Google Scholar]
- [22].Pandhal J, Ow SY, Noirel J, Wright PC. Improving N-glycosylation efficiency in Escherichia coli using shotgun proteomics, metabolic network analysis, and selective reaction monitoring. Biotechnol Bioeng. 2011;108:902–912. doi: 10.1002/bit.23011. [DOI] [PubMed] [Google Scholar]
- [23].Edelhoch H. Spectroscopic determination of tryptophan and tyrosine in proteins. Biochemistry. 1967;6:1948–1954. doi: 10.1021/bi00859a010. [DOI] [PubMed] [Google Scholar]
- [24].Pace CN, Vajdos F, Fee L, Grimsley G, Gray T. How to measure and predict the molar absorption coefficient of a protein. Protein Sci. 1995;4:2411–2423. doi: 10.1002/pro.5560041120. [DOI] [PMC free article] [PubMed] [Google Scholar]
- [25].Yang Y, Thannhauser TW, Li L, Zhang S. Development of an integrated approach for evaluation of 2-D gel image analysis: impact of multiple proteins in single spots on comparative proteomics in conventional 2-D gel/MALDI workflow. Electrophoresis. 2007;28:2080–2094. doi: 10.1002/elps.200600524. [DOI] [PubMed] [Google Scholar]
- [26].Hashimoto Y, Zhang S, Blissard GW. Ao38, a new cell line from eggs of the black witch moth, Ascalapha odorata (Lepidoptera: Noctuidae), is permissive for AcMNPV infection and produces high levels of recombinant proteins. BMC Biotechnol. 2010;10:50. doi: 10.1186/1472-6750-10-50. [DOI] [PMC free article] [PubMed] [Google Scholar]
- [27].Carr SA, Huddleston MJ, Bean MF. Selective identification and differentiation of N- and O-linked oligosaccharides in glycoproteins by liquid chromatography-mass spectrometry. Protein Sci. 1993;2:183–196. doi: 10.1002/pro.5560020207. [DOI] [PMC free article] [PubMed] [Google Scholar]
- [28].Cooper CA, Gasteiger E, Packer NH. GlycoMod--a software tool for determining glycosylation compositions from mass spectrometric data. Proteomics. 2001;1:340–349. doi: 10.1002/1615-9861(200102)1:2<340::AID-PROT340>3.0.CO;2-B. [DOI] [PubMed] [Google Scholar]
- [29].Fu D, Chen L, O’Neill RA. A detailed structural characterization of ribonuclease B oligosaccharides by 1H NMR spectroscopy and mass spectrometry. Carbohydr Res. 1994;261:173–186. doi: 10.1016/0008-6215(94)84015-6. [DOI] [PubMed] [Google Scholar]
- [30].Zhang S, Williamson BL. Characterization of protein glycosylation using chip-based nanoelectrospray with precursor ion scanning quadrupole linear ion trap mass spectrometry. J Biomol Tech. 2005;16:209–219. [PMC free article] [PubMed] [Google Scholar]
- [31].Xie H, Riniger J, Chen W. HILIC-MRM assays targeting for analyzing site-specific glycans of multiple-site glycosylated proteins and glycoprotein mixtures. 59th American Society for Mass Spectrometry (ASMS) Conference; Denver, CO. 2011; Jun 5-9, Poster No. ThP 573. [Google Scholar]
- [32].Mir-Shekari SY, Ashford DA, Harvey DJ, Dwek RA, Schulze IT. The glycosylation of the influenza A virus hemagglutinin by mammalian cells. A site-specific study. J Biol Chem. 1997;272:4027–4036. doi: 10.1074/jbc.272.7.4027. [DOI] [PubMed] [Google Scholar]
- [33].Keil W, Niemann H, Schwarz RT, Klenk HD. Carbohydrates of influenza virus. V. Oligosaccharides attached to individual glycosylation sites of the hemagglutinin of fowl plague virus. Virology. 1984;133:77–91. doi: 10.1016/0042-6822(84)90427-6. [DOI] [PubMed] [Google Scholar]
- [34].Keil W, Geyer R, Dabrowski J, Dabrowski U, et al. Carbohydrates of influenza virus. Structural elucidation of the individual glycans of the FPV hemagglutinin by two-dimensional 1H n.m.r. and methylation analysis. EMBO J. 1985;4:2711–2720. doi: 10.1002/j.1460-2075.1985.tb03991.x. [DOI] [PMC free article] [PubMed] [Google Scholar]
- [35].Xu R, Ekiert DC, Krause JC, Hai R, et al. Structural basis of preexisting immunity to the 2009 H1N1 pandemic influenza virus. Science. 2010;328:357–360. doi: 10.1126/science.1186430. [DOI] [PMC free article] [PubMed] [Google Scholar]
- [36].Zhang W, Qi J, Shi Y, Li Q, et al. Crystal structure of the swine-origin A (H1N1)-2009 influenza A virus hemagglutinin (HA) reveals similar antigenicity to that of the 1918 pandemic virus. Protein Cell. 2011;1:459–467. doi: 10.1007/s13238-010-0059-1. [DOI] [PMC free article] [PubMed] [Google Scholar]
- [37].Blake TA, Williams TL, Pirkle JL, Barr JR. Targeted N-linked glycosylation analysis of H5N1 influenza hemagglutinin by selective sample preparation and liquid chromatography/tandem mass spectrometry. Anal Chem. 2009;81:3109–3118. doi: 10.1021/ac900095h. [DOI] [PubMed] [Google Scholar]
- [38].Ritchie MA, Gill AC, Deery MJ, Lilley K. Precursor ion scanning for detection and structural characterization of heterogeneous glycopeptide mixtures. J Am Soc Mass Spectrom. 2002;13:1065–1077. doi: 10.1016/S1044-0305(02)00421-X. [DOI] [PubMed] [Google Scholar]
- [39].Lerouge P, Bardor M, Pagny S, Gomord V, Faye L. N-glycosylation of recombinant pharmaceutical glycoproteins produced in transgenic plants: towards an humanisation of plant N-glycans. Curr Pharm Biotechnol. 2000;1:347–354. doi: 10.2174/1389201003378843. [DOI] [PubMed] [Google Scholar]
- [40].Pagny S, Cabanes-Macheteau M, Gillikin JW, Leborgne-Castel N, et al. Protein recycling from the Golgi apparatus to the endoplasmic reticulum in plants and its minor contribution to calreticulin retention. Plant Cell. 2000;12:739–756. doi: 10.1105/tpc.12.5.739. [DOI] [PMC free article] [PubMed] [Google Scholar]
- [41].Luna LG, Williams TL, Pirkle JL, Barr JR. Ultra performance liquid chromatography isotope dilution tandem mass spectrometry for the absolute quantification of proteins and peptides. Anal Chem. 2008;80:2688–2693. doi: 10.1021/ac701945h. [DOI] [PubMed] [Google Scholar]
- [42].Williams TL, Luna L, Guo Z, Cox NJ, et al. Quantification of influenza virus hemagglutinins in complex mixtures using isotope dilution tandem mass spectrometry. Vaccine. 2008;26:2510–2520. doi: 10.1016/j.vaccine.2008.03.014. [DOI] [PubMed] [Google Scholar]
Associated Data
This section collects any data citations, data availability statements, or supplementary materials included in this article.