

Abstract
Objective
To examine the impact of key laboratory and race/ethnicity data on the prediction of in-hospital mortality for congestive heart failure (CHF) and acute myocardial infarction (AMI).
Data Sources
Hawaii adult hospitalizations database between 2009 and 2011, linked to laboratory database.
Study Design
Cross-sectional design was employed to develop risk-adjusted in-hospital mortality models among patients with CHF (n = 5,718) and AMI (n = 5,703).
Data Collection/Extraction Methods
Results of 25 selected laboratory tests were requested from hospitals and laboratories across the state and mapped according to Logical Observation Identifiers Names and Codes standards. The laboratory data were linked to administrative data for each discharge of interest from an all-payer database, and a Master Patient Identifier was used to link patient-level encounter data across hospitals statewide.
Principal Findings
Adding a simple three-level summary measure based on the number of abnormal laboratory data observed to hospital administrative claims data significantly improved the model prediction for inpatient mortality compared with a baseline risk model using administrative data that adjusted only for age, gender, and risk of mortality (determined using 3M’s All Patient Refined Diagnosis Related Groups classification). The addition of race/ethnicity also improved the model.
Conclusions
The results of this study support the incorporation of a simple summary measure of laboratory data and race/ethnicity information to improve predictions of in-hospital mortality from CHF and AMI. Laboratory data provide objective evidence of a patient’s condition and therefore are accurate determinants of a patient’s risk of mortality. Adding race/ethnicity information helps further explain the differences in in-hospital mortality.
Keywords: In-hospital mortality, risk-adjusted model, congestive heart failure, acute myocardial infarction
Cardiovascular disease continues as the leading cause of death in the United States (Jones, Podolsky, and Greene 2012) and has been identified as a priority area for the reporting of hospital-based quality measures. While the use of process measures has been widely promoted as a standard method to assess patient care, outcome measures such as mortality, are considered to more directly reflect the quality of patient care (Jarman 2008). Indeed, 30-day risk-standardized mortality rates (RSMR) have become standard components of public reports and pay-for-performance programs, with the Centers for Medicare and Medicaid Services publicly reporting hospital-specific RSMR for patients with acute myocardial infarction (AMI) and heart failure since 2007 (Krumholz and Normand 2008).
The advantages and disadvantages of using administrative/claims data to estimate RSMR have been well described. Relatively accessible and low-cost to obtain, administrative/claims data can provide estimates of RSMR that are similar to those derived from medical record data (Krumholz et al. 2006). However, concerns that these estimates may still substantially underestimate disease severity and give a false impression of health care quality have led to efforts to supplement administrative/claims data with additional information, including conditions that are present on admission (POA), pharmacy data, clinical laboratory results, vital signs, and patient race/ethnicity (Iezzoni et al. 1992; Hannan et al. 1997; Pine et al. 1997, 2007; Tabak, Johannes, and Silber 2007).
The concept of using such “enhanced” administrative data to more accurately estimate RSMR has gained traction with the burgeoning use of electronic medical records and other data.
While earlier studies demonstrated that the addition of laboratory results to administrative/claims data improves estimates of RSMR (Pine et al. 1997, 2007; Fry et al. 2007; Tabak, Johannes, and Silber 2007), the recent adoption of Logical Observation Identifiers Names and Codes (LOINC) and advances in electronic health data technology have now lowered the cost and increased the feasibility of linking these two types of data. Similarly, the efforts to obtain detailed information on patient race/ethnicity have aided efforts to better understand health disparities among minority populations. However, little is known about the extent to which inclusion of race/ethnicity data improves prediction of in-hospital mortality (Nijjar et al. 2010). This question is particularly relevant in Hawaii and other “majority minority” states with racially and ethnically diverse populations.
The goal of this study was to address the research question: Can we use a simple count of the number of abnormal results from standard set of laboratory data and race/ethnicity information to improve the performance of a widely adopted and frequently used mortality model? For this purpose, we utilized an administrative all-payer hospital discharge database and a commonly used risk-of-mortality (ROM) models familiar to providers, payers, and state and federal health care data organizations, to examine the impact of patient-specific laboratory test results in improving in-hospital mortality prediction.
Methods
Data Sources
Administrative Data
We used the statewide, all-payer, all-visit hospital administrative/claims database from the Hawaii Health Information Corporation that includes summary records for each hospitalization, including patient demographics, diagnoses including POA and procedures. For hospitalizations between 2009 and 2011, we calculated the ROM for each patient, based on the All Patient Refined-Diagnosis Related Group (APR-DRG) classification system and POA diagnoses. The ROM categories of “minor,” “moderate,” “severe,” and “extreme” provide an assessment of risk based on age, surgical procedure, comorbidity, and principal diagnosis that has been validated and utilized by other investigators (Iezzoni et al. 1995; Romano and Chan 2000; Shukla, Fisher, and Fisher 2002; Baram et al. 2008). Because only a few patients (n ≤ 3) died in-hospital and were classified as “minor” ROM, we combined the “minor” and “moderate” ROM classes into a single category.
Laboratory Data
Based on prior studies (Pine et al. 1997; Fry et al. 2007; McCullough et al. 2011), we requested patient-specific laboratory results for 29 selected tests from all 24 nonfederal hospitals and the two independent laboratories that serve these hospitals across the state. Of the 24 hospitals, four could not submit data due to the lack of an electronic interface, incomplete data transfer, or other technical limitations. For the 20 participating hospitals, which accounted for 98.4 percent of discharges, the 29 test results were mapped according to LOINC standards and were linked to the administrative data for each discharge. We used a Master Patient Identifier to link patient-level encounter data across hospitals statewide.
The laboratory data included 29 test values. Four were excluded from analyses: gamma-glutamyl transpeptidase because of very low frequency of determination (about 99 percent missing) and three due to colinearity (International Normalized Ratio [INR] with prothrombin time, hematocrit with hemoglobin, and base excess with bicarbonate). The following 25 laboratory tests were included: albumin, alkaline phosphatase, brain natriuretic peptide (BNP), bicarbonate, bilirubin, blood urea nitrogen (BUN), calcium, chloride, creatine kinase, creatinine, glucose, hemoglobin, pO2, partial thromboplastin, phosphate, platelet count, potassium, prothrombin time, serum glutamic oxaloacetic transaminase, serum glutamic-pyruvic transaminase, sodium, troponin I, white blood count, pCO2, and arterial pH. For missing lab values, we compared mortality rates between patients with missing values and those with lab values within the normal reference range using Chi-squared test. For majority of the labs, mortality rates were similar between the two groups. Based on this, we treated missing lab values as normal in the following analyses.
All calculations were based on admission laboratory tests, which were defined as the first test results available during each hospitalization. Because patients who undergo major surgical procedures may have obtained their laboratory tests prior to hospital admission, we utilized test results that were performed closest to (but not more than 3 days from) the day of admission.
Race/Ethnicity
Race/ethnicity information was transmitted electronically with the administrative data that were submitted by each hospital. One primary race/ethnicity was reported for each patient, with the six largest groups (Japanese, Chinese, Native Hawaiian, Filipino, Other Pacific Islander, Caucasian) accounting for 90 percent of the population. The remaining 10 percent were included into a single “Other” category.
Study Sample
Based on the definition of Agency for Healthcare Research and Quality (AHRQ) Inpatient Quality Indicators version 4.5 (Agency for Healthcare Research and Quality 2013), eligible hospital admissions were identified by ICD-9-CM codes for congestive heart failure (CHF) and AMI. All adults (age ≥18 years) discharged with a principal diagnosis of CHF or AMI from 2009 through 2011 were included (CHF: 8,724 discharges; AMI: 6,633 discharges). Hospitalizations resulting from a transfer from another health care institution were excluded (CHF: 24 discharges; AMI: 49 discharges). To ensure statistical independence, patient-level data were analyzed using the last hospitalization of each patient. The final analysis dataset contains 5,718 CHF patients and 5,703 AMI patients.
Data Analysis
Patient characteristics were summarized by descriptive statistics: means (standard deviations) for continuous variables, and frequencies (percentages) for categorical variables. For each disease (CHF or AMI), bivariate associations were first examined between in-hospital mortality status and administrative and lab data variables. Chi-squared tests or Fisher’s exact tests were used for categorical variables. For continuous variables, two sample t-tests or nonparametric Wilcoxon tests were used, depending on the distribution of the data. On the basis of the reference interval for each laboratory test, we classified each laboratory result as normal (scored as 0) or abnormal (score as 1). We then created a global “lab severity score,” which was the total number of abnormal laboratory test results for each patient. For example, if a patient’s laboratory results for BNP and BUN were abnormal and the results for the other 23 lab tests were normal, the patient’s lab severity would be 2. Lab severity values were categorized into three approximately equal sized groups (i.e., tertiles) for each disease, denoted as “mild,” “moderate,” and “severe.”
To predict in-hospital mortality for patients with CHF and AMI, we started with hierarchical generalized linear models to account for the clustered observations within hospitals. In these models, the log-odds of in-hospital mortality were estimated using a random hospital effect and fixed hospital class (rural vs. urban). As both the fixed hospital class and random hospital effects were not statistically significant (results not shown), we reduced the models to multivariable logistic models for ease of interpretation. Our baseline model (Model 1) included ROM class, patient age, and gender. Model 2 examined the value of adding laboratory test results to Model 1, and Model 3 examined the value of adding race/ethnicity to Model 2.
We used likelihood ratio tests to evaluate each model’s performance compared with that of the previous model. Improvement of area under the curve (AUC) for receiver operating characteristic (ROC) of predictive values (or c-statistic) was calculated to assess the model’s accuracy in predicting in-hospital mortality. To validate our models, 10-fold cross-validation was applied separately for CHF and AMI. For the cross-validation, the original data were randomly partitioned into 10 nearly equal subsets. Nine-tenths of the data were treated as the derivation set and the remaining one-tenth of the data were treated as the validation set. Multivariable logistic regressions of the three models were fitted using the derivation set, and predictive values from the validation set were computed using the fitted models. This procedure was repeated a total of 10 times, treating each of the subsets in turn as the validation set. The AUCs for ROC of predictive values from the 10 validation sets was determined for each model to evaluate model validity using means and standard deviation of AUC and compared to the corresponding c-statistic obtained from the original full dataset.
We then investigated how the risk-adjusted mortality models affect the relative ranking of major hospitals involved for each disease. The expected risk-adjusted mortality rate was computed based on each model developed and then compared with the unadjusted observed mortality rate for each hospital. For each disease, hospital ranks were determined by the ratios of observed to expected mortality rate among the top 10 hospitals based on patient volume in Hawaii. For each ratio, a 90 percent confidence interval (CI) was computed based on Poisson distribution. All analyses were performed in SAS 9.3 (SAS Version 9.3; SAS Institute Inc., Cary, NC, USA) and p < 0.05 was considered statistically significant.
Results
Our analysis included 5,718 patients hospitalized with CHF and 5,703 patients hospitalized with AMI as their principal diagnoses (Table1). The average age of patients was 69.8 years (SD = 16.3) for CHF and 68.4 years (SD = 14.9) for AMI. Reflecting the state’s diverse population, Caucasians, Japanese, Native Hawaiians, and Filipinos accounted for approximately 80 percent of the study sample (CHF: 27 percent Caucasian, 18 percent Japanese, 20 percent Native Hawaiian, and 17 percent Filipino; AMI: 31 percent Caucasian, 20 percent Japanese, 14 percent Native Hawaiian, and 17 percent Filipino). Several variables were significantly associated with in-hospital mortality status, including patient age, payer type, and race/ethnicity. Although there were significant differences in the race/ethnicity distribution, these differences were not consistent between the diseases. For example, in-hospital mortality for Native Hawaiians was lower than for Caucasians (4 percent vs. 7 percent) for CHF, while Native Hawaiians showed a higher rate than Caucasians (10 percent vs. 6 percent) for AMI. As expected, compared with patients who survived to hospital discharge, in-hospital mortality was associated with increased ROM, higher number of abnormal labs, and longer length of stay.
Table 1.
Bivariate Association with Disease-Specific In-Hospital Mortality
| Categorical Variable | In-Hospital Death by Congestive Heart Failure | In-Hospital Death by Acute Myocardial Infarction | ||||||
|---|---|---|---|---|---|---|---|---|
| Total (n = 5,718) n (%) | No (n = 5,384) n (row %) | Yes (n = 334) n (row %) | p-value | Total (n = 5,703) n (%) | No (n = 5,223) n (row %) | Yes (n = 480) n (row %) | p-value | |
| Gender | ||||||||
| Female | 2,488 (44) | 2,344 (94) | 144 (6) | 0.88 | 2,244 (39) | 2,046 (91) | 198 (9) | 0.38 |
| Male | 3,230 (56) | 3,040 (94) | 190 (6) | 3,459 (61) | 3,177 (92) | 282 (8) | ||
| Race/ethnicity | ||||||||
| Caucasian | 1,485 (27) | 1,388 (93) | 97 (7) | <0.001 | 1,706 (31) | 1,600 (94) | 106 (6) | <0.001 |
| Chinese | 293 (5) | 270 (92) | 23 (8) | 280 (5) | 246 (88) | 34 (12) | ||
| Filipino | 942 (17) | 888 (94) | 54 (6) | 950 (17) | 883 (93) | 67 (7) | ||
| Hawaiian | 1,093 (20) | 1,045 (96) | 48 (4) | 776 (14) | 701 (90) | 75 (10) | ||
| Japanese | 994 (18) | 917 (92) | 77 (8) | 1,068 (20) | 949 (89) | 119 (11) | ||
| Other PI | 453 (8) | 304 (98) | 6 (2) | 443 (8) | 227 (92) | 21 (8) | ||
| Other* | 310 (6) | 435 (96) | 18 (4) | 248 (5) | 411 (93) | 32 (7) | ||
| Age (years) | ||||||||
| <60 | 1,534 (27) | 1,490 (97) | 44 (3) | <0.001 | 1,692 (30) | 1,624 (96) | 68 (4) | <0.001 |
| 60–69 | 1,031 (18) | 986 (96) | 45 (4) | 1,286 (23) | 1,181 (92) | 105 (8) | ||
| 70–79 | 1,175 (21) | 1,101 (94) | 74 (6) | 1,144 (20) | 1,055 (92) | 89 (8) | ||
| ≥80 | 1,978 (35) | 1,807 (91) | 171 (9) | 1,581 (28) | 1,363 (86) | 218 (14) | ||
| Payer type | ||||||||
| Medicaid | 726 (13) | 703 (97) | 23 (3) | <0.001 | 546 (10) | 511 (94) | 35 (6) | <.001 |
| Medicare | 3,809 (67) | 3,543 (93) | 266 (7) | 3,254 (57) | 2,892 (89) | 362 (11) | ||
| Private | 922 (16) | 889 (96) | 33 (4) | 1,642 (29) | 1,579 (96) | 63 (4) | ||
| Other | 261 (5) | 249 (95) | 12 (5) | 261 (5) | 241 (92) | 20 (8) | ||
| Patient’s area of residence† | ||||||||
| Rural | 1,776 (31) | 1,661 (94) | 115 (6) | 0.17 | 2,091 (37) | 1,949 (93) | 142 (7) | <0.001 |
| Urban | 3,931 (69) | 3,713 (94) | 218 (6) | 3,590 (63) | 3,252 (91) | 338 (9) | ||
| Admission type | ||||||||
| Elective | 181 (3) | 175 (97) | 6 (3) | 0.24 | 139 (2) | 136 (98) | 3 (2) | <0.001 |
| Emergency | 4,458 (78) | 4,188 (94) | 270 (6) | 3,781 (66) | 3,399 (90) | 382 (10) | ||
| Urgent | 1,079 (19) | 1,021 (95) | 58 (5) | 1,783 (31) | 1,688 (95) | 95 (5) | ||
| Hospital class† | ||||||||
| Rural | 1,534 (27) | 1,429 (93) | 105 (7) | 0.05 | 987 (17) | 890 (90) | 97 (10) | 0.079 |
| Urban | 4,184 (73) | 3,955 (95) | 229 (5) | 4,716 (83) | 4,333 (92) | 383 (8) | ||
| 3M risk of mortality | ||||||||
| Minor | 687 (12) | 684 (100) | 3 (0) | <0.001 | 1,303 (23) | 1,302 (100) | 1 (0) | <0.001 |
| Moderate | 2,424 (42) | 2,370 (98) | 54 (2) | 1,797 (32) | 1,760 (98) | 37 (2) | ||
| Major | 1,977 (35) | 1,833 (93) | 144 (7) | 1,842 (32) | 1,687 (92) | 155 (8) | ||
| Extreme | 630 (11) | 497 (79) | 133 (21) | 761 (13) | 474 (62) | 287 (38) | ||
| Lab severity (categorical)‡ | ||||||||
| Mild | 1,690 (30) | 1,668 (99) | 22 (1) | <0.001 | 1,847 (32) | 1,824 (99) | 23 (1) | <0.001 |
| Moderate | 2,057 (36) | 1,994 (97) | 63 (3) | 2,078 (36) | 2,001 (96) | 77 (4) | ||
| Severe | 1,971 (34) | 1,722 (87) | 249 (13) | 1,778 (31) | 1,398 (79) | 380 (21) | ||
| Continuous Variable | Mean ± SD (range) | Mean ± SD (range) | Mean ± SD (range) | Mean ± SD (range) | Mean ± SD (range) | Mean ± SD (range) | ||
| Lab severity (continuous) | 7.4 ± 3.4 (0–20) | 7.2 ± 3.3 (0–20) | 10.8 ± 3.7 (0–20) | <0.001 | 6.9 ± 4.1 (0–24) | 6.4 ± 3.7 (0–24) | 12.0 ± 4.2 (0–22) | <0.001 |
| Length of hospital stay | 5.6 ± 7.5 (1–194) | 5.3 ± 6.6 (1–194) | 10.1 ± 15.4 (1–176) | <0.001 | 5.3 ± 7.8 (1–216) | 5.2 ± 7.2 (1–216) | 7.1 ± 12.4 (1–99) | 0.009 |
Note: “Other” includes black, Native American, Other Asian, Hispanic, etc.
Oahu area was defined as Urban and other areas in Hawaii were defined as Rural.
Lab Severity was categorized by tertiles for all patients for each specific disease and the minimum and maximum values of the tertiles were: (1) Congestive Heart Failure: Mild = 0–5, Moderate = 6–8, and Severe = 9–20. (2) Acute Myocardial Infarction: Mild = 0–3, Moderate = 4–6, and Severe = 10–24.
For categorical variable, Chi-squared tests or Fisher’s exact tests were performed.
For continuous variables, two sample t-tests or nonparametric Wilcoxon tests (if normality assumption was violated) were performed.
Other PI = Other Pacific Islanders.
3M Risk of Mortality = risk of mortality assigned by 3M based on administrative/claims data only.
Lab Severity = the number of abnormalities from admission lab at last hospitalization for each patient.
The number of lab abnormalities was categorized by tertiles with the minimum and maximum values: Mild = 0–5, Moderate = 6–8, and Severe = 9–20 for CHF; Mild = 0–4, Moderate = 5–8, and Severe = 9–24 for AMI.
Table2 shows the risk-adjusted in-hospital mortality models for CHF. In Model 1, age but not gender was significantly associated with in-hospital mortality. Patients with a major (OR = 3.94, 95% CI = 2.85–5.44) or extreme (OR = 12.88, 95% CI = 9.19–18.07) ROM were more likely to die before discharge than patients with a mild/moderate ROM. Lab severity, added in Model 2, was independently associated with in-hospital mortality. Race/ethnicity, added in Model 3, was also independently associated with in-hospital mortality. Compared to Caucasians, Filipinos (OR = 0.69, 95% CI = 0.48–1.00), Native Hawaiians (OR = 0.68, 95% CI = 0.47–1.00), Other Pacific Islanders (OR = 0.35, 95% CI = 0.15–0.83), and Others (OR = 0.55, 95% CI = 0.32–0.94) were less likely to die prior to hospital discharge.
Table 2.
Summary of Risk-Adjusted In-Hospital Mortality Models: Congestive Heart Failure
| Variable | Label | Odds Ratio (95% CI) | ||
|---|---|---|---|---|
| Model 1 | Model 2 | Model 3 | ||
| 3M ROM | Major vs. Mild or Moderate | 3.94*** (2.85–5.44) | 2.74** (1.96–3.82) | 2.74*** (1.97–3.82) |
| Extreme vs. Mild or Moderate | 12.88*** (9.19–18.07) | 6.83*** (4.78–9.75) | 6.87*** (4.80–9.82) | |
| Gender | Male vs. Female | 1.17 (0.92–1.48) | 1.08 (0.85–1.37) | 1.06 (0.83–1.35) |
| Age (years) | 60–69 vs. < 60 | 1.17 (0.75–1.82) | 1.12 (0.72–1.75) | 1.03 (0.68–1.66) |
| 70–79 vs. <60 | 1.37 (0.92–2.05) | 1.46† (0.97–2.19) | 1.35 (0.90–2.04) | |
| ≥80 vs. <60 | 2.06*** (1.44–2.95) | 2.28*** (1.59–3.27) | 2.02*** (1.38–2.94) | |
| Lab severity | Moderate vs. Mild | 1.75* (1.06–2.88) | 1.77* (1.07–2.90) | |
| Severe vs. Mild | 5.52*** (3.48–8.75) | 5.65*** (3.56–8.97) | ||
| Race/ethnicity | Chinese vs. Caucasian | 0.94 (0.57–1.56) | ||
| Filipino vs. Caucasian | 0.69* (0.48–1.00) | |||
| Hawaiian vs. Caucasian | 0.68* (0.47–1.00) | |||
| Japanese vs. Caucasian | 0.83 (0.60–1.17) | |||
| Other Pacific Islander vs. Caucasian | 0.35* (0.15–0.83) | |||
| Other vs. Caucasian | 0.55* (0.32–0.94) | |||
| Summary Statistics | ||||
| AUC: mean ± SE (95% CI) | 0.775 ± 0.012 (0.751–0.799) | 0.815 ± 0.011 (0.794–0.836) | 0.819 ± 0.011 (0.798–0.840) | |
| (-2)*log likelihood | 2,160.08 | 2,055.17 | 2,041.85 | |
| Model d.f. | 6 | 8 | 14 | |
| Δχ2 | 306.30 | 101.90 | 13.32 | |
| p-value | <0.001 | <0.001 | 0.038 | |
| 10-fold Cross-Validation | ||||
| AUCcv: mean ± SD | 0.773 ± 0.026 | 0.810 ± 0.021 | 0.810 ± 0.021 | |
Notes: p < 0.10
p < 0.05
p < 0.01
p < 0.001.
Model 1 = 3M Risk of Mortality (ROM) + Gender + Age.
Model 2 = 3M ROM + Gender + Age + Lab Severity.
Model 3 = 3M ROM + Gender + Age + Lab Severity + Race/Ethnicity.
3M ROM = risk of mortality assigned by 3M based on administrative/claims data only.
Lab Severity = total number of abnormalities from admission lab at last hospitalization (the number of lab abnormalities was categorized by tertiles with the minimum and maximum values: Mild = 0–5, Moderate = 6–8, and Severe = 9–20).
AUC = area under the curve of predicted values or c-statistic.
Δχ2 = difference in (-2)*log likelihood between models.
Model d.f. = the number of model parameters.
p-value = p-value of Chi-squared (or log likelihood) test comparing two models.
Model 1 was compared with the intercept-only model.
AUCcv = area under the curve of predicted values from 10 validation sets.
Compared with our baseline model, the addition of lab severity (Model 2) substantially improved model fitting (p < 0.001), with an increase in c-statistic from 0.775 to 0.815 (Figure1A). The addition of race/ethnicity (Model 3) resulted in a further improvement in model fit that was modest (c-statistic = 0.819) but still significant (p = 0.038). Using a 5 percent mortality cut-point, similar to the observed CHF mortality rate in our data, Models 2 and 3 would assign 505 and 605 more patients correctly than that of Model 1.
Figure 1.
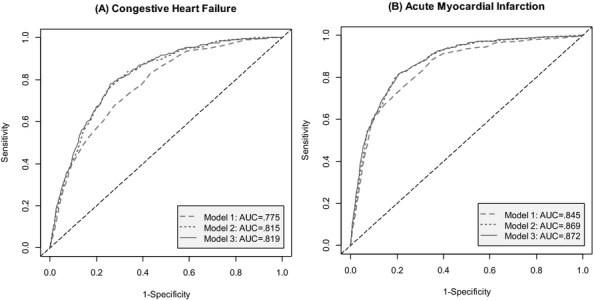
Receiver Operating Characteristic Curves of Predicted Values of Risk-Adjusted In-Hospital Mortality Models
Notes: Model 1 = 3M Risk of Mortality (ROM) + Gender + Age; Model 2 = 3M ROM + Gender + Age + Lab Severity; Model 3 = 3M ROM + Gender + Age + Lab Severity + Race/Ethnicity.
Table3 shows our risk-adjusted in-hospital mortality models for AMI. Similar to CHF, age and ROM were significant predictors in our baseline model (Model 1). Patients in the major (OR = 6.14, 95% CI = 4.21–8.97) and extreme (OR = 42.24, 95% CI = 29.33–60.85) ROM classes were more likely to die in-hospital than were patients in the mild/moderate ROM class. Lab severity (Model 2) and race/ethnicity (Model 3) were independently associated with in-hospital mortality. Only Native Hawaiians had greater risk of in-hospital mortality than Caucasians (OR = 1.51, 95% CI = 1.05–2.15).
Table 3.
Summary of Risk-Adjusted In-Hospital Mortality Models: Acute Myocardial Infarction
| Variable | Label | Odds Ratio (95% CI) | ||
|---|---|---|---|---|
| Model 1 | Model 2 | Model 3 | ||
| 3M ROM | Major vs. Mild or Moderate | 6.14*** (4.21–8.97) | 3.52 (2.37–5.24) | 3.39*** (2.28–5.06) |
| Extreme vs. Mild or Moderate | 42.24*** (29.33–60.85) | 17.35** (11.62–25.90) | 17.17*** (11.49–25.65) | |
| Gender | Male vs. Female | 1.07 (0.86–1.34) | 1.02 (0.82–1.28) | 1.04 (0.83–1.30) |
| Age (years) | 60–69 vs. < 60 | 1.74** (1.21–2.50) | 1.71** (1.19–2.47) | 1.77** (1.23–2.56) |
| 70–79 vs. <60 | 1.14 (0.78–1.66) | 1.13 (0.77–1.65) | 1.20 (0.82–1.76) | |
| ≥80 vs. <60 | 1.51* (1.08–2.10) | 1.70** (1.21–2.38) | 1.76** (1.23–2.56) | |
| Lab severity | Moderate vs. Mild | 1.52† (0.93–2.49) | 1.50 (0.91–2.46) | |
| Severe vs. Mild | 4.82*** (3.01–7.71) | 4.77*** (2.98–7.65) | ||
| Race/Ethnicity | Chinese vs. Caucasian | 1.51† (0.94–2.40) | ||
| Filipino vs. Caucasian | 0.85 (0.59–1.20) | |||
| Hawaiian vs. Caucasian | 1.51* (1.05–2.15) | |||
| Japanese vs. Caucasian | 1.33† (0.97–1.83) | |||
| Other Pacific Islander vs. Caucasian | 1.39 (0.80–2.42) | |||
| Other vs. Caucasian | 1.10 (0.69–1.74) | |||
| Summary Statistics | ||||
| AUC: mean ± SE (95% CI) | 0.844 ± 0.009 (0.827–0.863) | 0.868 ± 0.008 (0.852–0.884) | 0.872 ± 0.008 (0.856–0.887) | |
| (-2)*log likelihood | 2,365.44 | 2,269.08 | 2,254.99 | |
| Model d.f. | 6 | 8 | 14 | |
| Δχ2 | 763.92 | 96.36 | 14.09 | |
| p-value | <0.001 | <0.001 | 0.029 | |
| 10-fold Cross-Validation | ||||
| AUCcv: mean ± SD | 0.843 ± 0.021 | 0.864 ± 0.016 | 0.867 ± 0.017 | |
Notes: p < 0.10
p < 0.05
p < 0.01
p < 0.001.
Model 1 = 3M Risk of Mortality (ROM) + Gender + Age.
Model 2 = 3M ROM + Gender + Age + Lab Severity.
Model 3 = 3M ROM + Gender + Age + Lab Severity + Race/Ethnicity.
3M ROM = risk of mortality assigned by 3M based on administrative/claims data only.
Lab Severity = the total number of abnormalities from admission lab at last hospitalization (The number of lab abnormalities was categorized by tertiles with the minimum and maximum values: Mild = 0–4, Moderate = 5–8, and Severe = 9–24).
AUC = area under the curve of predicted values or c-statistic.
Δχ2 = difference in (-2)*log likelihood between models.
Model d.f. = the number of model parameters.
p-value = p-value of Chi-squared (or log likelihood) test between two models.
Model 1 was compared with the intercept-only model.
AUCcv = area under the curve of predicted values from 10 validation sets.
Compared to our baseline model, the addition of lab severity (Model 2) resulted in an increase in c-statistic from 0.844 to 0.868 (Figure1B). While the addition of race/ethnicity (Model 3) improved model fit (p = 0.029), the improvement in c-statistic was more modest, although significant (c-statistic = 0.872). Using an 8 percent mortality cut-point, similar to the observed AMI mortality rate in our data, Models 2 and 3 would assign 452 and 527 more patients correctly than that of Model 1.
We assessed our models for each disease using a 10-fold cross-validation. All the average AUCs showed good discrimination power and were close to the observed c-statistics using the full datasets. The average AUCs ranged from 0.773 to 0.810 for CHF (Table2) and from 0.843 to 0.867 for AMI (Table3). Regardless of the model or the disease, standard deviations from the ten validation datasets was small (<0.03), demonstrating the reliability of the risk-adjusted models developed.
Table4 demonstrates the potential impact of the enhanced risk-adjusted mortality models on hospital rankings. Comparing the 10 largest (by patient volume) hospitals in Hawaii, which cover 97 percent of the patients in the study, the addition of laboratory data to the baseline model changed the CHF in-hospital mortality ranking for six institutions and the AMI in-hospital mortality ranking for five institutions. The addition of race/ethnicity slightly changed each hospital’s expected mortality rates, but only impacted the ranking of two hospitals (AMI in-hospital mortality). For example, Hospital B was ranked number 2 for AMI based on unadjusted crude mortality, but it ranked number 6 based on the standard risk model, number 8 with the laboratory enhanced model, and number 7 with the addition of race/ethnicity. For CHF, Hospital A was ranked number 1 and has a significant O/E ratio <1.0 based on the baseline model (Model 1), but it was ranked number 4 with the addition of laboratory and race/ethnicity data. Overall, the statistical significance of the O/E ratio changed from baseline model to Models 2 or 3 for two hospitals for CHF and for one hospital for AMI.
Table 4.
Unadjusted and Adjusted Mortality Rates of Top 10 Hospitals in Patient Volume in Hawaii
| Disease | Hospital ID | Unadjusted | Adjusted by Model 1 | Adjusted by Model 2 | Adjusted by Model 3 | |||||||
|---|---|---|---|---|---|---|---|---|---|---|---|---|
| OMR (%) | Rank | EMR (%) | O/E (90% CI) | Rank | EMR (%) | O/E (90% CI) | Rank | EMR (%) | O/E (90% CI) | Rank | ||
| CHF | Hospital A | 4.07 | 1 | 5.79 | 0.70 (0.50–0.97) | 1 | 4.64 | 0.88 (0.62–1.21) | 4 | 4.68 | 0.87 (0.61–1.20) | 4 |
| Hospital B | 4.89 | 2 | 5.59 | 0.87 (0.69–1.09) | 4 | 5.91 | 0.83 (0.65–1.03) | 3 | 5.91 | 0.83 (0.65–1.03) | 3 | |
| Hospital C | 4.95 | 3 | 6.77 | 0.73 (0.55–1.08) | 2 | 6.59 | 0.75 (0.53–1.04) | 1 | 6.74 | 0.74 (0.52–1.01) | 1 | |
| Hospital D | 5.48 | 4 | 6.53 | 0.84 (0.55–1.23) | 3 | 6.83 | 0.80 (0.52–1.18) | 2 | 6.80 | 0.81 (0.53–1.01) | 2 | |
| Hospital E | 5.97 | 5 | 5.67 | 1.05 (0.76–1.42) | 7 | 6.05 | 0.99 (0.71–1.33) | 5 | 6.14 | 0.97 (0.70–1.31) | 5 | |
| Hospital F | 6.02 | 6 | 6.10 | 0.99 (0.58–1.57) | 5 | 6.00 | 1.00 (0.59–1.18) | 7 | 5.69 | 1.06 (0.63–1.68) | 7 | |
| Hospital G | 6.16 | 7 | 6.00 | 1.03 (0.74–1.39) | 6 | 6.29 | 0.98 (0.70–1.33) | 6 | 5.95 | 1.04 (0.74–1.40) | 6 | |
| Hospital H | 7.20 | 8 | 5.71 | 1.26 (0.97–1.61) | 9 | 5.51 | 1.31 (1.01–1.67) | 9 | 5.51 | 1.31 (1.01–1.67) | 9 | |
| Hospital I | 7.40 | 9 | 6.09 | 1.21 (0.90–1.61) | 8 | 6.32 | 1.17 (0.86–1.55) | 8 | 6.35 | 1.16 (0.86–1.54) | 8 | |
| Hospital J | 9.28 | 10 | 4.87 | 1.90 (1.23–2.82) | 10 | 5.06 | 1.83 (1.18–2.72) | 10 | 5.24 | 1.77 (1.14–2.62) | 10 | |
| AMI | Hospital A | 4.99 | 1 | 6.42 | 0.78 (0.59–1.01) | 2 | 5.94 | 0.84 (0.64–1.09) | 3 | 5.98 | 0.84 (0.64–1.08) | 3 |
| Hospital B | 7.12 | 2 | 6.88 | 1.03 (0.88–1.21) | 6 | 6.61 | 1.08 (0.91–1.26) | 8 | 6.70 | 1.06 (0.90–1.24) | 7 | |
| Hospital C | 7.81 | 4 | 7.83 | 1.00 (0.77–1.27) | 5 | 7.91 | 0.99 (0.76–1.26) | 5 | 7.93 | 0.98 (0.76–1.26) | 5 | |
| Hospital D | 7.55 | 3 | 10.98 | 0.69 (0.47–0.97) | 1 | 10.46 | 0.72 (0.50–1.01) | 1 | 10.86 | 0.70 (0.48–0.98) | 1 | |
| Hospital E | 8.15 | 6 | 9.27 | 0.88 (0.67–1.14) | 3 | 9.84 | 0.83 (0.63–1.08) | 2 | 10.05 | 0.81 (0.61–1.05) | 2 | |
| Hospital F | 9.45 | 7 | 8.49 | 1.11 (0.78–1.54) | 8 | 9.25 | 1.02 (0.72–1.42) | 7 | 8.83 | 1.07 (0.75–1.49) | 8 | |
| Hospital G | 18.15 | 10 | 12.50 | 1.45 (1.16–1.80) | 10 | 12.57 | 1.44 (1.07–1.66) | 10 | 13.09 | 1.39 (1.11–1.72) | 10 | |
| Hospital H | 8.12 | 5 | 8.87 | 0.92 (0.70–1.17) | 4 | 8.80 | 0.92 (0.71–1.18) | 4 | 8.72 | 0.93 (0.72–1.19) | 4 | |
| Hospital I | 11.19 | 8 | 10.66 | 1.05 (0.76–1.41) | 7 | 11.20 | 1.00 (0.73–1.34) | 6 | 10.99 | 1.02 (0.74–1.37) | 6 | |
| Hospital J | 14.29 | 9 | 11.77 | 1.21 (0.72–1.93) | 9 | 11.45 | 1.25 (0.74–1.98) | 9 | 11.09 | 1.29 (0.76–2.05) | 9 | |
Notes 90% CI was computed based on Poisson distribution. CI > 1.0 indicates that the hospital experienced more deaths than expected (in Dark Gray). CI < 1.0 indicates that the hospital experienced less deaths than expected (in Light Gray). CI including 1 indicates that the hospital experienced nothing more or less deaths than expected (in White).
AMI, acute myocardial infarction; CHF, congestive heart failure; EMR, expected (or adjusted) mortality rate; OMR, observed (or crude) mortality rate; O/E, OMR divided by EMR. Smaller value is better; Model 1, 3M Risk of Mortality (ROM) + Gender + Age; Model 2, 3M ROM + Gender + Age + Lab Severity; Model 3, 3M ROM + Gender + Age + Lab Severity + Race/Ethnicity; Rank, hospital rank based on OMR or O/E. Smaller rank order is better.
Discussion
The goal of this study was to evaluate the incremental benefit of supplementing administrative data with available clinical and demographic information to improve the validity of comparisons of risk-adjusted mortality. As these comparisons become standard components of many pay-for-performance programs and public reports, it has become increasingly important to develop measures that accurately reflect the reality of the care provided. Similar to others (Smith et al. 1991; Pine et al. 1997), our intent was not to identify the most parsimonious or most sophisticated risk-adjustment model, or to compare the relative value of administrative vs clinical data, but to show the mortality prediction improvement by adding laboratory and race/ethnicity data to a widely used mortality model. For this purpose, our base model employed 3M’s APR-DRG ROM classification that is commonly utilized by providers, payers, state and federal health care data organizations, including AHRQ and Healthcare Cost and Utilization Project, to assess hospital and provider level outcomes.
Our results build on the findings from prior studies in three important ways. First, we developed a statewide collaboration with hospitals and independent laboratories to facilitate the direct electronic transfer of laboratory test results from hospital/laboratory information systems to augment an all-payer hospital discharge administrative database. Second, in the setting of a “majority minority” population in the state of Hawaii, we evaluated the incremental impact of race/ethnicity on our model to predict in-hospital mortality. Third, like other investigators, we included laboratory test results into our mortality models (Lee et al. 2003; Pine et al. 2007; Tabak, Johannes, and Silber 2007; Escobar et al. 2008; Tabak et al. 2010, 2013, 2014; McCullough et al. 2011). However, in our study we developed a straightforward, standardized approach to utilize laboratory test results that can be replicated and validated by other investigators.
Our results parallel the findings from a study (Pine et al. 2007) that directly incorporated laboratory test results into mortality models. Although this study utilized laboratory data obtained through both medical record abstraction and direct electronic transfer, and included a less ethnically/racially diverse study population than ours, both studies reported a significant improvement in the c-statistic that was similar in size (approximately 0.02). In contrast, Tabak and colleagues reported a larger improvement in their baseline model c-statistic (0.838 to 0.907) using a more complex scoring system (ALaRMS) that incorporates weighted laboratory test results (Tabak et al. 2014) in a general population that significantly differs from our disease-specific population.
To put our results in context, we compared the performance of our simple “lab severity score” with the method proposed by McCullough et al. (2011), which required modifying the ROM class for the incorporated laboratory data (i.e., using the actual lab values, literature review, and expert opinion to estimate the effect of each abnormal lab value on the probability of the patient dying in hospital). When we compared the results of our approach using lab severity (Model 2) to the approach using lab-adjusted ROM class, we found our models showed substantial improvement in the predictive power for both diseases (CHF: χ2d.f.=2 = 66.57, p < 0.001; AMI: χ2d.f.=2 = 49.90, p < 0.001). The c-statistic from our method was 0.018 higher for CHF and 0.011 higher for AMI than the c-statistics from the McCullough method.
Importantly, our study also found that race/ethnicity may be an important factor in predicting in-hospital AMI or CHF mortality. We examined the possible statistical interactions between race/ethnicity and other variables (ROM classification, lab severity, and gender). None of the interactions was found to be significant (results not shown), which implies the independent impact of race/ethnicity to risk adjustment. Our finding that Native Hawaiians, Filipinos, and Pacific Islanders have a lower inpatient CHF mortality rate than Caucasians parallels findings reported by Brown and colleagues, who found that inpatient mortality rates differed by race (Brown et al. 2005). The finding that Native Hawaiians are more likely to die from AMI than Caucasians suggests that the relationship between race/ethnicity and outcomes is not uniform. It also supports the comment by Ash et al. (2012) that mortality estimates that do not incorporate race/ethnicity may substantially miscalculate true levels of risk and, to the extent that they are used for hospital rankings and assessments of quality, may lead to erroneous conclusions.
Current National Quality Forum (NQF) criteria do not recommend adjusting for race/ethnicity in performance outcome measures (NQF, 2014); however, this issue is intensely debated. Those against adjusting for race/ethnicity believe it could mask meaningful differences between groups and potentially “allow” different standards of care. If outcomes are poorer for Native Hawaiians than Caucasians, would risk adjusting by race/ethnicity hide this health disparity and an opportunity for improvement? Conversely, those in favor of risk adjusting for race/ethnicity believe that if we do not account for it, hospitals that serve a disproportionate percentage of the high-risk group may be held accountable for differences in outcomes that are related to race/ethnicity rather than hospital-specific quality of care.
Based on these concerns, the NQF is considering a change in its recommendation considering risk adjustment for race and socioeconomic status acceptable if there is a theoretical basis for its inclusion and if outcomes are stratified prior to risk adjustment to identify potential disparities. Consistent with the NQF, we both adjusted for race/ethnicity and separately stratified our analysis by race/ethnicity. We found that adding laboratory information generally improved our mortality prediction consistently across racial/ethnic groups (results not shown). We concur with Jha and Zaslavsky (2014) that when addressing disparities, stratified, adjusted, and unadjusted scores all have a role in performance measurement.
Health care providers today have a keen interest in risk-adjusted mortality at the hospital level due to hospital inpatient payment rule regulated by Centers for Medicare and Medicaid Services (CMS) (CMS 2014) and other organizations. Our results suggest that the addition of laboratory test results, and to some degree for AMI, the patient race/ethnicity information, improves the accuracy of ROM estimates, and may substantially impact rankings of hospital performance. Indeed, in our ranking of the 10 largest hospitals in Hawaii, six hospitals for CHF and five hospitals for AMI were directly impacted by the addition of these data.
There are several limitations to our study. First, our baseline analysis is based on a risk-of-mortality score (developed by 3M) that includes one of four possible risk categories. Rather than developing a “standard” multivariable prediction model with multiple independent variables, we chose our approach to replicate the type of data and performance rankings received by hospitals across the state of Hawaii and other regions nationally. As an alternative approach, we also evaluated the value of lab and race/ethnicity information using a multivariable model comparable to the one developed by Krumholz et al. (2006) and drew similar conclusions (results not shown). Second, we assumed that all missing laboratory test results were normal, reasoning that clinicians generally only order those laboratory tests that are relevant for their patient’s condition. This was also confirmed by our analysis to compare mortality rates between patients with missing lab tests and patients with normal lab results (results not shown). Such assumption could, however, affect the prediction accuracy of the mortality model. Third, our laboratory score was based on the number of abnormal lab results. This may not fully reflect the true importance of a given lab value as the direction or severity of the abnormality was not taken into consideration. Although the advantage of our aggregated laboratory score is its ease of use, that is, one can easily calculate this by adding the number of abnormal results from a standard set of laboratory tests, we may be underutilizing laboratory test data by weighting each test or each abnormal result equally. As a sensitivity analysis, a limited set of disease-specific lab tests for each disease were identified by selecting those lab tests ordered for at least 80 percent of the patients, and lab severity score was calculated by counting the number of abnormal tests from the limited set. The results were very similar to those presented (results not shown). We are currently investigating a more refined method of laboratory data classification using standardized scoring systems to capture both the direction and severity of abnormal values. Fourth, although our analysis was based on statewide data, our results may not be generalizable to other populations.
Our findings have several important health policy implications. The significant improvement in the ability to predict in-hospital mortality through the inclusion of laboratory data provides strong evidence that these data effectively measure patient severity of illness at the time of admission. To make fair comparisons of clinical performance across hospitals, our study suggests that laboratory data should be included in risk-adjusted models. Also, given that including a race/ethnicity variable increased the predictive power of the models, and the potential differences among racial/ethnic groups, we recommend further studies to address whether our finding on importance of including race/ethnicity information to build ROM model can be applicable in other databases or diseases.
Conclusion
Utilizing Hawaii statewide hospitalization data for CHF and AMI, we developed and validated risk-adjusted in-hospital mortality models using laboratory and race/ethnicity data in addition to administrative data. A simple summary measure of laboratory test results and race/ethnicity information were useful for refining the risk-adjusted models in mortality prediction. Further work is necessary to refine the optimal method to incorporate laboratory data into risk models.
Acknowledgments
Joint Acknowledgment/Disclosure Statement: This project was funded under grant number R01HS19990 from the Agency for Healthcare Research and Quality (AHRQ), U.S. Department of Health and Human Services. Authors were also partially supported by grant numbers 2U54MD007584-04 (EL, YC, OM, HJA, TBS, JJC) and G12MD007601 (EL, YC, HJA, JJC) from the National Institute on Minority Health and Health Disparities (NIMHD), and P20GM103466 (EL, JJC) from the National Institute of General Medical Sciences (NIGMS) of the National Institutes of Health (NIH). The opinions expressed in this paper are those of the authors and do not reflect the official position of AHRQ, NIMHD, NIGMS, or the U.S. Department of Health and Human Services. The authors thank Michael Murata for his technical support and to Rosa Castro for her professional editing of drafts of the paper.
Disclosures: None.
Disclaimers: None.
Supporting Information
Additional supporting information may be found in the online version of this article:
Appendix SA1: Author Matrix.
References
- Agency for Healthcare Research and Quality. 2013. (AHRQ). “ Guide to Inpatient Quality Indicators: Quality of Care in Hospitals – Volume, Mortality, and Utilization ” [accessed on December 30, 2013]. Available at http://www.qualityindicators.ahrq.gov/Modules/IQI_TechSpec.aspx. [DOI] [PubMed]
- Ash AS, Stephen EF, Thomas AL, Normand ST, Stukel TA. Utts J. 2012. “ Statistical Issues in Assessing Hospital Performance ” Commissioned by the Committee of Presidents of Statistical Statistical Societies for the Centers for Medicare and Medicaid Services (CMS) [accessed on August 15, 2014]. Available at http://www.cms.gov/Medicare/Quality-Initiatives-Patient-Assessment-Instruments/HospitalQualityInits/Downloads/Statistical-Issues-in-Assessing-Hospital-Performance.pdf.
- Baram D, Daroowalla F, Garcia R, Zhang G, Chen JJ, Healy E, Riaz SA. Richman P. Use of the All Patient Refined-Diagnosis Related Group (APR-DRG) Risk of Mortality Score as a Severity Adjustor in the Medical ICU. Clinical Medicine: Circulatory, Respiratory and Pulmonary Medicine. 2008;2:19–25. doi: 10.4137/ccrpm.s544. [DOI] [PMC free article] [PubMed] [Google Scholar]
- Brown DW, Haldeman GA, Croft JB, Giles WH. Mensah GA. Racial or Ethnic Differences in Hospitalization for Heart Failure among Elderly Adults: Medicare, 1990 to 2000. American Heart Journal. 2005;150(3):448–54. doi: 10.1016/j.ahj.2004.11.010. [DOI] [PubMed] [Google Scholar]
- CMS. 2014. Centers for Medicare and Medicaid Services “ Press Release: CMS Issues Hospital Inpatient Payment Regulartion.” [accessed on August 26, 2014]. Available at http://www.cms.gov/Newsroom/MediaReleaseDatabase/Press-releases/2014-Press-releases-items/2014-08-04.html.
- Escobar GJ, Greene JD, Scheirer P, Gardner MN, Draper D. Kipnis P. Risk-Adjusting Hospital Inpatient Mortality Using Automated Inpatient, Outpatient, and Laboratory Databases. Medical Care. 2008;46(3):232–9. doi: 10.1097/MLR.0b013e3181589bb6. [DOI] [PubMed] [Google Scholar]
- Fry DE, Pine M, Jordan HS, Elixhauser A, Hoaglin DC, Jones B, Warner D. Meimban R. Combining Administrative and Clinical Data to Stratify Surgical Risk. Annals of Surgery. 2007;246(5):875–85. doi: 10.1097/SLA.0b013e3180cc2e7a. [DOI] [PubMed] [Google Scholar]
- Hannan EL, Racz MJ, Jollis JG. Peterson ED. Using Medicare Claims Data to Assess Provider Quality for CABG Surgery: Does It Work Well Enough? Health Services Research. 1997;31(6):659. [PMC free article] [PubMed] [Google Scholar]
- Iezzoni LI, Ash AS, Coffman GA. Moskowitz MA. Predicting In-Hospital Mortality: A Comparison of Severity Measurement Approaches. Medical Care. 1992;30(4):347–59. doi: 10.1097/00005650-199204000-00005. [DOI] [PubMed] [Google Scholar]
- Iezzoni LI, Ash AS, Shwartz M, Daley J, Hughes JS. Mackiernan YD. Predicting Who Dies Depends on How Severity Is Measured: Implications for Evaluating Patient Outcomes. Annals of Internal Medicine. 1995;123(10):763–70. doi: 10.7326/0003-4819-123-10-199511150-00004. [DOI] [PubMed] [Google Scholar]
- Jarman B. In Defence of the Hospital Standardized Mortality Ratio. Healthcare Papers. 2008;8(4):37–42. doi: 10.12927/hcpap.2008.19974. discussion 69–75. [DOI] [PubMed] [Google Scholar]
- Jha AK. Zaslavsky AM. Quality Reporting That Addresses Disparities in Health Care. The Journal of the American Medical Association. 2014;312(3):225–6. doi: 10.1001/jama.2014.7204. [DOI] [PubMed] [Google Scholar]
- Jones DS, Podolsky SH. Greene JA. The Burden of Disease and the Changing Task of Medicine. New England Journal of Medicine. 2012;366(25):2333–8. doi: 10.1056/NEJMp1113569. [DOI] [PubMed] [Google Scholar]
- Krumholz HM. Normand SL. Public Reporting of 30-day Mortality for Patients Hospitalized with Acute Myocardial Infarction and Heart Failure. Circulation. 2008;118(13):1394–7. doi: 10.1161/CIRCULATIONAHA.108.804880. [DOI] [PubMed] [Google Scholar]
- Krumholz HM, Wang Y, Mattera JA, Wang Y, Han LF, Ingber MJ, Roman S. Normand SL. An Administrative Claims Model Suitable for Profiling Hospital Performance Based on 30-day Mortality Rates among Patients with Heart Failure. Circulation. 2006;113(13):1693–701. doi: 10.1161/CIRCULATIONAHA.105.611194. [DOI] [PubMed] [Google Scholar]
- Lee DS, Austin PC, Rouleau JL, Liu PP, Naimark D. Tu JV. Predicting Mortality among Patients Hospitalized for Heart Failure. Journal of the American Medical Association. 2003;290(19):2581–7. doi: 10.1001/jama.290.19.2581. [DOI] [PubMed] [Google Scholar]
- McCullough E, Sullivan C, Banning P, Goldfield N. Hughes J. Challenges and Benefits of Adding Laboratory Data to a Mortality Risk Adjustment Method. Quality Management in Health Care. 2011;20(4):253–62. doi: 10.1097/QMH.0b013e318231cf4f. Available at http://www.qualityforum.org/Risk_Adjustment_SES.aspx. [DOI] [PubMed] [Google Scholar]
- Nijjar AP, Wang H, Quan H. Khan NA. Ethnic and Sex Differences in the Incidence of Hospitalized Acute Myocardial Infarction: British Columbia, Canada 1995-2002. BMC Cardiovascular Disorders. 2010;10(1):38. doi: 10.1186/1471-2261-10-38. [DOI] [PMC free article] [PubMed] [Google Scholar]
- Pine M, Jordan HS, Elixhauser A, Fry DE, Hoaglin DC, Jones B, Meimban R, Warner D. Gonzales J. Enhancement of Claims Data to Improve Risk Adjustment of Hospital Mortality. Journal of the American Medical Association. 2007;297(1):71–6. doi: 10.1001/jama.297.1.71. [DOI] [PubMed] [Google Scholar]
- Pine M, Norusis M, Jones B. Rosenthal GE. Predictions of Hospital Mortality Rates: A Comparison of Data Sources. Annals of Internal Medicine. 1997;126(5):347–54. doi: 10.7326/0003-4819-126-5-199703010-00002. [DOI] [PubMed] [Google Scholar]
- Romano PS. Chan BK. Risk-Adjusting Acute Myocardial Infartction Mortality: Are APR-DRGs the Right Tool? Health Services Research. 2000;34(7):1469–89. [PMC free article] [PubMed] [Google Scholar]
- Shukla R, Fisher R. Fisher R. Testing of 3M’s APR-DRG Risk Adjustment for Hospital Mortality Outcomes. Abstr Acad Health Serv Res Health Policy Meet. 2002;19:11. [Google Scholar]
- Smith DW, Pine M, Bailey RC, Jones B, Brewster A. Krakauer H. Using Clinical Variables to Estimate the Risk of Patient Mortality. Medical Care. 1991;29(11):1108–29. doi: 10.1097/00005650-199111000-00004. [DOI] [PubMed] [Google Scholar]
- Tabak YP, Johannes RS. Silber JH. Using Automated Clinical Data for Risk Adjustment: Development and Validation of Six Disease-Specific Mortality Predictive Models for Pay-for-Performance. Medical Care. 2007;45(8):789–805. doi: 10.1097/MLR.0b013e31803d3b41. [DOI] [PubMed] [Google Scholar]
- Tabak YP, Sun X, Johannes RS, Hyde L, Shorr AF. Lindenauer PK. Development and Validation of a Mortality Risk-Adjustment Model for Patients Hospitalized for Exacerbations of Chronic Obstructive Pulmonary Disease. Medical Care. 2013;51(7):597–605. doi: 10.1097/MLR.0b013e3182901982. [DOI] [PubMed] [Google Scholar]
- Tabak YP, Sun X, Nunez CM. Johannes RS. Using Electronic Health Record Data to Develop Inpatient Mortality Predictive Model: Acute Laboratory Risk of Mortality Score (ALaRMS) Journal of the American Medical Informatics Association. 2014;21:455–63. doi: 10.1136/amiajnl-2013-001790. [DOI] [PMC free article] [PubMed] [Google Scholar]
- Tabak YP, Sun X, Derby KG, Kurtz SG. Johannes RS. Development and Validation of a Disease-Specific Risk Adjustment System Using Automated Clinical Data. Health Services Research. 2010;45(6):1815–35. doi: 10.1111/j.1475-6773.2010.01126.x. [DOI] [PMC free article] [PubMed] [Google Scholar]
Associated Data
This section collects any data citations, data availability statements, or supplementary materials included in this article.
Supplementary Materials
Appendix SA1: Author Matrix.