

Abstract
Background
The parasite composition of wild host individuals often impacts their behavior and physiology, and the transmission dynamics of pathogenic species thereby determines disease risk in natural communities. Yet, the determinants of parasite composition in natural communities are still obscure. In particular, three fundamental questions remain open: (1) what are the relative roles of host and environmental characteristics compared with direct interactions between parasites in determining the community composition of parasites? (2) do these determinants affect parasites belonging to the same guild and those belonging to different guilds in similar manners? and (3) can cross-sectional and longitudinal analyses work interchangeably in detecting community determinants? Our study was designed to answer these three questions in a natural community of rodents and their fleas, ticks, and two vector-borne bacteria.
Methods
We sampled a natural population of Gerbillus andersoni rodents and their blood-associated parasites on two occasions. By combining path analysis and model selection approaches, we then explored multiple direct and indirect paths that connect (i) the environmental and host-related characteristics to the infection probability of a host by each of the four parasite species, and (ii) the infection probabilities of the four species by each other.
Results
Our results suggest that the majority of paths shaping the blood-associated communities are indirect, mostly determined by host characteristics and not by interspecific interactions or environmental conditions. The exact effects of host characteristics on infection probability by a given parasite depend on its life history and on the method of sampling, in which the cross-sectional and longitudinal methods are complementary.
Conclusions
Despite the awareness of the need of ecological investigations into natural host-vector-parasite communities in light of the emergence and re-emergence of vector-borne diseases, we lack sampling methods that are both practical and reliable. Here we illustrated how comprehensive patterns can be revealed from observational data by applying path analysis and model selection approaches and combining cross-sectional and longitudinal analyses. By employing this combined approach on blood-associated parasites, we were able to distinguish between direct and indirect effects and to predict the causal relationships between host-related characteristics and the parasite composition over time and space. We concluded that direct interactions within the community play only a minor role in determining community composition relative to host characteristics and the life history of the community members.
Electronic supplementary material
The online version of this article (doi:10.1186/s13071-015-1029-5) contains supplementary material, which is available to authorized users.
Keywords: Cross-sectional data, Fleas, Host age, Host reproduction status, Longitudinal data, Parasitic interspecific competition, Parasite community composition, Path analysis, Rodents, Vector-borne bacteria
Background
The current view of community ecology is that host-parasite interactions should be studied in a realistic framework of multi-parasite and multi-host types reviewed by [1–3]. A large body of literature shows that environmental conditions and host characteristics, such as host species, body size, age, sex, reproductive state, genotype, and social rank, are important determinants of the community composition of parasites [4–18]. A different body of evidence highlights the importance of interspecific interactions among parasites in shaping parasite community composition reviewed by [19, 20]. For example, facilitation between micro- and macroparasites, resulting in richer parasite communities within vertebrate hosts [21], and competitive interactions between vertically transmitted pathogenic and non-pathogenic bacteria shape the community composition within arthropod vectors [20]. These interspecific interactions and their impact on community composition may be direct or may be mediated by the environmental conditions, by the host, or by a third party within the community [2, 22]. Regardless of the mechanism, interspecific interactions within parasite communities may influence the transmission and infection dynamics of pathogenic species and, consequently, impact infection risk in wildlife and in human populations (e.g., [23–31]). Accordingly, in order to reduce disease risk, researchers are currently developing techniques to manipulate the composition of natural communities of pathogens (e.g., [32–37]).
At present, environmental- and host-mediated effects are mostly studied separately from the effects of interspecific interactions (but see [24]). Moreover, most studies on interspecific interactions within a community of parasites have focused on a single guild (e.g., oral and gut bacteria, ectoparasites, or endoparasites; [22, 38–43]), whereas parasite communities in host individuals are naturally composed of multiple guilds. Finally, determinants of parasite community composition are mostly investigated via cross-sectional field surveys, through which parasites are sampled at one point in time from different host individuals and under different environmental conditions (e.g., [44–46]). Although cross-sectional field surveys allow a large sample size as they demand relatively low trapping efforts, they often fail to predict the actual relationships between variables [19]. Longitudinal sampling surveys, which repeatedly sample the same host individuals over time, are more reliable as they control for genetic variability between hosts and better reflect causality (i.e., the pattern in time at t+1 is a result of the pattern at time t; [19]). Importantly, longitudinal sampling always includes cross-sectional data at each time point. Yet, most longitudinal studies do not differentiate in their analyses between longitudinal and cross-sectional data (e.g., [47–50]). To the best of our knowledge, there is only one study that compared the ability of the two approaches in describing known relationships [19, 51]. However, since Fenton et al. were specifically interested in the interactions among parasite species, they did not quantify other determinants of parasite communities [19, 51]. Accordingly, three fundamental questions arise: (1) what are the relative roles of host and environmental characteristics compared with direct interactions between parasites in determining the community composition of parasites? (2) do these determinants affect parasites belonging to the same guild and those belonging to different guilds in similar manners? and (3) can cross-sectional and longitudinal analyses work interchangeably in detecting community determinants?
Here we addressed these three questions by sampling a natural rodent population, its fleas, ticks, and the two dominant vector-borne bacterial species on two occasions. The first occasion was the onset of the host reproductive period, when juveniles, reproductive and non-reproductive hosts occupied the same habitat, and the second was at the end of summer, when all juvenile individuals had reached adulthood and adults were no longer in a reproductive state. Thus, we examined both cross-sectional and longitudinal (based on two points in time) aspects of parasite community composition.
Blood-associated parasites share the same food resources (blood cells), may face similar constraints (e.g., immune response), and may rely on each other for transmission. Therefore, we hypothesized that interspecific interactions between parasites within such a community would be a major determinant of its composition ([52–54], but see, [55]). Moreover, while fleas and ticks constitute the ectomacroparasite guild (designated as the ectoparasite guild) and, as such, spend time both on the host and in the host environment, the bacteria constitute the endomicroparasitic guild, i.e., located and reproducing within a host/vector individual, and are thus highly associated with it (designated as the endoparasite guild). Consequently, we predicted that whilst all the sampled blood-associated parasites would be affected by the host characteristics, fleas and ticks would be more influenced by the external environment and would show more seasonal fluctuations. Finally, as the cross-sectional and longitudinal approaches have different strengths and weaknesses [56], we hypothesized that they would be complementary in evaluating the determinants of parasite community composition.
By combining path analysis and model selection approaches, we explored the multiple direct and indirect paths that connect (i) the environmental and host-related characteristics to the infection/infestation probability of a host by the four parasite species, and (ii) the infection/infestation probabilities of the four species by each other. Our results suggest that the majority of paths shaping the community composition of parasites are indirect, mostly determined by host characteristics and not by interspecific interactions or environmental conditions. The exact effects of host characteristics on infection probability by a given parasite depend on its life history and on the method of sampling, in which the cross-sectional and longitudinal methods are complementary. Thus, our study supports the central role of the immediate environment of a parasite community in shaping its composition and calls for controlled exploration of the mechanisms underlying host-related effects.
Methods
Experimental design
We trapped, tagged and identified Gerbillus andersoni and Gerbillus pyramidum rodents and sampled their fleas, ticks and blood on two occasions, namely at the onset of the host reproductive period (April-May; period 1) and at the end of summer (September; period 2), when all juvenile individuals had reached adulthood. All blood samples were subjected to DNA extraction and polymerase chain reaction (PCR) to screen for the most dominant vector-borne bacteria within the rodent blood. We then combined path analysis and model selection approaches [57, 58] to determine the most important direct and indirect determinants of the community composition of the parasites (ticks, fleas, and two bacterial species). This protocol allowed us to evaluate the relative importance of determinants related to the host, to interactions among parasites within the host, and to the host environment. It also allowed for the simultaneous evaluation of the determinants of parasite community composition by cross-sectional and longitudinal analyses. The longitudinal analysis was based on the comparison of parasite communities sampled during the two sampling periods in the same rodent individuals. To get a comparable sample size while maximizing the heterogeneity in host and environmental conditions, the cross-sectional analysis was based on the comparison of parasite communities sampled during period 1 in hosts belonging to different age and sex groups and that differed in their reproductive status.
Rodent trapping and sampling
To make the study more general and not restricted to a single host population, we aimed at sampling at least 10 independent rodent populations. Plots were located in the western Negev Desert, Israel (Hevel Shalom, 310 10′ N) and included 40 live Sherman traps, uniformly placed in four columns and 10 rows per plot. We maintained plot independence by selecting the 10 plots to be at least 40 m apart from each other, following Kedem et al. [59]. At the same time, for the longitudinal portion of the study, we aimed at 80 % recaptures per plot, which required two to three trapping nights within each plot.
We recorded temperatures in the evening and morning of trapping using a Kestrel 4000, Pocket Weather Tracker (Nielsen-Kellerman, Boothwyn, Pennsylvania, USA) and calculated mean values in each plot. We tagged each captured individual and determined its species, sex, age (juveniles <18 g; adults >18 g, following Hawlena et al. [60]) and, in female rodents, the reproductive status (pregnant, lactating or non-reproductive hosts). We then weighed each gerbil and measured the length of its right hind leg, and we used the two measurements for the calculation of body condition, following J Peig and AJ Green [61]. Within each of the two sampling periods, we collected fleas from rodent individuals only following their initial capture to avoid pseudo-replication. The rodent was held gently above a plastic can, its fur was blown, and jump-off fleas were counted and collected, until no fleas were detected on the host body. Ticks were often attached to ears, mouth or nose and were aggregated around open injuries. This aggregation pattern allowed us to count larvae and nymph ticks on a gerbil body by carefully scanning the target areas before collecting them, using sharp-tip forceps. Despite our efforts to screen for all ectoparasite species that could act as vectors for bacteria, we never detected lice on the rodents in our study areas. Fleas and ticks were stored in 70 % ethanol at −20 °C until their species and stage (for ticks) were identified. In addition, we drew 100–200 μl of blood from the retro-orbital sinus of each host individual with capillaries immersed in 0.15 % EDTA and stored each sample in EDTA blood collection tubes at −20 °C until DNA extraction. Specifically, the rodent was held gently on a covered foam pillow, one drop of local anesthesia (Localin, 0.4 % benoxinate hydrochloride; Fisher Pharmaceutical Labs, Tel Aviv, Israel) was administered to the eye, and shortly after, the capillaries were introduced into the retro-orbital sinus. As some species of wild rodents are extremely sensitive to slight deviations in anesthetic doses [62], this protocol ensured that the rodents would have no comprehensive deficits when released back into nature while minimizing discomfort to the animals.
The trapping and handling protocol was approved by the Committee for the Ethical Care and Use of Animals in Experiments of Ben-Gurion University of the Negev (permission # IL-14-03-2011) and by the Nature and National Parks Protection Authority (permission # 2011/38146).
Bacteria sampling
We extracted DNA from blood samples, using a MoBio Bacteremia DNA Isolation Kit. We added 50 μl of blood to the microbead tube and followed the manufacturer’s instructions. We chose Mycoplasma and Bartonella as the target genera for the study because the 16S rRNA pyrosequencing of the DNA extracted from gerbil blood and fleas suggests that they dominate the blood-borne bacterial communities [63, 64]. To confirm the existence of Mycoplasma and Bartonella in the vector arthropods, we also extracted DNA from 126 fleas and 42 ticks, using a DNeasy Blood and Tissue Kit (QIAGEN, Valencia, CA, USA), according to the manufacturer’s instructions for the purification of total DNA from ticks, and the supplementary protocol for the detection of Borrelia DNA [65]. In each extraction session, a negative control was added in which all of the reagents were added to phosphate-buffered saline instead of blood or vectors.
The phylogenetic tree of the specific Bartonella species detected in these areas is described elsewhere and suggests that it comprises multiple genotypes [59, 66]. In contrast, a phylogenetic analysis suggests that the Mycoplasma bacteria belong to a single cluster, with a 90–95 % similarity to Mycoplasma haemomuris [59]. Detection of bacterial species in DNA extracts relied on PCR. We detected Mycoplasma by amplification of the 16S gene with HM16S-1(fw) (GAGCGAATTGCTAGCAATAG) and HM16S-2(rev) (AGCTACAACGCTGAGACTC) primers. We detected Bartonella by amplification of the citrate synthase (gltA) gene withBhcs.781p-fw (GGGGACCAGCTCATGGTGG) and Bhcs.1137n-rev (AATGCAAAAAGAACAGTAAACA). The PCR conditions are described in Kedem et al., [59]. Despite the uniform DNA extraction and PCR protocol, the intensities of the positive PCR bands of Bartonella were variable, ranging from very weak bands that could hardly be seen to definitive bands. We, therefore, exploited this variability to distinguish between samples with low (<500 copies per 1 μl of DNA) and high (>500 copies per 1 μl of DNA) Bartonella sp. cell density, with this distinction serving as the binary response variable in subsequent analysis. To distinguish between low and high cell density, we ran, in parallel to the PCR assays, an intensity ladder of Bartonella (ranging from 10 to 5000 bacterial copies in 1 μl of DNA) that was made by a serial dilution of a positive control with a known copy number.
Sanger sequencing was performed on 20 % of the PCR-positive samples, using a PRISM 3100 Genetic Analyzer (Applied Biosystems, Carlsbad, CA, USA) at the National Institute for Biotechnology in the Negev, Beer-Sheva, Israel and confirmed that the tested bands indeed corresponded to sequences derived from Mycoplasma haemomuris-like bacterium and Bartonella sp.
Data analysis
Analyses for each of the datasets were conducted in two stages: first, we searched for the most important factors that may have influenced each parasite species (Table 1); then we quantified the causal pathways in the network of interactions among the four parasites and their determinants, using a combination of path analysis and model selection approach (Additional file 1: Table S1, Figs. 1, 2 and Additional file 1: Figure S1). Path analysis is a powerful approach that evaluates alternative causal hypotheses regarding the interactions among variables. The causal links that this analysis reveals are often supported by an experimental approach (e.g., [58]). The model selection approach complements the path analysis by evaluating the likelihood of the causal hypotheses, which reflect different predictions about the directions and strength of interactions, given the data and the set of models. To this end, in addition to the insights gained from traditional correlation-based approaches about the strength and significance of pairwise interactions, the combined path analysis-model selection approach can incorporate multiple interrelated response variables, can predict the direction and causality of the interactions, and can distinguish between direct and indirect effects. Accordingly, the combined approach enabled us to make comparisons between models with and without direct interactions between parasites (question 1), to quantify and compare the relative importance of host characteristics on each of the parasite species in the community (question 2), and to qualitatively compare the cross-sectional and the longitudinal datasets (question 3). In both stages, we compared models using model probabilities (wi, where i corresponds to a specific model) based on Akaike’s information criterion corrected for a small sample size (AICc), which gives a measure of the plausibility, on a 0 to 1 scale, that a particular model is indeed the best model see model selection approach; [57]. The competing models were based on generalized linear models (GLM) with a binary-binomial distribution for the binary-response variables and a negative binomial distribution for the count-response variables.
Table 1.
Comparison of models from stage 1
| Response variables included in the model | Dataset and target parasite | ||||||||
|---|---|---|---|---|---|---|---|---|---|
| Type | Variable | Cross-sectional | Longitudinal | ||||||
| M | B | S | H | M | B | S | H | ||
| Environment | aTemperature | 0 | 0 | 0.02 | 0 | n/a | n/a | 0 | 0 |
| Host | bAge | 17 | 27 | 96 | 0.2 | n/a | 25 | 28 | 32 |
| bBody condition | 0 | 0 | 0 | 0 | n/a | 0 | 0 | 0 | |
| bReproductive status | 35 | 22 | 0 | 99 | n/a | 29 | 43 | 43 | |
| Sex | 13 | 24 | 0 | 0 | n/a | 23 | 29 | 29 | |
| Vector | bFlea burden | 0 | 0 | n/a | 0 | n/a | 0 | n/a | 0 |
| bTick burden | 0 | 0 | 0 | n/a | n/a | 0 | 0 | n/a | |
| Bacteria | b Mycoplasma presence | n/a | 27 | n/a | n/a | n/a | 23 | n/a | n/a |
| b Bartonella presence | 35 | n/a | n/a | n/a | n/a | n/a | n/a | n/a | |
The models explain occurrence/abundance or temporal reduction for each of the four parasitic species in the cross-sectional and longitudinal datasets, respectively. Values are weights (w i) in percentages of Akaike information criterion corrected for sample size—the relative likelihood of the current model, given the data and the set of models. Weights are normalized across the set of candidate models to summate to one, and are interpreted as probabilities. M = Mycoplasma haemomuris-like bacterium, B = Bartonella sp., S = Synosternus cleopatrae fleas, H = Hyalomma impeltatum ticks, n/a = not applicable. The best models (w i > 10) are marked in bold and were used for stage 2 (Additional file 1: Table S1, Figure S1)
aFor the longitudinal analyses, we used the between-period temperature differences
bFor both datasets, we used the relevant factor measured in the first period
Fig. 1.
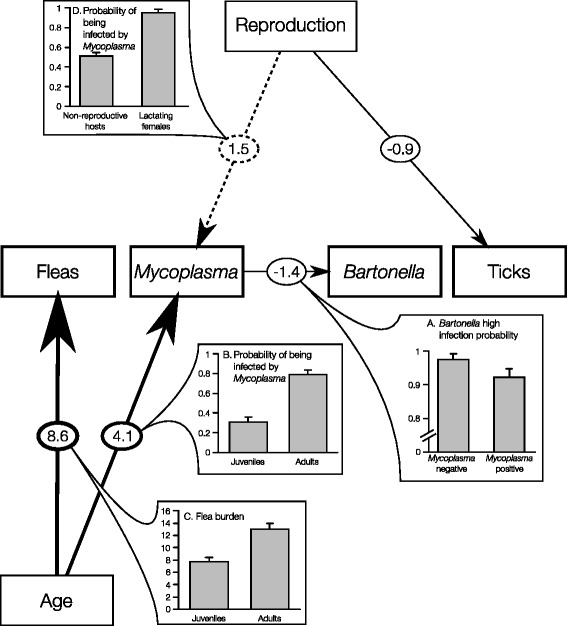
The best path analysis model for predicting the community composition of parasites as determined by the cross-sectional dataset (model 12 in Additional file 1: Table S1). Arrows represent direct and indirect influences. Numbers on the arrows are standardized path coefficients, representing the relative strength of the given effect (β/SE), which is also reflected by the arrow width. a–d illustrate the directions of the most influential (|β/SE| > 1) direct effects. The dashed arrow represents a relationship that is included in the second best model in addition to the relationships included in model 12 (model 14 in Additional file 1: Table S1)
Fig. 2.
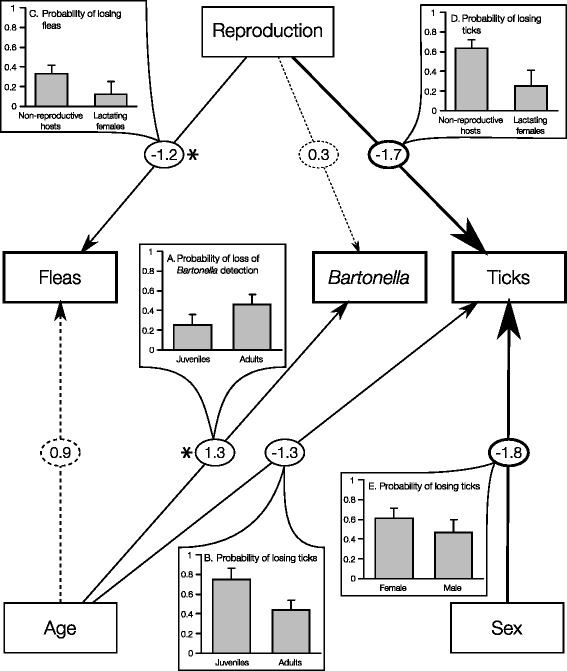
The best path analysis model for predicting the temporal changes in the community composition of parasites as determined by the longitudinal dataset (model 48 in Additional file 1: Table S1). Arrows represent direct and indirect influences. Numbers on the arrows are standardized path coefficients, representing the relative strength of the given effect (β/SE), which is also reflected by the arrow width. a–e illustrate the directions of the most influential (|β/SE| > 1) direct effects. The dashed arrows represent additional relationships that are included only in the second and third best models (models 49 and 46, respectively, in Additional file 1: Table S1). Asterisks denote relationships that were not included in the second and third best models
The independent variables considered in stage 1 were similar for both datasets and included environmental, host-related, vector-related, and bacteria-related variables (Table 1). For the cross-sectional analyses, we used either “the prevalence of infection by the endoparasites” or “the abundance of ectoparasites” as response variables, whereas for the longitudinal analyses, we used binary-response variables, indicating whether there was a reduction in infection/infestation between periods or not (i.e., infection/infestation either stayed stable or decreased).
Stage 2 began with the construction of saturated path models [58, 67] that integrate all important associations between the independent variables and each single parasite (i.e., all associations included in the best models from stage 1; Additional file 1: Figure S1). For each dataset, we then compared different model versions modified from the saturated models while keeping the same AIC metric (i.e., using the same mediators and response variables) (Additional file 1: Table S1 and Figure S1). Path analyses were conducted using the Mplus software (Muthén & Muthén, Los Angeles, CA, USA).
We performed goodness of fit chi-square tests to assess whether the infection/infestation status (occurrence or abundance) of each parasite species is likely to change with time. We compared the observed and the expected changes. The expected changes were calculated based on the random probabilities that an infection/infestation is either (1) amplified ((1-pi)× pi, where pi is the probability for a host to be infected/infested by parasite i during the period 1), (2) reduced (pi× (1-pi)) or (3) not changed (pi2+(1-pi)2) with time.
Results
General description of the rodent population and its parasitic community
Of a total of 511 individual rodents captured in all 10 plots, G. andersoni constituted 97 % (N = 496) and G. pyramidum constituted 3 % (N = 15); we thereby focused our analyses on the former species. Details on the G. andersoni gerbils who were trapped in period 1 (N = 339) and the blood samples included in the cross-sectional and longitudinal datasets are given in Table 2. As expected, most juvenile and lactating females were trapped during the spring (period 1), and by the end of the summer (period 2), the rodent population had homogenized (with only 14 new juveniles and no reproductive adults).
Table 2.
Summary of field sampling
| Host characteristics | Total rodents | Infection status | Samples for DNA extraction | ||||||||
|---|---|---|---|---|---|---|---|---|---|---|---|
| Dataset | Age | Sex | Reproductive status | S intensity (prevalence) | H intensity (prevalence) | M Prevalence | aB Prevalence | Blood samples | Flea samples | Tick samples | |
| Cross-sectional | Juveniles | Male | NR | 64 | 8 (98) | 6 (50) | 36 | 95 | 41 | 14 | 5 |
| Female | NR | 67 | 7 (100) | 9 (57) | 24 | 100 | 37 | 16 | 10 | ||
| Adults | Male | NR | 84 | 13(97) | 8 (42) | 77 | 97 | 40 | 16 | 7 | |
| Female | NR | 59 | 16(100) | 7 (54) | 65 | 92 | 37 | 16 | 11 | ||
| Female | R | 65 | 11 (97) | 9 (17) | 95 | 87 | 40 | 0 | 4 | ||
| Longitudinal | Juveniles | Male | NR | 9 | 15(100) | 5(55) | 57 | 86 | 14 | 30 | 2 |
| Female | NR | 13 | 10(100) | 6(58) | 33 | 88 | 18 | 32 | 3 | ||
| Adults | Male | NR | 28 | 15(100) | 7(45) | 87 | 75 | 16 | 32 | 5 | |
| Female | NR | 19 | 15(100) | 5(50) | 44 | 78 | 18 | 32 | 3 | ||
| R | 9 | 15(100) | 7(28) | 87 | 62 | 16 | 0 | 0 | |||
| Total | 417 b | 125 (99) | 69 e (46) | 61 | 86 | 277 c | 188 d | 50 c | |||
Details on the trapped G. andersoni rodents, on the prevalence (percentage of infected/infested hosts) and intensity (mean abundance of ectoparasites per infested host) of their Mycoplasma (M), Bartonella (B), S. cleopatrae (S), and H. impeltatum (H) parasites, and on the samples included in the cross-sectional and the longitudinal datasets
a99% of the hosts were infected by Bartonella; thus we exploited the variability in the intensities of positive PCR bands to distinguish between samples with low (<500 copies per 1 μl of DNA) and high (>500 copies per 1 μl of DNA) Bartonella sp. cell density. This distinction served for the prevalence calculation that in the case of Bartonella, corresponded to the percentage of highly infected hosts
bWe had in total 339 G. andersoni captured in the first period, but 78 of them are relevant to both datasets
cWe had in total only 236 blood samples, but 41 of them are relevant to both datasets
dWe had in total 126 flea samples, but 62 of them are relevant to both datasets
eWe had in total 42 tick samples, but 8 of them are relevant to both datasets
During period 1, most fleas were morphologically identified as Synosternus cleopatrae. There was also a low prevalence of the winter flea, Stenoponia tripectinata (none in juveniles and 9 % in adults) at this time, leading to the inclusion in the longitudinal analysis of only host individuals who were not infested by the winter flea. During period 2, all host individuals were solely infested by S. cleopatrae. All larvae and nymph ticks were morphologically identified as Hyalomma impeltatum. The majority of hosts were infected/infested by more than one parasitic species (23, 55, and 19 % were infected/infested by two, three, and four parasites, respectively). Almost all the rodent individuals were infested by fleas and were highly infected by Bartonella, whereas the prevalence of ticks and of Mycoplasma was lower (Table 2). Bartonella and Mycoplasma were also detected in fleas (65 and 33 %, respectively) and in the tick samples (38 and 19 %, respectively), implying that these bacteria have the potential for vector-borne transmission.
The temporal fluctuations of the different parasite species on a given host individual were dissimilar. Mycoplasma status was mostly persistent, with 90 % of the individual rodents remaining at the same status of infection (uninfected, n = 15 or infected, n = 22) between the two periods. In fact, only one individual acquired a new infection, and in three individuals that were positive in period 1, no Mycoplasma was later detected in the peripheral blood. Due to this persistency, we did not include Mycoplasma in the longitudinal analyses. Similarly, most (58 %, n = 24) rodents were infected by Bartonella in both sampling seasons. However, 38 % (n = 15) were positive in period 1 but showed no evidence of Bartonella infection in the peripheral blood in period 2. For the other two individuals that were sampled, one remained PCR negative and the other became PCR positive in period 2. Regarding ectoparasites, most host individuals had either a higher flea burden (68 %, n = 27) or a lower tick burden (58 %, n = 23) in period 2 than in period 1. The numbers of hosts with either a persistent Mycoplasma infection, an increased flea burden, a reduced tick burden, or a loss of detection of Bartonella in the PCR of peripheral blood (hereafter, “loss of detection”) were greater than expected by a random chance (chi-square tests: χ2 > 22, p < 0.001, for all parasites).
Determinants of parasite community composition
The best models predicting the infection/infestation status of a rodent by each parasite alone and the chances that it will change over time are detailed in Table 1. The best models predicting the prevalence of Mycoplasma and Bartonella included the effect of co-infection with the other bacterium. However, other than this, all the best models predicting the infection/infestation status of a rodent by any of the parasites included only host characteristics. Models including other direct interactions between parasites (e.g., between fleas and ticks or between both of these and the bacterial species) or temperature effects performed poorly compared to models including host characteristics (Table 1), and thus were not included in any of the path models (Additional file 1: Table S1).
When we identified the best path models, some of the variables included in the best single-species models were omitted (Table 1 versus Figs. 1 and 2). For example, the effect of the host sex was not included in the best path model of the cross-sectional dataset and remained directly linked only to the probability of losing ticks in the path model of the longitudinal dataset. Moreover, the path analysis for the cross-sectional dataset indicates that the observed associations between host characteristics (age, sex and reproductive status) and Bartonella prevalence (Table 1) probably arose due to direct relationships between the two bacterial species rather than by direct effects of the host characteristics on Bartonella (Fig. 1a).
From all the path models considered for the cross-sectional dataset (Additional file 1: Table S1 and Figure S1), only two—Mycoplasma-centered—models had a good support of the data (∑wi = 100; Fig. 1). These models suggest that mainly four direct relationships determine the community composition of parasites (the absolute relative strength of effects are larger than 1; Fig. 1). These relationships include the negative relationships between the two bacterial species (Fig. 1a), and the positive relationships between (i) Mycoplasma prevalence and host age (Fig. 1b), between (ii) flea burden and host age (Fig. 1c), and between (iii) Mycoplasma prevalence and the reproductive status of the host (Fig. 1d). From all the path models considered for the longitudinal dataset (Additional file 1: Table S1, Figure S1), three models had a good support of the data (models 46, 48–49 in Additional file 1: Table S1; ∑wi = 78; Fig. 2). These models suggest that mainly five direct relationships determine the temporal changes in the community composition of parasites (the absolute relative strength of effects are larger than 1; Fig. 2). These relationships include positive relationships between Bartonella loss of detection and host age (Fig. 2a) and negative relationships between (i) host age and tick loss (Fig. 2b), (ii) between reproductive status and flea loss (Fig. 2c), between (iii) reproductive status and tick loss (Fig. 2d), and between (iv) host sex and tick loss (Fig. 2e).
Discussion
The assembly of blood-associated parasites in a host individual presents a highly interrelated community, which may be shaped by both extrinsic (environmental and host characteristics) and intrinsic (interspecific interactions) factors. Here we quantified the relative impacts of environmental, host-related and vector-related factors and compared them to the relative impact of interspecific interactions on the composition of the most dominant parasites forming these communities. Importantly, we assessed the contribution of cross-sectional and longitudinal approaches to the investigation of the determinants of community composition. We discuss below our results in light of the three study goals.
The community composition of blood-associated parasites is mostly determined by rodent characteristics and not by interspecific interactions among parasites
Reports on interspecific interactions within ecto- or endoparasite communities are common (e.g., [24, 26, 43, 68–73]), but they are mostly based on traditional correlative studies [19, 74]. Here we employed a path analysis approach to determine causality from correlative data [58]. Although the path analysis cannot replace experimental evidence in determining causation, this method, combined with the model selection approach, has a predictive power for the direction, strength, and nature (direct versus indirect) of the relationships among variables. As expected, we found indications for direct negative associations between the two bacterial species (Fig. 1a). Given that Mycoplasma bacteria reside at the erythrocyte surface [75], it is possible that the two bacterial species compete on attachment sites during the process of erythrocyte invasion by Bartonella.
Nevertheless, in contrast to our hypothesis, our analyses suggest that all other associations within the tested parasite community are indirect and are mediated by host characteristics. While these results fit well with the known nature of intimal host-parasite associations and with the important role of indirect effects in shaping complex natural communities [76, 77], they challenge the prevailing claim, based on field correlative studies, that mainly interspecific interactions among parasites shape their community composition, and they thus call for experimental evaluations of the field patterns. Specifically, our cross-sectional analysis indicates that the associations between Mycoplasma and fleas or ticks are mediated by host characteristics (Fig. 1). The failure to detect direct positive associations between Mycoplasma and the arthropod vectors, combined with unsuccessful flea-transmission experiments in different Mycoplasma species (Cohen, C.et al., and Lappin M.R. unpublished observations) and evidence for alternative routes of transmission e.g., via aggressive host interactions and in utero transmission; [78–81], suggests that arthropods may play only a secondary role in haemoplasma transmissions. Similarly, our results suggest that the associations between the two ectoparasites are mediated by host characteristics (Fig. 2). Negative indirect associations were also revealed by Hawlena et al. [69] who suggested that ticks may modify the flea preference for specific host types.
However, in contrast to the above findings, which reflect the current knowledge on Mycoplasma-vector and flea-tick interactions, the lack of evidence for direct relationships between Bartonella and fleas is most puzzling. This is because fleas are considered as key players in the Bartonella cycle based on their dominancy in flea microbiomes [64, 65, 82] and conclusive experimental evidence of efficient flea-borne transmission (e.g., [83–85]). In some other observational studies, the correlations between flea abundance and Bartonella occurrence were weak or also absent [49, 66, 86]. The reason that direct positive effects between Bartonella and fleas may be obscured in observational data could be attributed to the overall high prevalence of Bartonella and/or direct interaction of Bartonella with other bacteria that are less dependent on fleas for their transmission (Mycoplasma in our case).
Determinants for the occurrence/abundance of a parasite depend on its life history and not on its guild
Our hypothesis that ectoparasites would be largely affected by the external environment of the host, and thus would show more seasonal fluctuations than endoparasites was only partly supported. As expected, the abundances of both ectoparasite species varied seasonally, but contrary to our hypothesis, they were mostly predicted by the host characteristics. Moreover, none of the best models included temperature, suggesting that the seasonal patterns in ectoparasite abundance were probably derived from changes in host characteristics (Table 1).
Despite the fact that all four parasite species were mostly affected by the host age and reproductive status, major differences were revealed among them with respect to the relative impact of each host characteristic, the direction of effects (i.e., positive versus negative), and the seasonal patterns. Mycoplasma mostly infected adults, in particular, lactating females, and were persistent in a host through time. The observed persistency is consistent with the dynamics of this bacterial species in the 30 field-captured G. andersoni that we have introduced to our flea-free lab and have maintained as continuously infected over 3 years (Cohen et al., unpublished observations). The long persistency and multiple routes of transmission reviewed in [87] can explain why adults who (i) live longer, (ii) support more fleas (Fig. 1c), and (iii) are more likely to be engaged in aggressive mating (including reproductive females) have a higher Mycoplasma prevalence than do juvenile rodents.
In contrast, our data suggest that Bartonella prevalence is not directly affected by any of the host characteristics. Moreover, 38 % of the rodents were positive for Bartonella in the first period but became PCR-negative after only 3–4.5 months. The duration of Bartonella bacteremia in nature is difficult to determine due to relapsing bacteremia from the primary niche and reinfections promoted by fleas [88]. Yet, our results are consistent with controlled inoculations under flea-free conditions, which suggests that after a period ranging from several weeks to several months, Bartonella infection is cleared by the host or is at least reduced to undetectable quantities [88–91]. It is still not clear whether the clearance mechanisms of Bartonella bacteria involve cellular immunity (e.g., T helper cells, B cells, or cytokines), humoral immunity (specific antibodies in serum that can remove Bartonella from the bloodstream), an acceleration of erythrocyte turnover, or their combination [88]. However, it is likely that these mechanisms are age-dependent (Fig. 2a; reviewed by [92]).
Interspecific differences were also revealed between the two ectoparasites. Flea burden was mostly predicted by the host age, with higher rates in adults than in juvenile hosts. This result, which is consistent with previous field patterns and with experimental evidence for a higher grooming efficiency in juveniles than in adults [60, 93], may explain the increase in flea burden toward period 2. In contrast, tick burden was mostly affected by the reproductive status of the host. The results, which indicate that lactating females are more resistant to ticks than non-reproductive adults, apparently contradict the collective evidence for a “cost of reproduction” (i.e., lower immunity in reproductive than in non-reproductive females; [94]). However, the lower probability of lactating females to lose ticks in the following season, compared with non-reproductive females, suggests that the cost of reproduction may be simply postponed.
Taken together, our results suggest that while all blood-associated parasites are mainly affected by host characteristics, the relative roles of different host characteristics vary with respect to their life history.
Cross-sectional and longitudinal sampling are complementary approaches
As predicted, we found that the two approaches are complementary and together give a comprehensive view of the determinants of parasite community composition. From a quantitative perspective, the cross-sectional analysis revealed fewer but stronger (i.e., higher effect sizes) paths between host characteristics and parasite occurrence/abundance than did the longitudinal analysis. The stronger effects of the cross-sectional analysis may reflect differences in time scales, since via the cross-sectional analysis, we compared parasite communities in hosts composed of two different age cohorts (i.e., newly born juveniles versus adults from the previous year), and via the longitudinal analysis, we compared the parasite communities of hosts before and a few months after they became mature. The higher sensitivity of the longitudinal analysis may be attributed to the removal of between-individual noise [56]. From a qualitative perspective, utilizing the two approaches allowed us to reveal possible paths and effects that would otherwise have been missed. The age effects in fleas and interspecific associations between bacteria were uncovered by the cross-sectional analysis, while the longitudinal analysis provided evidence solely for (i) the cost of reproduction suggested by a lower resistance to ticks, (ii) the age and sex effects in ticks, and (iii) the loss of detection of Bartonella by adult hosts. Our longitudinal survey was limited to two time points, but this sampling is reasonable given the one-year lifespan of G. andersoni under natural conditions [95]. Importantly, we managed to capture the main variability in physiological age and reproductive status by sampling rodents in both the reproductive and the non-reproductive seasons. Thus, we believe that the combination of cross-sectional and longitudinal approaches generated a comprehensive view of blood-associated parasite communities of rodents in nature.
Conclusions
In the past few decades, the role of ecological investigations of natural host-parasite communities has gained remarkable attention in light of the emergence and re-emergence of infectious diseases [96–99]. Vector-borne zoonotic diseases, in particular, present a challenge due to the complexity of the paths that their agents use and the great variety of factors that can directly and indirectly affect their occurrence [25]. The network of effects and mechanisms would be best revealed by lab and field manipulations. However, in practice, such studies are often not practical (e.g., for dangerous zoonotic diseases and long-term scales). Here we illustrated that comprehensive patterns can be revealed from observational data by applying path analysis and model selection approaches and combining cross-sectional and longitudinal analyses. By employing this combined approach on blood-associated parasites, we concluded that direct interactions within the community may play only a minor role in determining community composition relative to host characteristics and the life history of the community members. Our combined approach is expected to generate important insights into the structure and function of other host-vector-parasite systems, in particular, and into natural communities with complex causal relationships, in general.
Acknowledgements
We thank D. Morick, D. A. Apansakevich, N. Burdelova, D. Saltz, Y. Gavish and A. Tsairi for valuable advice during this study. This study was supported by Marie Curie Career Integration Grant (CIG) number FP7-293713 to H.H. This is publication number 878 of the Mitrani Department of Desert Ecology.
Additional file
List of path models and their weights (in percentages) employed in stage 2. Figure S1. Basic path models used for the construction of the set of competing models (Additional file 1: Table S1). (DOCX 128 kb)
Footnotes
Competing interests
The authors declare that they have no competing interests.
Authors’ contributions
CC participated in the design of the study, carried out the field sampling and molecular analysis, performed the statistical analysis, and wrote the manuscript. ME participated in the design and analysis of the molecular assays. HH conceived of the study, and participated in its design, the design of the molecular assays, the statistical analysis and coordination, and helped to draft the manuscript. All authors read and approved the final manuscript.
Contributor Information
Carmit Cohen, Email: cohencvet@gmail.com.
Monica Einav, Email: einav@bgu.ac.il.
Hadas Hawlena, Email: hadashaw@bgu.ac.il.
References
- 1.Rigaud T, Perrot-Minnot M-J, Brown MJF. Parasite and host assemblages: embracing the reality will improve our knowledge of parasite transmission and virulence. Proc R Soc B. 2010;277(1701):3693–3702. doi: 10.1098/rspb.2010.1163. [DOI] [PMC free article] [PubMed] [Google Scholar]
- 2.Pedersen AB, Fenton A. Emphasizing the ecology in parasite community ecology. Trends Ecol Evol. 2007;22(3):133–139. doi: 10.1016/j.tree.2006.11.005. [DOI] [PubMed] [Google Scholar]
- 3.Hawlena H, Ben-Ami FA. A Community Perspective on the Evolution of Virulence. In: Morand S, Krasnov B, Littlewood T, editors. Parasite Diversity and Diversification: Evolutionary Ecology Meets Phylogenetics, vol. 22. Cambridge: Cambridge University Press; 2015. [Google Scholar]
- 4.Krasnov BR, Mouillot D, Shenbrot GI, Khokhlova IS, Poulin R. Deconstructing spatial patterns in species composition of ectoparasite communities: the relative contribution of host composition, environmental variables and geography. Glob Ecol Biogeogr. 2010;19(4):515–526. [Google Scholar]
- 5.Schotthoefer AM, Rohr JR, Cole RA, Koehler AV, Johnson CM, Johnson LB, et al. Effects of wetland vs. landscape variables on parasite communities of Rana pipiens: links to anthropogenic factors. Ecol Appl. 2011;21(4):1257–1271. doi: 10.1890/10-0374.1. [DOI] [PubMed] [Google Scholar]
- 6.Rasconi S, Niquil N, Sime-Ngando T. Phytoplankton chytridiomycosis: community structure and infectivity of fungal parasites in aquatic ecosystems. Environ Microbiol. 2012;14(8):2151–2170. doi: 10.1111/j.1462-2920.2011.02690.x. [DOI] [PubMed] [Google Scholar]
- 7.Laurance SGW, Jones D, Westcott D, McKeown A, Harrington G, Hilbert DW. Habitat fragmentation and ecological traits influence the prevalence of avian blood parasites in a tropical rainforest landscape. PLoS ONE. 2013;8(10):e76227. doi: 10.1371/journal.pone.0076227. [DOI] [PMC free article] [PubMed] [Google Scholar]
- 8.Calegaro-Marques C, Amato SB. Urbanization breaks up host-parasite interactions: a case study on parasite community ecology of rufous-bellied thrushes (Turdus rufiventris) along a rural–urban gradient. PLoS ONE. 2014;9(7):e103144. doi: 10.1371/journal.pone.0103144. [DOI] [PMC free article] [PubMed] [Google Scholar]
- 9.Krasnov BR, Shenbrot GI, Khokhlova IS, Stanko M, Morand S, Mouillot D. Assembly rules of ectoparasite communities across scales: combining patterns of abiotic factors, host composition, geographic space, phylogeny and traits. Ecography. 2014;38(2):184–197. doi: 10.1111/ecog.00915. [DOI] [Google Scholar]
- 10.MacIntosh AJJ, Hernandez AD, Huffman MA. Host age, sex, and reproductive seasonality affect nematode parasitism in wild Japanese macaques. Primates. 2010;51(4):353–364. doi: 10.1007/s10329-010-0211-9. [DOI] [PubMed] [Google Scholar]
- 11.Martins-Hatano F, Raices DS, Gazeta GS, Serra-Freire NM, Gettinger D, Bergallo HG. Community composition of laelapine mites (Acari: Laelapidae) associated with the nests and fur of Cerradomys subflavus (Wagner, 1842) J Nat Hist. 2011;45(27–28):1679–1688. doi: 10.1080/00222933.2011.559690. [DOI] [Google Scholar]
- 12.Schad J, Dechmann DKN, Voigt CC, Sommer S. Evidence for the ‘Good Genes’ model: Association of MHC Class II DRB alleles with ectoparasitism and reproductive state in the neotropical Lesser bulldog bat, Noctilio albiventris. PLoS ONE. 2012;7(5):e37101. doi: 10.1371/journal.pone.0037101. [DOI] [PMC free article] [PubMed] [Google Scholar]
- 13.Kamiya T, O’Dwyer K, Nakagawa S, Poulin R. What determines species richness of parasitic organisms? A meta-analysis across animal, plant and fungal hosts. Biol Rev. 2014;89(1):123–134. doi: 10.1111/brv.12046. [DOI] [PubMed] [Google Scholar]
- 14.Santoro M, Mattiucci S, Cipriani P, Bellisario B, Romanelli F, Cimmaruta R, et al. Parasite communities of Icefish (Chionodraco hamatus) in the Ross sea (Antarctica): Influence of the host sex on the helminth infracommunity structure. PLoS ONE. 2014;9(2):e88876. doi: 10.1371/journal.pone.0088876. [DOI] [PMC free article] [PubMed] [Google Scholar]
- 15.Gustafson KD, Newman RA, Pulis EE, Cabarle KC. A Skeletochronological assessment of age–parasitism relationships in Wood frogs (Lithobates sylvaticus). J Herpetol. 2015;49(1):122–30.
- 16.Fierer N, Hamady M, Lauber CL, Knight R. The influence of sex, handedness, and washing on the diversity of hand surface bacteria. Proc Natl Acad Sci. 2008;105(46):17994–17999. doi: 10.1073/pnas.0807920105. [DOI] [PMC free article] [PubMed] [Google Scholar]
- 17.Martin MO, Gilman FR, Weiss SL. Sex-specific asymmetry within the cloacal microbiota of the striped plateau lizard, Sceloporus virgatus. Symbiosis. 2010;51(1):97–105. doi: 10.1007/s13199-010-0078-y. [DOI] [Google Scholar]
- 18.Kueneman JG, Parfrey LW, Woodhams DC, Archer HM, Knight R, McKenzie VJ. The amphibian skin-associated microbiome across species, space and life history stages. Mol Ecol. 2014;23(6):1238–1250. doi: 10.1111/mec.12510. [DOI] [PubMed] [Google Scholar]
- 19.Fenton A, Knowles SCL, Petchey OL, Pedersen AB. The reliability of observational approaches for detecting interspecific parasite interactions: comparison with experimental results. Int J Parasitol. 2014;44(7):437–445. doi: 10.1016/j.ijpara.2014.03.001. [DOI] [PubMed] [Google Scholar]
- 20.Clay K, Fuqua C, Lively CM, Wade MJ. Microbial Community Ecology of Tick-Borne Human Pathogens. In: Collinge SK, Ray C, editors. Disease Ecology: Community Structure and Pathogen Dynamics. Oxford: Oxford University Press; 2006. pp. 41–57. [Google Scholar]
- 21.Nunn CL, Brezine C, Jolles AE, Ezenwa VO. Interactions between Micro- and Macroparasites predict microparasite species richness across primates. Am Nat. 2014;183(4):494–505. doi: 10.1086/675362. [DOI] [PubMed] [Google Scholar]
- 22.Zimmermann MR, Luth KE, Esch GW. Complex interactions among a nematode parasite (Daubaylia potomaca), a commensalistic annelid (Chaetogaster limnaei limnaei), and trematode parasites in a snail host (Helisoma anceps) J Parasitol. 2011;97(5):788–791. doi: 10.1645/GE-2733.1. [DOI] [PubMed] [Google Scholar]
- 23.Bordes F, Morand S. The impact of multiple infections on wild animal hosts: a review. Infect Ecol Epidemiol. 2011; art 1. doi:10.3402/iee.v3401i3400.7346. [DOI] [PMC free article] [PubMed]
- 24.Telfer S, Lambin X, Birtles R, Beldomenico P, Burthe S, Paterson S, et al. Species interactions in a parasite community drive infection risk in a wildlife population. Science. 2010;330(6001):243–246. doi: 10.1126/science.1190333. [DOI] [PMC free article] [PubMed] [Google Scholar]
- 25.Matthews KR. Controlling and coordinating development in vector-transmitted parasites. Science. 2011;331(6021):1149–1153. doi: 10.1126/science.1198077. [DOI] [PMC free article] [PubMed] [Google Scholar]
- 26.Natsopoulou ME, McMahon DP, Doublet V, Bryden J, Paxton RJ. Interspecific competition in honeybee intracellular gut parasites is asymmetric and favours the spread of an emerging infectious disease. Proc R Soc Lond B. 2015;282(1798):20141896. doi: 10.1098/rspb.2014.1896. [DOI] [PMC free article] [PubMed] [Google Scholar]
- 27.Abu-Raddad LJ, Patnaik P, Kublin JG. Dual infection with HIV and malaria fuels the spread of both diseases in sub-Saharan Africa. Science. 2006;314(5805):1603–1606. doi: 10.1126/science.1132338. [DOI] [PubMed] [Google Scholar]
- 28.Bandilla M, Valtonen ET, Suomalainen LR, Aphalo PJ, Hakalahti T. A link between ectoparasite infection and susceptibility to bacterial disease in rainbow trout. Int J Parasitol. 2006;36(9):987–991. doi: 10.1016/j.ijpara.2006.05.001. [DOI] [PubMed] [Google Scholar]
- 29.Noland GS, Graczyk TK, Fried B, Kumar N. Enhanced malaria parasite transmission from helminth co-infected mice. Am J Trop Med Hyg. 2007;76(6):1052–1056. [PubMed] [Google Scholar]
- 30.Harbison CW, Bush SE, Malenke JR, Clayton DH. Comparative transmission dynamics of competing parasite species. Ecology. 2008;89(11):3186–3194. doi: 10.1890/07-1745.1. [DOI] [PubMed] [Google Scholar]
- 31.Medeiros MCI, Anderson TK, Higashiguchi JM, Kitron UD, Walker ED, Brawn JD, et al. An inverse association between West Nile virus serostatus and avian malaria infection status. Parasit Vectors. 2014;7:art 415. doi: 10.1186/1756-3305-7-415. [DOI] [PMC free article] [PubMed] [Google Scholar]
- 32.Harris RN, Brucker RM, Walke JB, Becker MH, Schwantes CR, Flaherty DC, et al. Skin microbes on frogs prevent morbidity and mortality caused by a lethal skin fungus. ISME J. 2009;3(7):818–824. doi: 10.1038/ismej.2009.27. [DOI] [PubMed] [Google Scholar]
- 33.Aksoy S. Tsetse, a haven for microorganisms. Parasitol Today. 2000;16(3):114–118. doi: 10.1016/S0169-4758(99)01606-3. [DOI] [PubMed] [Google Scholar]
- 34.Cirimotich CM, Dong Y, Clayton AM, Sandiford SL, Souza-Neto JA, Mulenga M, et al. Natural microbe-mediated refractoriness to Plasmodium infection in Anopheles gambiae. Science. 2011;332(6031):855–858. doi: 10.1126/science.1201618. [DOI] [PMC free article] [PubMed] [Google Scholar]
- 35.Gonzalez-Ceron L, Santillan F, Rodriguez MH, Mendez D, Hernandez-Avila JE. Bacteria in midguts of field-collected Anopheles albimanus block Plasmodium vivax sporogonic development. J Med Entomol. 2003;40(3):371–374. doi: 10.1603/0022-2585-40.3.371. [DOI] [PubMed] [Google Scholar]
- 36.Pumpuni CB, Beier MS, Nataro JP, Guers LD, Davis JR. Plasmodium falciparum - inhibition of sporogonic development in Anopheles stephensi by gram-negative bacteria. Exp Parasitol. 1993;77(2):195–199. doi: 10.1006/expr.1993.1076. [DOI] [PubMed] [Google Scholar]
- 37.Yakob L, Williams GM, Gray DJ, Halton K, Solon JA, Clements AC. Slaving and release in co-infection control. Parasit Vectors. 2013;6:art 157. doi: 10.1186/1756-3305-6-157. [DOI] [PMC free article] [PubMed] [Google Scholar]
- 38.Krasnov BR, Matthee S, Lareschi M, Korallo-Vinarskaya NP, Vinarski MV. Co-occurrence of ectoparasites on rodent hosts: null model analyses of data from three continents. OIKOS. 2010;119(1):120–128. doi: 10.1111/j.1600-0706.2009.17902.x. [DOI] [Google Scholar]
- 39.Presley SJ. Interspecific aggregation of ectoparasites on bats: importance of hosts as habitats supersedes interspecific interactions. OIKOS. 2011;120(6):832–841. doi: 10.1111/j.1600-0706.2010.19199.x. [DOI] [Google Scholar]
- 40.Lello J, Boag B, Fenton A, Stevenson IR, Hudson PJ. Competition and mutualism among the gut helminths of a mammalian host. Nature. 2004;428(6985):840–844. doi: 10.1038/nature02490. [DOI] [PubMed] [Google Scholar]
- 41.Sibley CD, Duan K, Fischer C, Parkins MD, Storey DG, Rabin HR, et al. Discerning the complexity of community interactions using a drosophila model of polymicrobial infections. PLoS Pathog. 2008;4(10):e1000184. doi: 10.1371/journal.ppat.1000184. [DOI] [PMC free article] [PubMed] [Google Scholar]
- 42.Kuramitsu HK, He X, Lux R, Anderson MH, Shi W. Interspecies interactions within oral microbial communities. Microbiol Mol Biol Rev. 2007;71(4):653–670. doi: 10.1128/MMBR.00024-07. [DOI] [PMC free article] [PubMed] [Google Scholar]
- 43.Born-Torrijos A, Poulin R, Raga JA, Holzer AS. Estimating trematode prevalence in snail hosts using a single-step duplex PCR: how badly does cercarial shedding underestimate infection rates? Parasit Vectors. 2014;7:art 243. doi: 10.1186/1756-3305-7-243. [DOI] [PMC free article] [PubMed] [Google Scholar]
- 44.Degarege A, Legesse M, Medhin G, Animut A, Erko B. Malaria and related outcomes in patients with intestinal helminths: a cross-sectional study. BMC Infect Dis. 2012;12:291. doi: 10.1186/1471-2334-12-291. [DOI] [PMC free article] [PubMed] [Google Scholar]
- 45.Gelaw A, Anagaw B, Nigussie B, Silesh B, Yirga A, Alem M, et al. Prevalence of intestinal parasitic infections and risk factors among schoolchildren at the University of Gondar community school, northwest Ethiopia: a cross-sectional study. BMC Public Health. 2013;13:304. doi: 10.1186/1471-2458-13-304. [DOI] [PMC free article] [PubMed] [Google Scholar]
- 46.Traub RJ, Pednekar RP, Cuttell L, Porter RB, Abd Megat Rani PA, Gatne ML. The prevalence and distribution of gastrointestinal parasites of stray and refuge dogs in four locations in India. Vet Parasitol. 2014;205(1–2):233–238. doi: 10.1016/j.vetpar.2014.06.037. [DOI] [PubMed] [Google Scholar]
- 47.Bai Y, Calisher CH, Kosoy MY, Root JJ, Doty JB. Persistent infection or successive reinfection of deer mice with Bartonella vinsonii subsp arupensis. Appl Environ Microbiol. 2011;77(5):1728–1731. doi: 10.1128/AEM.02203-10. [DOI] [PMC free article] [PubMed] [Google Scholar]
- 48.Holmstad PR, Hudson PJ, Skorping A. The influence of a parasite community on the dynamics of a host population: a longitudinal study on willow ptarmigan and their parasites. OIKOS. 2005;111(2):377–391. doi: 10.1111/j.0030-1299.2005.13640.x. [DOI] [Google Scholar]
- 49.Telfer S, Begon M, Bennett M, Bown KJ, Burthe S, Lambin X, et al. Contrasting dynamics of Bartonella spp. in cyclic field vole populations: the impact of vector and host dynamics. Parasitology. 2007;134:413–425. doi: 10.1017/S0031182006001624. [DOI] [PMC free article] [PubMed] [Google Scholar]
- 50.Krasnov BR, Shenbrot GI, Khokhlova IS, Hawlena H, Degen AA. Temporal variation in parasite infestation of a host individual: does a parasite-free host remain uninfested permanently? Parasitol Res. 2006;99:541–545. doi: 10.1007/s00436-006-0201-4. [DOI] [PubMed] [Google Scholar]
- 51.Fenton A, Viney ME, Lello J. Detecting interspecific macroparasite interactions from ecological data: patterns and process. Ecol Lett. 2010;13(5):606–615. doi: 10.1111/j.1461-0248.2010.01458.x. [DOI] [PubMed] [Google Scholar]
- 52.Martinez-de la Puente J, Martinez J, Rivero-de Aguilar J, Herrero J, Merino S. On the specificity of avian blood parasites: revealing specific and generalist relationships between haemosporidians and biting midges. Mol Ecol. 2011;20(15):3275–3287. doi: 10.1111/j.1365-294X.2011.05136.x. [DOI] [PubMed] [Google Scholar]
- 53.Sacks D, Kamhawi S. Molecular aspects of parasite-vector and vector-host interactions in Leishmaniasis. Annu Rev Microbiol. 2001;55:453–483. doi: 10.1146/annurev.micro.55.1.453. [DOI] [PubMed] [Google Scholar]
- 54.Nuttall PA. Displaced tick-parasite interactions at the host interface. Parasitology. 1998;116:S65–S72. doi: 10.1017/S003118200008495X. [DOI] [PubMed] [Google Scholar]
- 55.Medeiros MCI, Hamer GL, Ricklefs RE. Host compatibility rather than vector-host-encounter rate determines the host range of avian Plasmodium parasites. Proc R Soc B. 2013;280:art 20122947. doi: 10.1098/rspb.2012.2947. [DOI] [PMC free article] [PubMed] [Google Scholar]
- 56.Clutton-Brock T, Sheldon BC. Individuals and populations: the role of long-term, individual-based studies of animals in ecology and evolutionary biology. Trends Ecol Evol. 2010;25(10):562–573. doi: 10.1016/j.tree.2010.08.002. [DOI] [PubMed] [Google Scholar]
- 57.Burnham KP, Anderson DR. Model Selection and Multimodel Inference: A Practical Information- Theoretic Approach, Second edn. New York: Springer- Varlag New York, Inc; 2002. [Google Scholar]
- 58.Wootton JT. Predicting direct and indirect effects - an integrated approach using experiments and path-analysis. Ecology. 1994;75(1):151–165. doi: 10.2307/1939391. [DOI] [Google Scholar]
- 59.Kedem H, Cohen C, Messika I, Einav M, Hawlena H. Multiple effects of host species diversity on coexisting host-specific and host-opportunistic microbes. Ecology. 2014;95:1173–1183. doi: 10.1890/13-0678.1. [DOI] [PubMed] [Google Scholar]
- 60.Hawlena H, Abramsky Z, Krasnov BR. Ectoparasites and age-dependent survival in a desert rodent. Oecologia. 2006;148(1):30–39. doi: 10.1007/s00442-005-0345-4. [DOI] [PubMed] [Google Scholar]
- 61.Peig J, Green AJ. New perspectives for estimating body condition from mass⁄length data: the scaled mass index as an alternative method. OIKOS. 2009;118:1883–1891. doi: 10.1111/j.1600-0706.2009.17643.x. [DOI] [Google Scholar]
- 62.Parmenter CA, Yates TL, Parmenter RR, Mills JN, Childs JE, Campbell ML, et al. Small mammal survival and trapability in mark-recapture monitoring programs for hantavirus. J Wildl Dis. 1998;34(1):1–12. doi: 10.7589/0090-3558-34.1.1. [DOI] [PubMed] [Google Scholar]
- 63.Gavish Y, Kedem H, Messika I, Cohen C, Toh E, Munro D, et al. Association of host and microbial species diversity across spatial scales in desert rodent communities. PLoS ONE. 2014;9(10):e109677. doi: 10.1371/journal.pone.0109677. [DOI] [PMC free article] [PubMed] [Google Scholar]
- 64.Cohen C, Toh E, Munro D, Dong Q, Hawlena H. Similarities and seasonal variations in bacterial communities from the blood of vertebrates and from their vectors. ISME J. 2015;9(7):1662–76 . [DOI] [PMC free article] [PubMed]
- 65.Hawlena H, Rynkiewicz E, Toh E, Alfred A, Durden LA, Hastriter MW, et al. The arthropod, but not the vertebrate host or its environment, dictates bacterial community composition of fleas and ticks. ISME J. 2013;7(1):221–223. doi: 10.1038/ismej.2012.71. [DOI] [PMC free article] [PubMed] [Google Scholar]
- 66.Gutiérrez R, Morick D, Cohen C, Hawlena H, Harrus S. The effect of ecological and temporal factors on the composition of Bartonella infection in rodents and their fleas. ISME J. 2014;8(8):1598–608. [DOI] [PMC free article] [PubMed]
- 67.Pedhazur EJ. Multiple-Regression in Behavioral-Research: Explanation and Prediction, vol. 7. 2. Orlando, FL: Harcourt Brace; 1983. [Google Scholar]
- 68.Desilets HD, Locke SA, McLaughlin JD, Marcogliese DJ. Community structure of Diplostomum spp. (Digenea: Diplostomidae) in eyes of fish: main determinants and potential interspecific interactions. Int J Parasitol. 2013;43(11):929–939. doi: 10.1016/j.ijpara.2013.07.002. [DOI] [PubMed] [Google Scholar]
- 69.Hawlena H, Abramsky Z, Krasnov BR. Age-biased parasitism and density-dependent distribution of fleas (Siphonaptera) on a desert rodent. Oecologia. 2005;146(2):200–208. doi: 10.1007/s00442-005-0187-0. [DOI] [PubMed] [Google Scholar]
- 70.Johnson PTJ, Buller ID. Parasite competition hidden by correlated coinfection: using surveys and experiments to understand parasite interactions. Ecology. 2011;92(3):535–541. doi: 10.1890/10-0570.1. [DOI] [PubMed] [Google Scholar]
- 71.Hawlena H, Bashey F, Lively CM. Bacteriocin-mediated interactions within and between coexisting species. Ecol Evol. 2012;2(10):2516–2521. doi: 10.1002/ece3.354. [DOI] [PMC free article] [PubMed] [Google Scholar]
- 72.Rohde K. Intraspecific and interspecific interactions in low-density populations in resource-rich habitats. OIKOS. 1991;60(1):91–104. doi: 10.2307/3544997. [DOI] [Google Scholar]
- 73.Krasnov BR, Stanko M, Morand S. Competition, facilitation or mediation via host? Patterns of infestation of small European mammals by two taxa of haematophagous arthropods. Ecol Entomol. 2010;35(1):37–44. doi: 10.1111/j.1365-2311.2009.01153.x. [DOI] [Google Scholar]
- 74.Poulin R. Interactions between species and the structure of helminth communities. Parasitology. 2001;122:S3–S11. doi: 10.1017/S0031182000016991. [DOI] [PubMed] [Google Scholar]
- 75.Benson LA, Kar S, McLaughlin G, Ihler GM. Entry of Bartonella-bacilliformis into erythrocytes. Infect Immun. 1986;54(2):347–353. doi: 10.1128/iai.54.2.347-353.1986. [DOI] [PMC free article] [PubMed] [Google Scholar]
- 76.Wilson K, Bjørnstad ON, Dobson AP, Merler S, Poglayen G, Randolph SE, et al. Heterogeneities in Macroparasite Infections: Patterns and Processes. In: Hudson PJ, Rizzoli A, Grenfell BT, Heesterbeek H, Dobson AP, et al., editors. The Ecology of Wildlife Disease, vol. 2. Oxford: Oxford University Press; 2002. pp. 6–44. [Google Scholar]
- 77.Miller TE, Travis J. The evolutionary role of indirect effects in communities. Ecology. 1996;77(5):1329–1335. doi: 10.2307/2265530. [DOI] [Google Scholar]
- 78.Maggi RG, Compton SM, Trull CL, Mascarelli PE, Mozayeni BR, Breitschwerdt EB. Infection with Hemotropic Mycoplasma species in patients with or without extensive arthropod or animal contact. J Clin Microbiol. 2013;51(10):3237–3241. doi: 10.1128/JCM.01125-13. [DOI] [PMC free article] [PubMed] [Google Scholar]
- 79.Museux K, Boretti FS, Willi B, Riond B, Hoelzle K, Hoelzle LE, et al. In vivo transmission studies of ‘Candidatus Mycoplasma turicensis’ in the domestic cat. Vet Res. 2009;40:art 45. doi: 10.1051/vetres/2009028. [DOI] [PMC free article] [PubMed] [Google Scholar]
- 80.Dietz S, Mack S-L, Hoelzle K, Becker K, Jannasch C, Stadler J, et al. Quantitative PCR analysis of Mycoplasma suis shedding patterns during experimental infection. Vet Microbiol. 2014;172(3–4):581–585. doi: 10.1016/j.vetmic.2014.06.019. [DOI] [PubMed] [Google Scholar]
- 81.Almy FS, Ladd SM, Sponenberg DP, Crisman MV, Messick JB. Mycoplasma haemolamae infection in a 4-day-old cria: support for in utero transmission by use of a polymerase chain reaction assay. Can Vet J. 2006;47(3):229–233. [PMC free article] [PubMed] [Google Scholar]
- 82.Jones RT, Knight R, Martin AP. Bacterial communities of disease vectors sampled across time, space, and species. ISME J. 2010;4:223–231. doi: 10.1038/ismej.2009.111. [DOI] [PubMed] [Google Scholar]
- 83.Chomel BB, Kasten RW, FloydHawkins K, Chi BH, Yamamoto K, RobertsWilson J, et al. Experimental transmission of Bartonella henselae by the cat flea. J Clin Microbiol. 1996;34(8):1952–1956. doi: 10.1128/jcm.34.8.1952-1956.1996. [DOI] [PMC free article] [PubMed] [Google Scholar]
- 84.Morick D, Krasnov BR, Khokhlova IS, Gottlieb Y, Harrus S. Investigation of Bartonella acquisition and transmission in Xenopsylla ramesis fleas (Siphonaptera: Pulicidae) Mol Ecol. 2011;20(13):2864–2870. doi: 10.1111/j.1365-294X.2011.05033.x. [DOI] [PubMed] [Google Scholar]
- 85.Morick D, Krasnov BR, Khokhlova IS, Gutierrez R, Gottlieb Y, Harrus S. Vertical nontransovarial transmission of Bartonella in fleas. Mol Ecol. 2013;22:4747–4752. doi: 10.1111/mec.12408. [DOI] [PubMed] [Google Scholar]
- 86.Brettschneider H, Anguelov R, Chimimba CT, Bastos ADS. A mathematical epidemiological model of gram-negative Bartonella bacteria: does differential ectoparasite load fully explain the differences in infection prevalence of Rattus rattus and Rattus norvegicus? J Biol Dyn. 2012;6(2):763–781. doi: 10.1080/17513758.2012.705906. [DOI] [PubMed] [Google Scholar]
- 87.Pitcher DG, Nicholas RAJ. Mycoplasma host specificity: fact or fiction? Vet J. 2005;170(3):300–306. doi: 10.1016/j.tvjl.2004.08.011. [DOI] [PubMed] [Google Scholar]
- 88.Harms A, Dehio C. Intruders below the radar: molecular pathogenesis of Bartonella spp. Clin Microbiol Rev. 2012;25(1):42–78. doi: 10.1128/CMR.05009-11. [DOI] [PMC free article] [PubMed] [Google Scholar]
- 89.Marignac G, Barrat F, Chomel B, Vayssier-Taussat M, Gandoin C, Bouillin C, et al. Murine model for Bartonella birtlesii infection: new aspects. Comp Immunol Microbiol Infect Dis. 2010;33(2):95–107. doi: 10.1016/j.cimid.2008.07.011. [DOI] [PubMed] [Google Scholar]
- 90.Kosoy MY, Regnery RL, Kosaya OI, Childs JE. Experimental infection of cotton rats with three naturally occurring Bartonella species. J Wildl Dis. 1999;35(2):275–284. doi: 10.7589/0090-3558-35.2.275. [DOI] [PubMed] [Google Scholar]
- 91.Guptill L, Slater L, Wu CC, Glickman LT, Lin TL, Welch DF, et al. Immune response of neonatal specific pathogen-free cats to experimental infection with Bartonella henselae. Vet Immunol Immunopathol. 1999;71(3–4):233–243. doi: 10.1016/S0165-2427(99)00104-X. [DOI] [PubMed] [Google Scholar]
- 92.Gutiérrez R, Krasnov B, Morick D, Gottlieb Y, Khokhlova IS, Harrus S. Bartonella infection in rodents and their flea ectoparasites: an overview. Vector Borne Zoonotic Dis. 2015;15(1):27–39. doi: 10.1089/vbz.2014.1606. [DOI] [PMC free article] [PubMed] [Google Scholar]
- 93.Hawlena H, Bashary D, Abramsky Z, Krasnov BR. Benefits, costs and constraints of anti-parasitic grooming in adult and juvenile rodents. Ethology. 2007;113(4):394–402. doi: 10.1111/j.1439-0310.2007.01332.x. [DOI] [Google Scholar]
- 94.Hawley DM, Altizer SM. Disease ecology meets ecological immunology: understanding the links between organismal immunity and infection dynamics in natural populations. Funct Ecol. 2011;25:48–60. doi: 10.1111/j.1365-2435.2010.01753.x. [DOI] [Google Scholar]
- 95.Abramsky Z. Population biology of Gerbillus allenbyi in Northern Israel. Mammalia. 1984;48(2):197–206. doi: 10.1515/mamm.1984.48.2.197. [DOI] [Google Scholar]
- 96.Jones KE, Patel NG, Levy MA, Storeygard A, Balk D, Gittleman JL, et al. Global trends in emerging infectious diseases. Nature. 2008;451(7181):990–994. doi: 10.1038/nature06536. [DOI] [PMC free article] [PubMed] [Google Scholar]
- 97.Barrett R, Kuzawa CW, McDade T, Armelagos GJ. Emerging and re-emerging infectious diseases: the third epidemiologic transition. Annu Rev Anthropol. 1998;27:247–271. doi: 10.1146/annurev.anthro.27.1.247. [DOI] [Google Scholar]
- 98.Daszak P, Cunningham AA, Hyatt AD. Wildlife ecology - emerging infectious diseases of wildlife - threats to biodiversity and human health. Science. 2000;287(5452):443–449. doi: 10.1126/science.287.5452.443. [DOI] [PubMed] [Google Scholar]
- 99.Medlock JM, Vaux AGC. Impacts of the creation, expansion and management of English wetlands on mosquito presence and abundance - developing strategies for future disease mitigation. Parasit Vectors. 2015;8:art 142. doi: 10.1186/s13071-015-0751-3. [DOI] [PMC free article] [PubMed] [Google Scholar]