

Abstract
Plasmon rulers, consisting of pairs of gold nanoparticles, allow single-molecule analysis without photobleaching or blinking; however, current plasmon rulers are irreversible, restricting detection to only single events. Here, we present a reversible plasmon ruler, comprised of coupled gold nanoparticles linked by a single aptamer, capable of binding individual secreted molecules with high specificity. We show that the binding of target secreted molecules to the reversible plasmon ruler is characterized by single-molecule sensitivity, high specificity, and reversibility. Such reversible plasmon rulers should enable dynamic and adaptive live-cell measurement of secreted single molecules in their local microenvironment.
Keywords: plasmon, single-molecule, secreted molecule, imaging, gold nanoparticle
Precise measurement of secreted molecules such as growth factors, proteases, and morphogens can provide insight into how their concentration gradients form between the cell and the cellular microenvironment and how cells respond to these concentration gradients in development1–6 and in cancer.7–9 Investigations of secreted molecules have relied primarily on fluorescence-based ensemble methods that are inherently limited in sensitivity as well as spatial and temporal resolution, making it difficult to detect the diffusible molecules in their native microenvironment. Micro- and nanopatterned structures10–13 have been utilized to physically confine diffusible molecules. But detection of molecules secreted in low abundance remains challenging using currently available methods.
The ability to detect single molecules provides a promising approach for measuring secreted molecules within their local microenvironment. Available fluorescence-based single-molecule methods are prone to photobleaching, blinking, and low signal-to-noise. Recently, plasmon rulers,14 consisting of pairs of gold nanoparticles, have enabled dynamic detection of single-molecule activity without photobleaching or blinking.14–24 Two gold nanoparticles can be coupled together using a single biomolecule substrate, such as a cleavable DNA or peptide substrate, where the substrate length determines the distance between the two nanoparticles. When the two gold nanoparticles are brought into close proximity, the surface plasmon resonances of the individual nanoparticles will couple, generating a light scattering spectrum that is dependent on their interparticle distance. High spatial resolution of single molecules is achievable because of the large scattering cross-section and therefore high intensity of the scattered spectrum. The light scattering spectrum also is time invariant and can be continuously acquired in real time, resulting in high (ms-min) temporal resolution over the course of long imaging periods. Intracellular endonuclease cleaving dynamics21 and intracellular protease activity18 have been visualized with high spatial and temporal resolution using plasmon rulers that otherwise would be difficult to observe using conventional bulk methods.
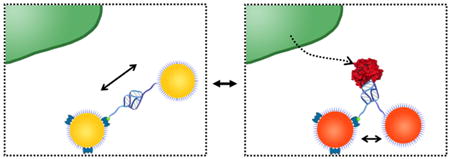
Beyond cleavage, visualizing binding can provide a complete picture of molecules secreted into the cellular microenvironment. Current plasmon rulers that rely on cleavage of their biomolecule substrate to generate a change in their interparticle distance are limited to a subset of active enzymatic molecules. Moreover, cleaving is irreversible, restricting detection to single events. Plasmon rulers that utilize binding14,16,25–28 have been nonspecific so far for the protein-of-interest or have been limited to complementary nucleic acids. Here, we present a reversible plasmon ruler, comprised of coupled gold nanoparticles linked by a single aptamer, capable of binding single protein molecules with high specificity (Figure 1a). A conformational change in the aptamer, upon binding with the protein-of-interest, generates a change in the interparticle distance of the plasmon ruler that is observable in the light scattering spectrum. In principle, a reversible plasmon ruler can be designed to detect any target molecule including growth factors, proteases, and morphogens with high specificity through selection of their cognate aptamer. We show that this class of reversible plasmon rulers is characterized by single-molecule sensitivity, high specificity, and reversibility needed for live-cell detection of secreted single protein molecules in the cellular microenvironment.
Figure 1.
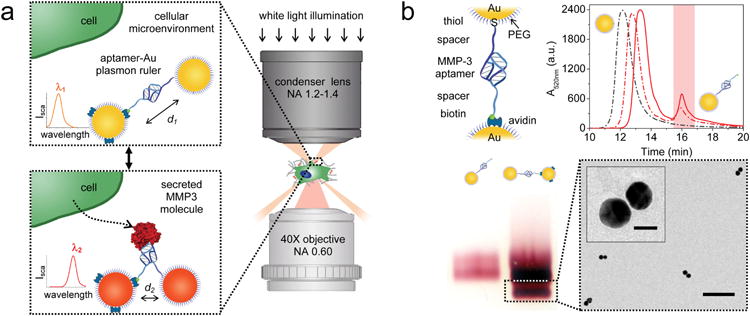
Reversible aptamer-Au plasmon ruler strategy to measure secreted single molecules within the cellular microenvironment. (a) Reversible aptamer-Au plasmon ruler, comprised of aptamer-linked gold nanoparticles, is capable of specifically binding individual secreted matrix metalloproteinase molecules in the cellular microenvironment. The binding of the target molecule to the plasmon ruler generates a change in the interparticle distance of the latter, resulting in a shift in the plasmon resonance wavelength that is colorimetrically and spectroscopically observed using transmission-mode dark-field microscopy. (b) Assembly of reversible plasmon rulers. First, Au nanoparticles (30 nm diameter) are functionalized with DNA aptamers with a thiol group on one end and a biotin group on the other end. High-performance liquid chromatography (HPLC) is then performed to separate Au nanoparticles functionalized with exactly one aptamer. Elution profiles of varying aptamer concentrations for functionalizing Au nanoparticles show a leftmost peak corresponding to unconjugated Au nanoparticles and a rightmost peak corresponding to Au nanoparticles conjugated with one aptamer. In the elution profile, the black dotted line represents 0 μM aptamer concentration, the red dotted line represents 1.0 μM aptamer concentration, and the red solid line represents 1.6 μM aptamer concentration. Monomeric aptamer-Au nanoparticles are then stochiometrically added to avidin-coated Au nanoparticles (1:1). Finally, aptamer-Au plasmon rulers are separated using gel electrophoresis and analyzed by transmission electron microscopy. Scale bar of the population image is 200 nm and inset scale bar is 30 nm.
Results and Discussion
In order to validate the reversible plasmon ruler, we selected a matrix metalloproteinase, MMP3, as the target molecule because it is known to be secreted by the mammary gland to mediate invasion and branching morphogenesis in puberty4,29,30 and is responsible for apoptosis and remodeling in involution,31 disruption of cell and tissue polarity in cancer,29,32,33 as well as regulation of noncanonical paracrine signaling pathways.34,35 DNA aptamers targeting MMP3 were modified with a biotin group on one end and a thiol group on the other end and folded into a tertiary structure. Aptamers can be generally functionalized to Au nanoparticles;36–38 however, to achieve single-molecule sensitivity, Au nanoparticles comprised of exactly one aptamer are needed. We controlled the average number of aptamers per Au nanoparticle by adjusting the aptamer/Au nanoparticle ratios. After the addition of aptamers with Au nanoparticles, the heterogeneous mixture was purified using high-performance liquid chromatography (HPLC) to obtain monomeric aptamer-Au nanoparticles (Figure 1b). Two Au nanoparticles were assembled through avidin-biotin and Au-thiol chemistries and purified using gel electrophoresis to form the final plasmon ruler structure. Sample homogeneity was confirmed by transmission electron microscopy (Figure 1b and Supporting Information Figure S1).
Having established that we could assemble plasmon rulers consisting of a single aptamer, we investigated whether binding of MMP3 molecules could be measured at the single-molecule level. Plasmon rulers were immobilized such that one particle was bound to the glass surface through biotin-avidin chemistry and the other particle was free to move in solution. Scattering images and spectra of individual plasmon rulers were acquired using a transmission-mode dark-field microscope outfitted with a true-color imaging charge-coupled device (CCD) camera and spectrometer (Supporting Information Figure S2 and Figure 2a). To investigate binding, we selected the protein concentration to be on the order of the dissociation constant Kd. Upon addition of recombinant MMP3 (9 nM), single plasmon rulers exhibited a spectral redshift of 12 nm (Figure 2a). No spectral shift was observed in a control experiment with plasmon rulers consisting of a mismatched sequence. We surmised that the observed spectral redshift was due to a decrease in the interparticle distance upon binding of the MMP3 molecule to the aptamer between the two Au nanoparticles. The utility of plasmon rulers as nanoscale distance sensors is based on their spectroscopic signatures,39 which redshift with decreasing distance between nanoparticles. With calibration, the spectroscopic position therefore can be used to determine the interparticle spacing before and after binding of recombinant MMP3. Supporting Information Figure S4 shows the result of a calculation of the peak position with changing interparticle distance based on electromagnetic simulation. The results of this simulation are intended to give qualitative guidance, as they are modeled as dimers in solution with a fixed polarization and do not account for the refractive index of the substrate or cellular environment, and the polarization of the incident light is assumed to excite only the longitudinal mode. Spectral shifts of 12 nm are readily achievable with small changes in the interparticle distance. Another way to assess the change in distance is to characterize the plasmon rulers in the absence and presence of recombinant MMP3 protein using transmission electron microscopy.40 The interparticle distance distribution in Figure 2b shows a mean interparticle distance of 9.5 nm in the absence of recombinant MMP3. After the addition of recombinant MMP3 (9 nM), the mean interparticle distance decreased to 2.5 nm. The experimental and electromagnetic simulation results show a decrease in the interparticle distance upon binding of MMP3 and are consistent with the spectral redshifts observed by dark-field microscopy. These results suggest that a conformational change in the aptamer occurred before and after binding of the target molecule to the aptamer that was observable at the single-molecule level.
Figure 2.
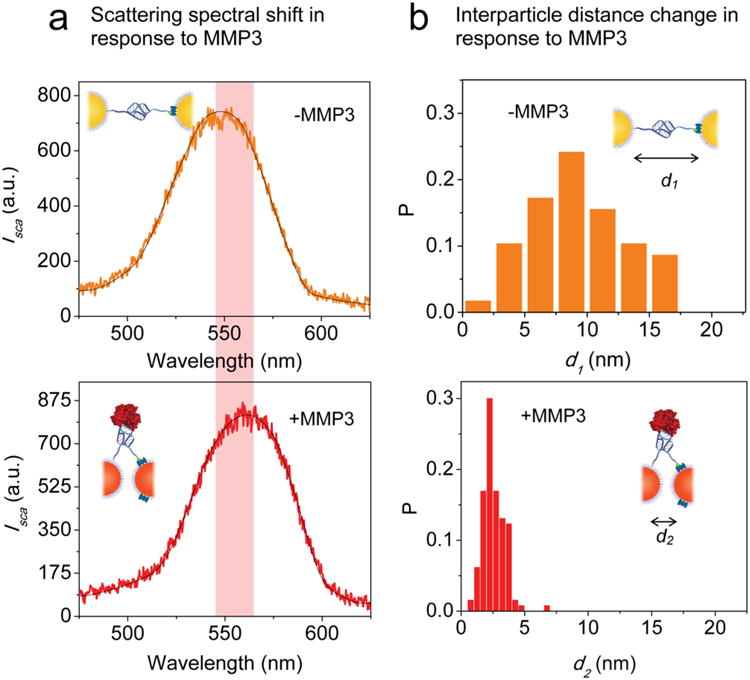
Aptamer-Au plasmon rulers bind to single MMP3 molecules. (a) Spectral analysis: Representative scattering spectrum of single aptamer-Au plasmon rulers in the absence of recombinant MMP3 observed using transmission-mode darkfield microscopy (top). Representative scattering spectrum of single aptamer-Au plasmon rulers in the presence of recombinant MMP3 (9 nM concentration), showing a spectral shift of 12 nm due to binding of MMP3 molecule to the aptamer-Au plasmon ruler (bottom). (b) Distance analysis: Distribution histogram of inter-particle distance in the absence of recombinant MMP3 measured by transmission electron microscopy, where P is the number of plasmon rulers with inter-particle distance d1 / total number of plasmon rulers in the observed population (top). Mean inter-particle distance is 9.5 nm in the absence of recombinant MMP3. Distribution histogram of inter-particle distance in the presence of recombinant MMP3 (9 nM concentration), where P is the number of plasmon rulers with inter-particle distance d2 / total number of plasmon rulers in the observed population (bottom). Mean inter-particle distance is 2.5 nm in the presence of recombinant MMP3.
To address this question of whether the binding between single MMP3 molecules and the aptamer-Au plasmon ruler were reversible, plasmon rulers were immobilized with one particle bound to the glass surface. Buffer containing 9 and 0 nM recombinant MMP3 was then alternately exchanged, and the peak wavelength of the plasmon resonance was monitored during this buffer exchange. We observed that the peak wavelength alternately redshifted and blueshifted by approximately 12 nm in response to the buffer exchange, indicating that the binding of MMP3 to the aptamer-Au plasmon ruler was reversible (Figure 3a). Notably, the response time of the observed peak shift was within 1 min, showing that plasmon rulers as sensors are truly suitable for dynamic and adaptive sensing with single sensor resolution.
Figure 3.
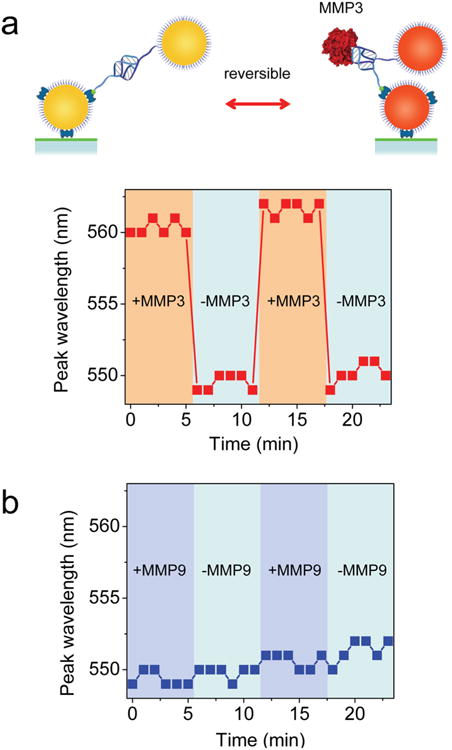
Aptamer-Au plasmon ruler binding to MMP3 molecules is reversible and specific. (a) Aptamer-Au plasmon ruler is immobilized with one nanoparticle bound to the glass surface using biotin-avidin chemistry. Peak wavelength of the plasmon resonance of an aptamer-Au plasmon ruler when alternately flushed with buffer containing 9 and 0 nM recombinant MMP3. The peak wavelength of the plasmon resonance increases (redshift) with addition of recombinant MMP3, indicating a decrease in the interparticle distance due to binding of recombinant MMP3 molecule to the aptamer-Au plasmon ruler. The peak wavelength of the plasmon resonance then decreases (blueshift) in the absence of recombinant MMP3, indicating an increase in the interparticle distance when the aptamer-Au plasmon ruler is unbound. Alternately flushing with buffer containing 9 and 0 nM recombinant MMP3 results in the peak wavelength that alternately redshifts and blueshifts, strongly suggesting that binding of MMP3 to the aptamer-Au plasmon ruler is reversible. (b) As a control, the peak wavelength of the plasmon resonance of an aptamer-Au plasmon ruler did not shift when alternately flushed with buffer containing 9 and 0 nM recombinant MMP9.
Such reversible and dynamic response of these plasmon rulers is enabled by the choice of a reversible aptamer-protein binding reaction. The concentration of plasmon rulers [A]0 was selected to be much lower than the dissociation constant Kd of the binding reaction to maximize bioorthogonality and also minimize optical crosstalk between plasmon rulers. Under this condition, the yield of the aptamer-protein binding reaction Yb depends solely on the initial protein concentration [P]0
| (1) |
The detection sensitivity for protein molecules then becomes equal to the dissociation constant (Supporting Information). Thus, 12.5 nM MMP3 protein molecules are needed to bind with 50% of plasmon rulers and to initiate a response. Meanwhile, because of this low plasmon ruler concentration, the yield of the unbinding reaction Yu is close to 1
| (2) |
The unbinding reaction therefore progresses almost completely once the protein concentration goes to zero (Supporting Information), making the sensing of the plasmon ruler reversible. The kon and koff rates of the aptamer-protein reaction can be estimated from Figure 3: the unbinding event completes on a time scale of less than 1 min, which indicates a koff higher than 0.1 s−1 and a kon lower than 8 × 10⁶ s−1 M−1.
In order to verify the specificity of the aptamer, we used MMP9 as a control protein because of the sequence and structural similarities between matrix metalloproteinase family members.41 Buffer containing 9 and 0 nM recombinant MMP9 was alternately exchanged. We observed that the peak wavelength did not shift during this buffer exchange (Figure 3b), indicating that reversible aptamer-Au plasmon rulers were indeed specific to MMP3 molecules.
It was observed that a difference in the spectral peak position occurred for plasmon rulers characterized in buffer solution and in cell culture medium. The peak position of the scattering spectrum redshifted in cell culture medium as compared to buffer solution. The plasmon rulers then further redshift in the presence of MMP3, indicating that MMP3 could be detected in cell culture medium. We surmise that the slight difference in peak position may be due to compounds, such as salts, carbohydrates, vitamins, amino acids, metabolic precursors, and growth factors, in the cell culture medium that may decrease the electrostatic repulsion and therefore decrease the separation between the two nanoparticles of the plasmon ruler, resulting in a redshifted spectrum in the cell culture medium.
Finally, we investigated whether aptamer-Au plasmon rulers could be used to measure the level of secreted MMP3 molecules in the mammary epithelial cell microenvironment in culture. Aptamer-Au plasmon rulers were immobilized with one particle bound to the glass surface using biotin-avidin chemistry. Non-malignant murine SCp2 mammary epithelial cells secreting MMP3 (control) or with their endogenous MMP3 knocked down using shRNA were cultured on glass surfaces (Figure 4c,d). Using immunofluorescence, we verified that control SCp2 mammary epithelial cells stained for MMP3, whereas cells with MMP3 knockdown did not stain for the protein (Figure 4e,f). We detected a distinct shift in the scattering peak wavelength and decrease in intensity of aptamer-Au plasmon rulers when in the presence of MMP3 knockdown cells, relative to their control counterparts (Figure 4c,d). The peak wavelength distributions show that the mean peak wavelength redshifted in the presence of MMP3 and blueshifted in the absence of MMP3. Beyond merely sensing the presence of secreted MMP3 molecules using plasmon rulers, the concentration of secreted MMP3 molecules in the local microenvironment can be quantitatively determined using plasmon rulers. From Figure 4c,d, 75% of plasmon rulers were bound with secreted MMP3. On the basis of this plasmon ruler response, the MMP3 concentration was calculated to be approximately 37.5 nM in the local microenvironment of control Scp2 cells.
Figure 4.
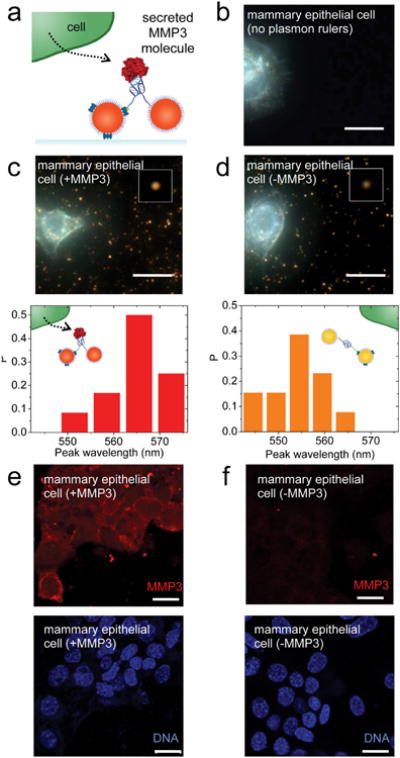
Secreted single MMP3 molecules within the mammary epithelial cell microenvironment can be detected and measured using aptamer-Au plasmon rulers. (a) Aptamer-Au plasmon ruler is immobilized with one nanoparticle bound to the glass surface using biotinavidin chemistry. SCp2 mammary epithelial cells are then cultured on the glass surface. Cells secrete MMP3 molecules into their local microenvironment which then bind to aptamer-Au plasmon rulers. (b) Control: Darkfield scattering image of SCp2 mammary epithelial cells in the absence of aptamer-Au plasmon rulers. (c) Darkfield scattering image of aptamer-Au plasmon rulers in the local microenvironment of wild-type SCp2 mammary epithelial cells. Inset shows representative individual aptamer-Au plasmon ruler. Histogram of peak wavelength, where P is the number of plasmon rulers with a peak wavelength value / total number of plasmon rulers in the observed population. The peak wavelength of plasmon resonance is observed to red-shift in the presence of secreted MMP3. (d) Darkfield scattering image of aptamer-Au plasmon rulers in the local microenvironment of SCp2 mammary epithelial cells with knocked down MMP3 expression. Inset shows representative individual aptamer-Au plasmon ruler. Histogram of peak wavelength, where P is the number of plasmon rulers with a peak wavelength value / total number of plasmon rulers in the observed population. (e–f) Immunofluorescence images of SCp2 mammary epithelial cells with MMP3 wild-type (e) and knock down (f) stained for MMP3 (red) and DNA with DAPI (blue). Scale bars are 20 μm.
In conclusion, we have demonstrated a reversible aptamer-Au plasmon ruler capable of binding single secreted molecules with high specificity. In the future, we anticipate that plasmon rulers can be used to precisely quantify secreted molecules to understand how their concentration gradients form and evolve within their cellular microenvironments. Studies are underway to characterize spatial and temporal resolution in live cells. To move toward in vivo studies, the stability and degradation of aptamer-Au plasmon rulers should be addressed. Phosphorothioate backbone could be incorporated into aptamers to reduce potential degradation by nucleases in the intracellular and in vivo environment. Aptamer-Au plasmon rulers are currently being developed for use in three-dimensional culture models and in vivo, where plasmon rulers could dispersed within the extracellular matrix (i.e., collagen). We envision that quantification of secreted single molecules, including growth factors, proteases, and morphogens, within three-dimensional cellular microenvironments can provide insight into how tissues form and get patterned during development and may suggest therapeutic strategies to repair diseased tissues in the future.
Methods
Au Nanoparticle Preparation
Citrate-stabilized Au nanoparticles (30 nm, Ted-Pella) at a concentration of 2E11 particles/mL were ligand-exchanged overnight with bis(psulfanatophenyl)phenyl-phosphine (BSPP, Strem Chemicals) at a concentration of 1 mg/mL. To remove excess BSPP, BSPP-stabilized Au nanoparticles were then centrifuged at 5000 rpm for 50 min. The supernatant was removed and the BSPP-stabilized Au nanoparticles were suspended 10 mg BSPP/1 mL deionized (DI) water. The nanoparticle concentration was determined by UV–vis absorption spectroscopy based on the particle size of 30 nm and extinction coefficient of 3.585 × 10⁹ M−1 cm−1 (obtained from Ted-Pella). The stock solution was concentrated to achieve a final concentration of 2 × 10¹³ particles/mL and stored at ambient temperature.
Aptamer Preparation
DNA aptamer targeting MMP3 (ATW0062, Base Pair Biotechnologies) was conjugated with a biotin group on one end and a thiol group on the other end. The stock solution was prepared by suspending the lyophilized aptamer in 10 mM Tris buffer containing 0.5 mM EDTA at a stock concentration of 100 μM and stored at –20 °C. To fold the aptamer, the working solution was heated to 90 °C for 2 min and then cooled to room temperature.
Monomeric Aptamer-Au Nanoparticle Preparation
To functionalize Au nanoparticles with aptamers, 80 μL of stock solution of Au nanoparticles (2 × 10¹³ particles/mL), varying concentrations of 0–1.6 μM of folded aptamers, 10 μL of 10 mg/mL BSPP in DI water, and 5 μL of 500 mM NaCl in DI water was mixed and reacted overnight at room temperature. In this step, a small volume (5 μL) of NaCl at high concentration (500 mM NaCl) was chosen to avoid diluting the total volume. To ligand-exchange BSPP with PEG, the reaction mixture was mixed with 10 μL of 10:1 40 mM HS-(CH2)11-EG6OH (HS-PEG–OH, Prochimia)/40 mM HS-C11-EG6-OCH2-COOH (HS-PEG-COOH, Prochimia) and reacted for 3.5 h at room temperature. Finally, high-performance liquid chromatography (HPLC) was performed to separate and collect monomeric aptamer-Au nanoparticles as previously described.42 On the basis of elution profiles in Figure 1b, the condition using 1.6 μM folded aptamers was selected for aptamer-Au plasmon ruler assembly. Sample elution was detected by monitoring UV–vis absorption at the plasmon resonance wavelength of 520 nm against a reference wavelength of 850 nm at which Au nanoparticles do not absorb. Automatic fraction collection was triggered by monitoring these wavelengths. The nanoparticle concentration was then determined by UV–vis absorption spectroscopy. Purified monomeric aptamer-Au nanoparticles were stored at 4 °C until use.
Avidin-Au Nanoparticle Preparation
First, 50 μL of stock solution of Au nanoparticles and 10 μL of 25:1 HS-C11-EG6-OCH2-COOH (HS-PEG-COOH, Prochimia)/HS-C11-(EG)6 Biotin (HS-PEG-Biotin, Prochimia) was mixed and reacted for 2 h at room temperature. After 2 h, Au nanoparticles were separated from excess PEG using purification columns (NAP-5, GE Healthcare), added with 1 μL of 10 mg/mL avidin (A2666, Invitrogen), and reacted overnight at 4 °C. To remove excess avidin, avidin-Au nanoparticles were washed three times with 10 mM Tris, 30 mM NaCl pH 8.0 solution by centrifugation at 5000 rpm for 10 min. The nanoparticle concentration was determined by UV–vis absorption spectroscopy. Purified avidin-Au nanoparticles were stored in 10 mM Tris, 30 mM NaCl pH 8.0 solution at 4 °C until use.
Aptamer-Au Plasmon Ruler Assembly
Monomeric aptamer-Au nanoparticles were stochiometrically added to avidin-coated Au nanoparticles (1:1) and reacted overnight at room temperature. Gels were prepared with 0.7% agarose by weight in 0.5× tris-borate-EDTA buffer (TBE, Sigma). To obtain aptamer-Au plasmon rulers, the reacted solution was separated by gel electrophoresis for 45 min at 120 V in 0.5× TBE buffer to achieve distinct visible bands. Band corresponding to aptamer-Au plasmon rulers was extracted from the gel, enclosed in dialysis membranes (Spectra/Por 7, Spectrum Laboratories) and separated from the gel by electrophoresis for 20 min at 120 V in 0.5× TBE buffer. Purified aptamer-Au plasmon rulers were stored at 4 °C until use.
Single-Molecule Binding Characterization
Glass flow chamber was modified with 1 mg/mL BSA-biotin (Roche) and washed with 10 mM Tris, 30 mM NaCl pH 8.0 solution. Purified aptamer-Au plasmon ruler solution was then introduced and incubated overnight at 4 °C. The aptamer-Au plasmon ruler binds such that only the avidin-Au nanoparticle binds to the biotinylated surface while the aptamer-Au nanoparticle is free to move in solution. Then, Superblock (Pierce) was introduced and incubated for 30 min at 4 °C.
For single molecule binding experiments, 9 nM recombinant mouse matrix metalloproteinase (MMP3, Leinco) was introduced into the chamber. Scattering images and spectra were obtained on a transmission mode dark-field microscope (Eclipse Ti–S, Nikon) equipped with a dark-field condenser (NA 1.2–1.4), 40× air objective (NA 0.60), color camera (Qimaging), spectrometer (2300i, Acton) with a grating of 300 grooves per millimeter (500 nm blaze wavelength), and liquid nitrogen cooled CCD (Spec-10:100B, Princeton Instruments). A slit width of 2 μm was used to ensure a single plasmon ruler was in the region-of-interest. Illumination was provided using a 100 W halogen source. A 1 s exposure time was used acquire a spectrum of a single plasmon ruler. For reversibility experiments, the chamber was alternately flushed with buffer containing 9 and 0 nM recombinant MMP3 in 5 min intervals, and spectra were collected at one spectrum per minute.
Transmission Electron Microscopy Characterization
Transmission electron microscopy (LaB6 Tecnai G2 STWIN) was used to characterize interparticle distance in the absence and presence of MMP3. Calculated and observed distances by TEM analysis has been shown to be in good agreement when the particle size is 5–10 nm.40 Thus, 5 nm particles were used here to form plasmon rulers. Purified aptamer-Au plasmon ruler solution was mixed with 0 and 9 nM recombinant mouse matrix metalloproteinase (MMP3, Leinco) and then immobilized on TEM grids for imaging.
Cell Culture and shRNA-Mediated Knockdown
The nonmalignant SCp2 murine mammary epithelial cell line43 was maintained in DMEM/F12 supplemented with 5% fetal bovine serum (FBS, Hyclone), 5 μg/mL insulin (Sigma-Aldrich), and 50 μg/mL gentamycin (83–5072-IM, UCSF) as previously described. Cell medium was changed every other day. For shRNA-mediated knockdown, cells were transduced with lentivirus carrying shRNA construct targeting MMP3 (MISSION shRNA library, Sigma-Aldrich) and selected with 2 mg/mL puromycin as previously described.34
Single-Molecule Analysis of Secreted MMP3
Aptamer-Au plasmon rulers were immobilized with one nanoparticle bound to the glass surface of the chamber using biotin–avidin chemistry as described above. SCp2 mammary epithelial cells with MMP3 knock down (MMP3 negative) and control (MMP3 positive) were then cultured in the chambers overnight at 37 °C with 5% CO2 humidified air to achieve a seeding density of 25%. Aptamer-Au plasmon rulers, synthesized from the same synthesis batch, were used for both the MMP3 positive and MMP3 negative mammary epithelial cell culture experiments. Chambers were then washed with fresh media. Scattering images and spectra of aptamer-Au plasmon rulers in the local microenvironment of MMP3 negative cells and MMP3 positive cells were obtained using transmission mode dark-field microscopy.
Immunofluorescence
SCp2 mammary epithelial cells with MMP3 knock down and control were cultured for 72 h on glass coverslips, fixed with 4% paraformaldehyde (15710, EMS) in 1× PBS for 10 min, washed with 1× PBS, and permeabilized in 0.25% Triton X-100 (t8532, Sigma-Aldrich) in 1× PBS for 10 min. Cells were then blocked with 2% bovine serum albumin (A7888, Sigma-Aldrich) for 1 h, followed by incubation with a goat polyclonal antibody targeting MMP3 (ab18898, Abcam) in blocking buffer overnight at 4 °C and donkey α-goat secondary antibody (A11058, Life Technologies) for 1 h at room temperature. DNA DAPI (D9542, Sigma-Aldrich) was used to stain cell nuclei. Fluorescence images were acquired with an upright confocal microscope (LSM710, Zeiss) using a 1.4 NA 63× oil immersion.
Electromagnetic Simulation
Simulations were performed using Lumerical FDTD solutions, version 8.7.4. The gold nanoparticles were modeled using refractive index data from Johnson and Christy44 in a surrounding medium of water. Peak positions of the calculated spectra were extracted by fitting the spectral data to a Lorentzian line shape.
Supplementary Material
Acknowledgments
The authors thank Dr. Mark Morris and Dr. Bill Jackson at Base Pair Biotechnologies for useful discussion on aptamers. S.E.L was supported by the National Institute of Health (F32 EB013972) and the National Science Foundation (ECCS-1454188). Q.C. was supported by Miller postdoctoral fellowship from the Miller Institute for Basic Research in Science at UC Berkeley. R.B. was supported by a Susan G. Komen for the Cure postdoctoral fellowship (KG111229). The work from the laboratory of A.P.A. was supported by a grant from King Abdulaziz City for Science and Technology (KACST), Kingdom of Saudi Arabia. The laboratory of M.J.B. was supported by funds from the NCI awards CA064786 and CA143836 (Bay Area Physical Sciences Oncology Center); the Department of Defense Breast Cancer Research Program (award W81XWH0810736); the Department of Energy, Office of Biological and Environmental Research (contract no. DE-AC02-05CH1123); and from the Breast Cancer Research Foundation.
Footnotes
Supporting Information: Additional figures and discussion on detection limit of plasmon rulers, reversibility of plasmon rulers, kinetics of the binding reaction, and estimation of the protein concentration. The Supporting Information is available free of charge on the ACS Publications website at DOI: 10.1021/acs.nanolett.5b01161.
Notes: The authors declare no competing financial interest.
References
- 1.Lu P, Werb Z. Patterning Mechanisms of Branched Organs. Science. 2008;322:1506–1509. doi: 10.1126/science.1162783. [DOI] [PMC free article] [PubMed] [Google Scholar]
- 2.Lubarsky B, Krasnow MA. Tube Morphogenesis: Making and Shaping Biological Tubes. Cell. 2003;112:19–28. doi: 10.1016/s0092-8674(02)01283-7. [DOI] [PubMed] [Google Scholar]
- 3.Patel VN, Rebustini IT, Hoffman MP. Salivary Gland Branching Morphogenesis. Differentiation. 2006;74:349–364. doi: 10.1111/j.1432-0436.2006.00088.x. [DOI] [PubMed] [Google Scholar]
- 4.Simian M, Hirai Y, Navre M, Werb Z, Lochter A, Bissell MJ. The Interplay of Matrix Metalloproteinases, Morphogens, and Growth Factors is Necessary for Branching of Mammary Epithelial Cells. Development. 2001;128:3117–3131. doi: 10.1242/dev.128.16.3117. [DOI] [PMC free article] [PubMed] [Google Scholar]
- 5.Yamada KM, Cukierman E. Modeling Tissue Morphogenesis and Cancer in 3D. Cell. 2007;130:601–610. doi: 10.1016/j.cell.2007.08.006. [DOI] [PubMed] [Google Scholar]
- 6.Lee SE, Alivisatos AP, Bissell MJ. Toward plasmonics-enabled spatiotemporal activity patterns in three-dimensional culture models. Syst Biomed. 2013;1:1–9. doi: 10.4161/sysb.22834. [DOI] [PMC free article] [PubMed] [Google Scholar]
- 7.Beliveau A, Mott JD, Lo A, Chen EI, Koller AA, Yaswen P, Muschler J, Bissell MJ. Raf-induced MMP9 Disrupts Tissue Architecture of Human Breast Cells in 3-D Culture And Is Necessary for Tumor Growth In Vivo. Genes Dev. 2010;24:2800–2811. doi: 10.1101/gad.1990410. [DOI] [PMC free article] [PubMed] [Google Scholar]
- 8.Nelson CM, Bissell MJ. Of Extracellular Matrix, Scaffolds, and Signaling: Tissue Architecture Regulates Development, Homeo-stasis, and Cancer. Annu Rev Cell Dev Biol. 2006;22:287–309. doi: 10.1146/annurev.cellbio.22.010305.104315. [DOI] [PMC free article] [PubMed] [Google Scholar]
- 9.Egeblad M, Werb Z. New Functions for the Matrix Metalloproteinases in Cancer Progression. Nat Rev Cancer. 2002;2:161–174. doi: 10.1038/nrc745. [DOI] [PubMed] [Google Scholar]
- 10.Love JC, Ronan JL, Grotenbreg GM, van der Veen AG, Ploegh HL. A Microengraving Method for Rapid Selection of Single Cells Producing Antigen-specific Antibodies. Nat Biotechnol. 2006;24:703–707. doi: 10.1038/nbt1210. [DOI] [PubMed] [Google Scholar]
- 11.Shirasaki Y, Yamagishi M, Suzuki N, Izawa K, Nakahara A, Mizuno J, Shoji S, Heike T, Harada Y, Nishikomori R, Ohara O. Real-time Single-cell Imaging of Protein Secretion. Sci Rep. 2014;4:1–8. doi: 10.1038/srep04736. [DOI] [PMC free article] [PubMed] [Google Scholar]
- 12.Raphael MP, Christodoulides JA, Delehanty JB, Long JP, Byers JM. Quantitative Imaging of Protein Secretions from Single Cells in Real Time. Biophys J. 2013;105:602–608. doi: 10.1016/j.bpj.2013.06.022. [DOI] [PMC free article] [PubMed] [Google Scholar]
- 13.Zhu H, Stybayeva G, Silangcruz J, Yan J, Ramanculov E, Dandekar S, George MD, Revzin A. Detecting Cytokine Release from Single T-cells. Anal Chem. 2009;81:8150–8156. doi: 10.1021/ac901390j. [DOI] [PMC free article] [PubMed] [Google Scholar]
- 14.Sonnichsen C, Reinhard BM, Liphardt J, Alivisatos P. A Molecular Ruler Based on Plasmon Coupling of Single Gold and Silver Nanoparticles. Nat Biotechnol. 2005;23:741–745. doi: 10.1038/nbt1100. [DOI] [PubMed] [Google Scholar]
- 15.Chen JIL, Chen Y, Ginger DS. Plasmonic Nanoparticle Dimers for Optical Sensing of DNA in Complex Media. J Am Chem Soc. 2010;132:9600–9601. doi: 10.1021/ja103240g. [DOI] [PubMed] [Google Scholar]
- 16.Chen JIL, Durkee H, Traxler B, Ginger DS. Optical Detection of Protein in Complex Media with Plasmonic Nanoparticle Dimers. Small. 2011;7:1993–1997. doi: 10.1002/smll.201100617. [DOI] [PubMed] [Google Scholar]
- 17.Huang T, Nallathamby PD, Xu XHN. Photostable Single-Molecule Nanoparticle Optical Biosensors for Real-Time Sensing of Single Cytokine Molecules and Their Binding Reactions. J Am Chem Soc. 2008;130:17095–17105. doi: 10.1021/ja8068853. [DOI] [PMC free article] [PubMed] [Google Scholar]
- 18.Jun Y, Sheikholeslami S, Hostetter DR, Tajon C, Craik CS, Alivisatos AP. Continuous Imaging of Plasmon Rulers in Live Cells Reveals Early-Stage Caspace-3 Activation at the Single-Molecule Level. Proc Natl Acad Sci U S A. 2009;106:17735–17740. doi: 10.1073/pnas.0907367106. [DOI] [PMC free article] [PubMed] [Google Scholar]
- 19.Lee K, Cui Y, Lee LP, Irudayaraj J. Quantitative Imaging of Single mRNA Splice Variants in Living Cells. Nat Nanotechnol. 2014;9:474–480. doi: 10.1038/nnano.2014.73. [DOI] [PMC free article] [PubMed] [Google Scholar]
- 20.Reinhard BM, Siu M, Agarwal H, Alivisatos AP, Liphardt J. Calibration of Dynamic Molecular Rulers Based on Plasmon Coupling Between Gold Nanoparticles. Nano Lett. 2005;5:2246–2252. doi: 10.1021/nl051592s. [DOI] [PubMed] [Google Scholar]
- 21.Reinhard BM, Sheikholeslami S, Mastroianni A, Alivisatos AP, Liphardt J. Use of Plasmon Coupling to Reveal the Dynamics of DNA Bending and Cleavage by Single EcoRV Restriction Enzymes. Proc Natl Acad Sci U S A. 2007;104:2667–2672. doi: 10.1073/pnas.0607826104. [DOI] [PMC free article] [PubMed] [Google Scholar]
- 22.Rong G, Wang H, Skewis LR, Reinhard BM. Resolving Sub-diffraction Limit Encounters in Nanoparticle Tracking Using Live Cell Plasmon Coupling Microscopy. Nano Lett. 2008;8:3386–3393. doi: 10.1021/nl802058q. [DOI] [PMC free article] [PubMed] [Google Scholar]
- 23.Rong G, Wang H, Reinhard BM. Insights from a Nanoparticle Minuet: Two-Dimensional Membrane Profiling through Silver Plasmon Ruler Tracking. Nano Lett. 2010;10:230–238. doi: 10.1021/nl903350f. [DOI] [PMC free article] [PubMed] [Google Scholar]
- 24.Tajon CA, Seo D, Asmussen J, Shah N, Jun Y, Craik CS. Sensitive and Selective Plasmon Ruler Nanosensors for Monitoring the Apoptotic Drug Response in Leukemia. ACS Nano. 2014;8(9):9199–9208. doi: 10.1021/nn502959q. [DOI] [PMC free article] [PubMed] [Google Scholar]
- 25.Guo L, Ferhan AR, Chen H, Li C, Chen G, Hong S, Kim D. Distance-mediated Plasmonic Dimers for Reusable Colometric Switches: A Measurable Peak Shift of More than 60 nm. Small. 2012;9:234–240. doi: 10.1002/smll.201201061. [DOI] [PubMed] [Google Scholar]
- 26.Leunissen ME, Dreyfus R, Cheong F, Grier DG, Sha R, Seeman N, Chaikin PM. Switchable Self-Protected Attractions in DNA-functionalized Colloids. Nat Mater. 2009;8:590–595. doi: 10.1038/nmat2471. [DOI] [PubMed] [Google Scholar]
- 27.Maye MM, Kumara MT, Nykypanchuck D, Sherman WB, Gang O. Switching Binary States of Nanoparticle Superlattices and Dimer Clusters by DNA Strands. Nat Nanotechnol. 2009;5:116–120. doi: 10.1038/nnano.2009.378. [DOI] [PubMed] [Google Scholar]
- 28.Sebba DS, Mock JJ, Smith DR, LaBean TH, Lazarides AA. Reconfigurable Core-Satellite Nanoassemblies as Molecularly-Driven Plasmonic Switches. Nano Lett. 2008;8:1803–1808. doi: 10.1021/nl080029h. [DOI] [PubMed] [Google Scholar]
- 29.Sternlicht M, Lochter A, Sympson CJ, Huey B, Rougier J, Gray JW, Pinkel D, Bissell MJ, Werb Z. The Stromal Proteinase MMP3/Stromelysin-1 Promotes Mammary Carcinogenesis. Cell. 1999;98:137–146. doi: 10.1016/s0092-8674(00)81009-0. [DOI] [PMC free article] [PubMed] [Google Scholar]
- 30.Sympson CJ, Talhouk RS, Alexander CM, Chin JR, Clift SM, Bissell MJ, Werb Z. Targeted Expression of Stromelysin-1 in Mammary Gland Provides Evidence for a Role of Proteinases in Branching Morphogenesis and the Requirement for an Intact Basement Membrane for Tissue-specific Gene Expression. J Cell Biol. 1994;125:681–693. doi: 10.1083/jcb.125.3.681. [DOI] [PMC free article] [PubMed] [Google Scholar]
- 31.Talhouk RS, Chin JR, Unemori EN, Werb Z, Bissell MJ. Proteinases of the Mammary Gland: Developmental Regulation In vivo and Vectorial Secretion in Culture. Development. 1991;112:439–441. doi: 10.1242/dev.112.2.439. [DOI] [PMC free article] [PubMed] [Google Scholar]
- 32.Lochter A, Sternlicht MD, Werb Z, Bissell MJ. The Significance of Matrix Metalloproteinases during Early Stages of Tumor Progression. Ann N Y Acad Sci. 1998;857:180–193. doi: 10.1111/j.1749-6632.1998.tb10116.x. [DOI] [PubMed] [Google Scholar]
- 33.Radisky DC, Levy DD, Littlepage LE, Liu H, Nelson CM, Fata JE, Leake D, Godden EL, Albertson DG, Nieto MA, Werb Z, Bissell MJ. Rac1b and Reactive Oxygen Species Mediate MMP-3-induced EMT and Genomic Instability. Nature. 2005;436:123–127. doi: 10.1038/nature03688. [DOI] [PMC free article] [PubMed] [Google Scholar]
- 34.Correia A, Mori H, Chen EI, Schmitt FC, Bissell MJ. The Hemopexin Domain of MMP3 is Responsible for Mammary Epithelial Invasion and Morphogenesis through Extracellular Interaction with HSP90β. Genes Dev. 2013;27:805–817. doi: 10.1101/gad.211383.112. [DOI] [PMC free article] [PubMed] [Google Scholar]
- 35.Kessenbrock K, Dijkgraaf GJP, Lawson DA, Littlepage LE, Shahi P, Pieper U, Werb Z. A Role for Matrix Metal-loproteinases in Regulating Mammary Stem Cell Function via the Wnt Signaling Pathway. Cell Stem Cell. 2013;13:300–313. doi: 10.1016/j.stem.2013.06.005. [DOI] [PMC free article] [PubMed] [Google Scholar]
- 36.Liu J, Lu Y. Preparation of Aptamer-linked Gold Nanoparticle Purple Aggregates for Colorimetric Sensing of Analytes. Nat Protoc. 2006;1:246–252. doi: 10.1038/nprot.2006.38. [DOI] [PubMed] [Google Scholar]
- 37.Medley CD, Smith JE, Tang Z, Wu Y, Bamrungsap S, Tan W. Gold Nanoparticle-Based Colorimetric Assay for the Direct Detection of Cancerous Cells. Anal Chem. 2008;80:1067–1072. doi: 10.1021/ac702037y. [DOI] [PubMed] [Google Scholar]
- 38.Zhao W, Chiuman W, Lam JCF, McManus SA, Chen W, Cui Y, Pelton R, Brook MA, Li Y. DNA Aptamer Folding on Gold Nanoparticles: From Colloid Chemistry to Biosensors. J Am Chem Soc. 2008;130:3610–3618. doi: 10.1021/ja710241b. [DOI] [PubMed] [Google Scholar]
- 39.Jain PK, Huang W, El-Sayed MA. On the Universal Scaling Behavior of the Distance Decay of Plasmon Coupling in Metal Nanoparticle Pairs: A Plasmon Ruler Equation. Nano Lett. 2007;7:2080–2088. [Google Scholar]
- 40.Micheel CM, Zanchet D, Alivisatos AP. Correlation Analysis of TEM Images of Nanocrystal Molecules. Langmuir. 2008;24:10084–10088. doi: 10.1021/la801101k. [DOI] [PubMed] [Google Scholar]
- 41.Terp G, Cruciani G, Christensen IT, Jorgensen FS. Structural Differences of Matrix Metalloproteinases with Potential Implications for Inhibitor Selectivity Examined by the GRID/CPCA Approach. J Med Chem. 2001;45:2675–2684. doi: 10.1021/jm0109053. [DOI] [PubMed] [Google Scholar]
- 42.Claridge S, Liang HW, Basu SR, Frechet JM, Alivisatos AP. Isolation of Discrete Nanoparticle-DNA Conjugates for Plasmonic Applications. Nano Lett. 2008;8:1202–1206. doi: 10.1021/nl0802032. [DOI] [PubMed] [Google Scholar]
- 43.Desprez P, Roskelley C, Campisi J, Bissell MJ. Isolation of Functional Cell lines from a Mouse Mammary Epithelial Cell Strain: The Importance of Basement Membrane and Cell-cell Interaction. Mol Cell Differ. 1993;1:99–110. [Google Scholar]
- 44.Johnson PB, Christy RW. Optical Constants of the Noble Metals. Phys Rev. 1972;6:4370. [Google Scholar]
Associated Data
This section collects any data citations, data availability statements, or supplementary materials included in this article.