

Abstract
The association of genetic lesions detected by FISH with survival was analyzed in 1069 patients with newly presenting myeloma treated in the Medical Research Council (MRC) Myeloma IX trial, with the aim of identifying patients associated with the worst prognosis. A comprehensive FISH panel was performed, and the lesions associated with short PFS and OS in multivariate analysis were +1q21, del(17p13) and an adverse IGH translocation group incorporating t(4;14), t(14;16) and t(14;20). These lesions frequently co-segregated, and there was an association between the accumulation of these adverse FISH lesions and a progressive impairment of survival. This observation was used to define a series of risk groups based on number of adverse lesions. Taking this approach we defined a favorable risk group by the absence of adverse genetic lesions, an intermediate group with 1 adverse lesion and a high risk group defined by the co-segregation of >1 adverse lesion. This genetic grouping was independent of the ISS and so was integrated with the ISS to identify an ultra-high risk group defined by ISS II or III and >1 adverse lesion. This group constituted 13.8 % of patients and was associated with a median OS of 19.4 months.
Introduction
The natural history of myeloma is highly variable. Following induction chemotherapy some patients will remain in a durable remission for many years, and with increasingly effective salvage therapies long term survival is a realistic prospect for these patients. At the other end of the clinical spectrum there is a subset of patients with a disease course characterized by rapid relapse and early progression to a refractory disease state. These patients have ultra-high risk myeloma, and patient groups with a median overall survival (OS) of less than 24 months can be considered to have a sufficiently poor prognosis to fall into this group. Identifying these patients at diagnosis is important as they are likely to have a poor outcome with standard therapeutic approaches, and it would be appropriate to target this group with alternative treatment strategies within the context of clinical trials. However, in order to carry out this approach, robust prognostic factors are needed.
It is recognised that prognosis in myeloma is related to both patient factors and tumor variables. The most widely applied prognostic system in myeloma is the International Staging System (ISS), which stratifies patients into three groups based on serum albumin and β2-microglobulin levels (1). These two variables reflect both patient and tumor factors, with β2-microglobulin being a measure of tumor bulk and renal function whilst albumin is associated with the general state of the patient. This system is well validated and easily applied, but it fails to identify individual patient risk in a robust enough fashion to justify a change in therapeutic approach. Attempts have therefore been made to improve on this system by identifying tumor genetic variables associated with short survival. Different technologies have been utilized to identify genetic variables associated with outcome, with one approach being gene expression profiling. The UAMS (University of Arkansas for Medical Sciences) group was the first to link gene expression to adverse survival in myeloma, with a gene expression signature that was enriched with over-expressed genes on 1q and under-expressed genes on 1p, and since then other groups have identified alternative gene expression signatures linked to short survival (2-4).
An alternative strategy is the use of fluorescence in situ hybridisation (FISH) to interrogate specific genetic lesions, and several lesions have been linked to impaired survival using this method. t(4;14) leads to the deregulation of MMSET and FGFR3 and has been associated with adverse prognosis in a variety of clinical settings including high dose therapy with stem cell support (5-11). There is emerging data which suggests that the outcome of this group may be improved by treatment with bortezomib (12-14). t(14;16) is a rare translocation, resulting in up-regulation of MAF that has also been linked with adverse clinical outcome, although its prognostic significance has recently been questioned (6, 15-16). Del(17p13) is considered to be an important prognostic marker which has been associated with a negative effect on survival in a number of different treatment contexts (6, 10, 17-19). Del(13q14) is found in ~50% of myeloma tumors and until recently was thought to be associated with short survival (20-22). However, the relationship of del(13q14) and adverse prognosis is now thought to be secondary to the close association of del(13q14) with other high risk genetic lesions such as t(4;14) (23-24). Over-expression of genes on 1q is central to the high risk gene expression signature generated by the UAMS group, and gain of 1q21 detected by FISH has been linked to adverse prognosis in a patient series treated with tandem transplantation (2, 25). However, its value as an independent FISH biomarker of adverse prognosis has not been validated by other groups (26). The International Myeloma Working Group (IMWG) recently evaluated these data and concluded that there was currently only evidence for testing for t(4;14), t(14;16) and del(17p13) when stratifying patients into genetic risk groups(27). In order to fully understand the impact of these lesions on clinical outcome we have performed a comprehensive FISH panel on patients entering the phase III clinical trial MRC Myeloma IX, and have studied the association of these FISH lesions with survival and existing prognostic factors with the aim of defining a group of patients with ultra-high risk disease.
Materials and Methods
Patients and Treatment
1960 patients with newly diagnosed myeloma requiring treatment were enrolled in the MRC Myeloma IX trial (ISRCTN68454111), the design and results of which have been reported elsewhere (28). In summary, the trial comprised an intensive and non-intensive pathway based on patient eligibility for autologous transplantation, which was decided after informed discussion between patient and treating physician, taking into account patient performance status, co-morbidities and age. Patients in the intensive pathway underwent an initial randomisation to CVAD (cyclophosphamide, vincristine, doxorubicin and dexamethasone) or CTD (cyclophosphamide, thalidomide and dexamethasone), followed by high dose melphalan with autologous stem cell rescue. In the non-intensive pathway patients were randomised to either MP (melphalan and prednisolone) or CTDa (attenuated cyclophosphamide, thalidomide and dexamethasone) to maximum response. Both pathways incorporated a maintenance randomisation to thalidomide versus no maintenance. Primary end-points included progression free survival (PFS) and overall survival (OS). Survival data were available from 1960 patients, 1111 from the intensive pathway and 849 from the non-intensive. 556 patients received CVAD, 555 CTD, 423 MP and 426 CTDa. Median follow up is 3.7 years.
FISH
1180 patients provided a bone marrow sample for FISH analysis, of which 1140 were suitable for testing. Diagnostic bone marrow samples were initially purified for plasma cells using CD138 magnetic microbeads (Miltenyi Biotec, Bisley, UK). FISH was performed on the purified plasma cells to detect the presence of an IGH translocation, the common IGH translocation partners (FGFR3 at 4p16, CCND3 at 6p21, CCND1 at 11q13, MAF at 16q23 and MAFB at 20q12), hyperdiploid status using the iFISH ploidy classification, deletion of 1p32, 13q14, 16q23, 17p13, 22q11 and gain of 1q21 as previously described(23). The FISH failure rate was 6% of analyzable bone marrow specimens, providing results for 1069 patients. A subset of 869 cases had a complete data set of adverse immunoglobulin heavy chain gene (IGH) translocations, +1q21 and del(17p13).
Statistical Analysis
Statistical analysis was performed using SPSS version 18.0 (SPSS Inc., Chicago, USA) and R. Survival curves were plotted using the Kaplan-Meier method. Differences between curves were tested for statistical significance using the log-rank test, with p<0.05 taken as the level of significance. Variables associated with survival in univariate analysis at the p<0.05 level were entered into the model for multivariate testing. Multivariate analysis of variables associated with survival used a backwards elimination Cox proportional hazards model, with factors retained if they were significant at p<0.05.
Results
In univariate analysis the FISH lesions associated with adverse PFS were t(4;14), t(14;16), +1q21, del(13q14) and del(17p13)(table 1). Lesions associated with adverse OS were t(4;14), t(14;16), t(14;20), +1q21, del(13q14) and del(17p13)(table 1). t(14;16) and t(14;20) are rare translocations, and behaved in a similar fashion to t(4;14), so consequently were grouped together to form an adverse IGH translocation group. These FISH groups (the adverse IGH group, del(13q14), del(17p13) and +1q21) were entered into a multivariate analysis together with the ISS. The genetic groups associated with impaired PFS and OS in this multivariate testing were the adverse IGH translocation group, del(17p13) and +1q21 (table 2). These groups had a clear association with short survival with the median OS for each group being 25.9 months, 26.7 months and 31.0 months respectively, and they were further examined in order to refine their association with adverse prognosis.
Table 1.
Median PFS and OS associated with each FISH lesion, compared to samples without the lesion.
| FISH Lesion | PFS | OS | ||||
|---|---|---|---|---|---|---|
| Lesion Present | Lesion Absent | p= | Lesion Present | Lesion Absent | p= | |
| Median PFS (months) | Median PFS (months) | Median OS (months) | Median OS (months) | |||
| Hyperdiploidy | 18.9 | 17.8 | 0.110 | 49.7 | 43.7 | 0.150 |
| t(4;14) | 13.1 | 19.3 | <0.001 | 27.7 | 50.9 | <0.001 |
| t(6;14) | 27.2 | 18.2 | 0.361 | not reached | 47.7 | 0.426 |
| t(11;14) | 21.3 | 17.5 | 0.292 | 51.6 | 46.9 | 0.209 |
| t(14;16) | 13.6 | 18.6 | 0.028 | 32.9 | 48.3 | 0.025 |
| t(14;20) | 10.2 | 18.5 | 0.152 | 16.9 | 48.3 | <0.001 |
| del(1p) | 19.0 | 18.7 | 0.701 | 36.4 | 47.7 | 0.216 |
| +1q | 13.8 | 22.1 | <0.001 | 31.0 | 54.8 | <0.001 |
| del(13q) | 16.3 | 20.1 | 0.002 | 40.9 | 52.1 | 0.005 |
| del(16q) | 19.9 | 18.2 | 0.200 | 43.7 | 48.3 | 0.462 |
| del(17p) | 14.7 | 18.3 | 0.002 | 26.7 | 48.5 | <0.001 |
| del(22q) | 18.7 | 18.0 | 0.265 | 53.2 | 45.8 | 0.653 |
Table 2.
Variables significantly associated with survival in multivariate analysis.
| Variable | PFS | OS | ||||
|---|---|---|---|---|---|---|
| Hazard Ratio | 95% CI | p= | Hazard Ratio | 95% CI | p= | |
| Adverse IGH Translocation | 1.65 | 1.31 - 2.07 | <0.001 | 1.54 | 1.16 - 2.03 | 0.003 |
| +1q21 | 1.46 | 1.21 - 1.76 | <0.001 | 1.53 | 1.20 - 1.94 | 0.001 |
| del(17p13) | 1.41 | 1.05 - 1.90 | 0.022 | 1.53 | 1.06 - 2.19 | 0.02 |
| ISS (I vs II) | 1.36 | 1.07 - 1.74 | 0.012 | 1.79 | 1.24 - 2.58 | 0.002 |
| ISS (I vs III) | 1.55 | 1.21 - 1.97 | <0.001 | 2.69 | 1.89 - 3.84 | <0.001 |
Inter-relationships of Adverse FISH Groups
The number of patients in each of the adverse FISH groups, and their inter-relationships, was assessed (figure 1). Of the cases analyzed by FISH, 11.4% had t(4;14), 3.2% had t(14;16) and 1.6% had t(14;20), creating a combined ‘adverse IGH’ group (n=145) comprising 16.2% of the total. +1q21 was present in 38.9% of patients and del(17p13) was detected in 8.4% of patients. There was a strong positive association between adverse IGH translocations and +1q21, with 72% of the adverse IGH group also carrying +1q21 compared to 32.4% of cases outside this group (p<0.001). del(17p13) was found in 18/145 (12.4%) of adverse IGH cases, which is similar to its background rate in the overall dataset. However, in 16/18 (89%) of these cases del(17p13) co-segregated with both the adverse IGH translocation and +1q21.
Figure 1.

Venn diagram of the relationship of each of the adverse FISH groups (adverse IGH translocations, +1q21 and del(17p13)).
Prognostic Impact of Adverse Lesions in Isolation
The association of each of these lesions with survival was assessed in patients where the lesion occurred in isolation. Adverse IGH translocations, +1q21 and del(17p13) were all found to have a similar negative impact on PFS and OS as individual lesions, compared to samples lacking any of these lesions (figure 2). Interestingly, the prognostic impact of these lesions when they occurred in isolation was moderate, with a median OS of 44.2 months (adverse IGH), 41.9 months (+1q21) and 38.0 months (del(17p13)) compared to 60.6 months for patients without any adverse lesions.
Figure 2.
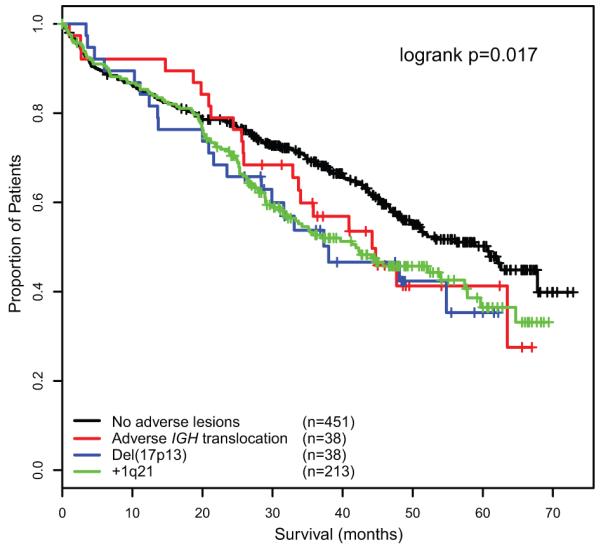
OS of each of the adverse FISH lesions when they occur in isolation compared to samples lacking any adverse lesions.
Prognostic Impact of Adverse Lesions in Combination
The association of number of adverse lesions with survival was assessed, and a clear progressive association between the accumulation of adverse FISH lesions and impairment of survival was demonstrated (figure 3). In this model, patients with two adverse lesions were associated with a median OS of 23.4 months, whilst the triple combination of an adverse IGH translocation, +1q21 and del(17p13) was associated with the worst survival (median OS 9.1 months).
Figure 3.
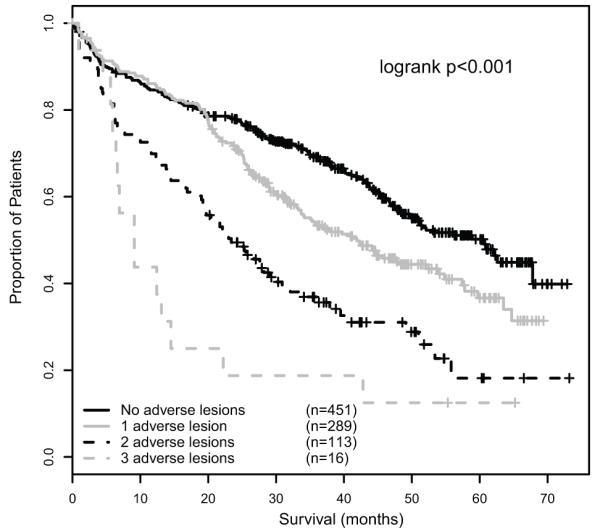
OS graded by number of adverse lesions, showing the progressive impact of accumulation of adverse lesions.
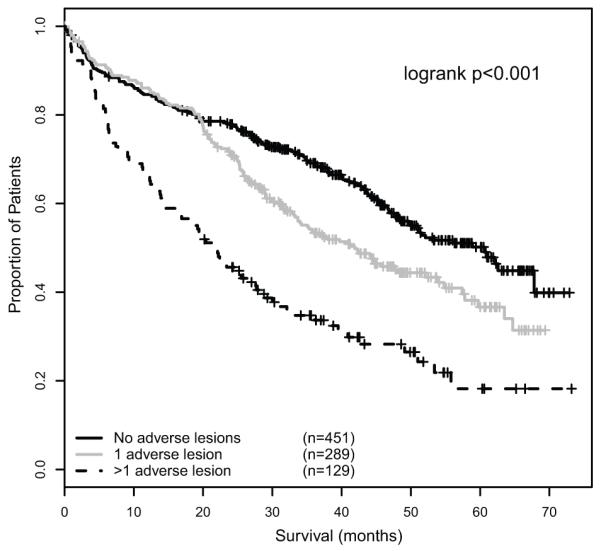
This progressive association of number of adverse lesions and impairment of survival can be used to group myeloma patients into a series of risk groups. Taking this approach we defined a low risk group defined by the absence of adverse genetic lesions (median OS 60.6 months, median PFS 23.5 months), an intermediate group with 1 adverse lesion (median OS 41.9 months, median PFS 17.8 months) and a high risk group defined by the co-segregation of >1 adverse lesion (median OS 21.7 months, median PFS 11.7 months)(figure 4). In subgroup analyses, this prognostic grouping remained significantly associated with PFS and OS in patients treated intensively or non-intensively, in patients treated with thalidomide-based or conventional induction therapy, and in patients receiving thalidomide maintenance or no maintenance (supplementary data).
Figure 4.
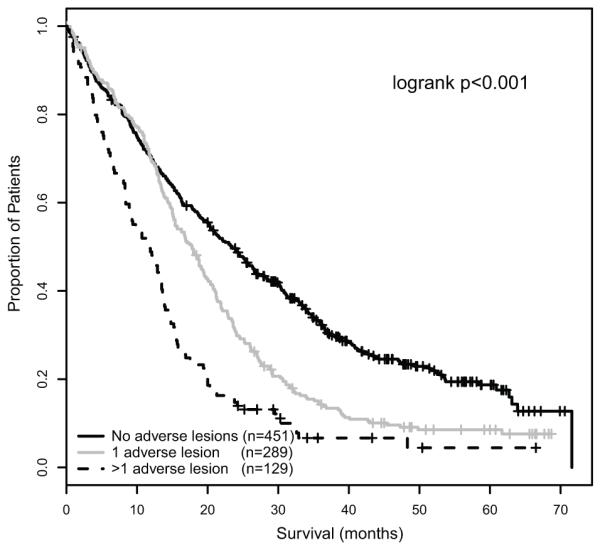
A – PFS of genetic risk groups defined by the presence of 0, 1 and >1 adverse FISH lesions respectively.
B – OS of genetic risk groups defined by the presence of 0, 1 and >1 adverse FISH lesions respectively.
The Integration of Biological Groupings and the ISS
The ISS stage was significantly associated with survival in the same data set, with a median OS that was not reached for ISS I, 47.7 months for ISS II and 35.7 months for ISS III. The genetic groups defined by number of adverse lesions and the ISS were independently associated with PFS and OS in multivariate analysis (table 3). The genetic risk groups significantly stratified OS within the ISS II and III groups (p<0.001), and conversely the ISS stratified outcome within the groups characterised by 0 and >1 adverse lesions (p<0.001 and p=0.006 respectively). Integrating the genetic risk groups with the ISS, therefore, has the potential to further refine the definition of risk for individual patients. When the two systems were combined, three distinct risk groups were evident based on the median OS associated with each group (table 4). In this way we were able to identify a favourable risk group, defined as patients with ISS I or II and no adverse genetic lesions or ISS I and 1 adverse lesion (median OS 67.8 months). At the opposite end of the clinical spectrum, ultra-high risk disease was defined by ISS II or III in the presence of >1 adverse lesion. This group constituted 13.8% of patients, and was associated with a median PFS of only 9.9 months and a median OS of 19.4 months. An intermediate risk group consisted of patients with ISS I and >1 adverse lesion, ISS II and 1 adverse lesion and ISS III with 0-1 adverse lesions, and this group was associated with a median OS of 41.3 months(figure 5). These groups were significantly associated with survival in subgroup analyses of patients treated with or without autologous transplantation, and in patients treated with or without thalidomide maintenance (supplementary data).
Table 3.
Multivariate analysis of the ISS and the genetic groups defined by number of adverse lesions
| Variable | PFS | OS | ||||
|---|---|---|---|---|---|---|
| HR | 95% CI | p | HR | 95% CI | p | |
| Number of adverse lesions (0 vs 1) | 1.48 | 1.21 - 1.80 | <0.001 | 1.30 | 1.00 - 1.69 | 0.048 |
| Number of adverse lesions (0 vs >1) | 2.42 | 1.89 - 3.09 | <0.001 | 2.59 | 1.93 - 3.47 | <0.001 |
| ISS (I vs II) | 1.34 | 1.05 - 1.70 | 0.019 | 1.79 | 1.24 - 2.57 | 0.002 |
| ISS (I vs III) | 1.53 | 1.20 - 1.96 | 0.001 | 2.72 | 1.91 - 3.89 | <0.001 |
Table 4.
The median OS associated with patient groups defined by the combination of ISS stage and number of adverse lesions. These values were used to define favourable, intermediate and ultra-high risk patients groups.
| Group | Median OS | Combined FISH_ISS Risk Group | Median OS | HR for OS (95% CI) |
|---|---|---|---|---|
| ISS I and no adverse lesions | Not reached | Favorable Risk | 67.8 | - |
| ISS I and 1 adverse lesion | Not reached | |||
| ISS II and no adverse lesion | 62.6 | |||
| ISS I and >1 adverse lesion | 42.8 | Intermediate Risk | 41.3 | 2.03 (1.55 - 2.66) |
| ISS II and 1 adverse lesion | 42.3 | |||
| ISS III and no adverse lesion | 42.9 | |||
| ISS III and 1 adverse lesion | 35.3 | |||
| ISS II and >1 adverse lesion | 25.5 | Ultra-High Risk | 19.4 | 4.16 (2.98 - 5.83) |
| ISS III and >1 adverse lesion | 14.4 |
Figure 5.
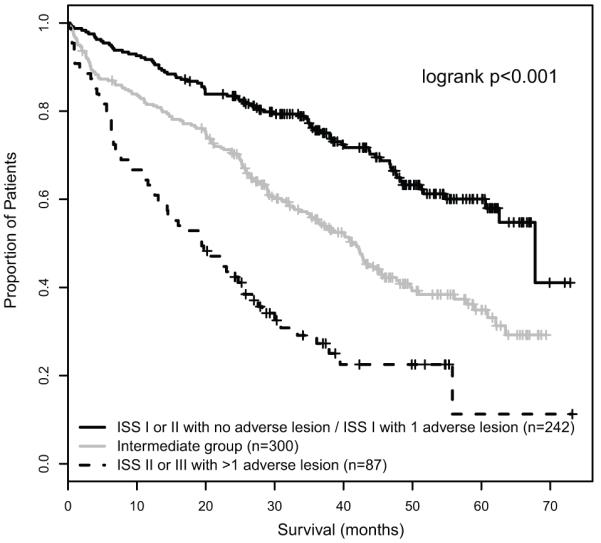
Integration of the ISS and FISH groups to identify an ultra-high risk group, defined by ISS II or III with >1 adverse lesion.
Discussion
We show that in the context of a large clinical trial of presenting myeloma patients incorporating both conventional and thalidomide-based therapies, the genetic lesions associated with adverse survival after multivariate analysis were del(17p13), +1q21 and an ‘adverse IGH translocation group’ comprising t(4;14), t(14;16) and t(14;20). The poor prognosis associated with the presence of t(4;14), t(14;16) and del(17p13) in our data set is consistent with the findings of the IMWG review, which recommended testing for these lesions by FISH. However, the significance of t(14;16) has recently been questioned. The original data linking t(14;16) with short survival was based on the analysis of 15 patients with this abnormality by the Mayo clinic(6), and these data were strengthened by the association of over-expression of MAF with impaired prognosis by the UAMS group(29). However, this association of t(14;16) with adverse survival was not corroborated in an analysis of 30 patients with this abnormality by the IFM group(16). We analyzed the outcome of 33 patients with t(14;16), and found it to be positively associated with +1q21, which co-segregated with t(14;16) in 66.7% of cases. Cases with co-segregation of t(14;16) and +1q21 were associated with a median OS of 12.6 months, compared to 47.7 months when t(14;16) occurred in isolation. This provides evidence that co-segregating adverse FISH lesions, especially +1q21, can modulate the prognostic impact of t(14;16). As the numbers of patients with this rare translocation analyzed by us and the IFM group are low, it is possible that the rate of +1q21 may differ in the two groups, which could be crucial to the survival analysis of these small patient series. Alternatively, the differing therapeutic approaches employed in the two data sets may explain the result, with the IFM patients receiving a tandem-autologous transplantation approach. Further studies analyzing t(14;16) in conjunction with +1q21 and del(17p) are warranted to confirm or refute these findings. However, t(14;16) was present in 12.6% of the ultra-high risk group defined by the combination of genetic lesions and FISH, so although it is a rare lesion in the overall myeloma population it is an integral part of the definition of high risk disease in our data set.
In addition to the FISH lesions previously identified as important by the IMWG review, we clearly show that it is important to test for +1q21 and t(14;20). +1q21 is common in presenting myeloma, especially in the presence of an IGH translocation, and its association with adverse prognosis reflects the importance of over-expression of genes on 1q in some high risk gene expression signatures(2). In comparison, t(14;20) is a rare lesion, being found in 1.6% of our cases, but it had a clear association with short survival and constituted 8% of the ultra-high risk group, so it is important that it is tested for. Based on the similar median survival times associated with adverse IGH translocations, +1q21 and del(17p) when they occurred in isolation, and the identical hazard ratios associated with each lesion in multivariate analysis, we conclude that none of these lesions has a greater negative impact on survival than the others.
We show that these three groups are not mutually exclusive but frequently co-segregate, with +1q21 and the adverse translocation group showing a positive association. Importantly, we show that these relationships are clinically significant, with the accumulation of adverse genetic lesions being strongly associated with a progressive impairment of PFS and OS. It is therefore important to know the presence or absence of each of these lesions in order to properly interpret their clinical significance, with combinations of lesions being associated with the worst prognosis. When considering prediction of outcome for the individual, therefore, it is as important to know how many of these lesions are present as which lesion is present. This finding is consistent with the multistep model of myeloma pathogenesis and progression (27). In this model, IGH translocations and hyperdiploidy are primary events, whilst +1q21 and del(17p13) are associated with disease progression. As primary events, adverse IGH translocations such as t(14;20) have been described in indolent disease states such as MGUS and asymptomatic myeloma, so the fact that they are not intrinsically associated with high risk disease in the absence of co-operating genetic events fits this pathological model (30). Similarly, the prognostic impact of progression events such as +1q21 and del(17p13) will be modulated by the etiological background of the myeloma clone, so that +1q21 in association with t(4;14) is likely to have a different clinical phenotype to +1q21 in association with hyperdiploidy.
We have used these observations to develop a prognostic classification system based on the accumulation of +1q21, del(17p13) and adverse IGH translocations. In this classification low risk disease is defined by the absence of any of these lesions, intermediate risk by the presence of 1 adverse lesion, and high risk by the presence of >1 adverse lesion. This grouping is different from other FISH-based prognostic systems, which treat these FISH lesions as mutually exclusive groups, as it recognises the relationships of these genetic lesions and takes into account some of the complexity of the myeloma clone. This genetic grouping does not replace existing classification systems such as the ISS and there was, in fact, little overlap between the genetic risk groups and the ISS. Consequently, integrating the ISS and these genetic risk groups provides a more accurate definition of risk for an individual patient. Using this approach, an ultra-high risk group characterised by >1 adverse genetic lesions and ISS II or III was defined. This group was small, comprising 13.8% of patients, and was associated with a median PFS of 9.9 months and a median OS of 19.4 months. These patients require alternative therapeutic strategies and should be the focus of clinical trials incorporating dose intensification, allogeneic transplantation or novel agents.
Gene expression signatures associated with high risk myeloma, such as those produced by the UAMS and IFM groups, generally had hazard ratios of >5 in their respective data sets, falling to >2 when applied to other data sets(2-3). In comparison, the ultra-high risk group formed by the combination of FISH and the ISS was associated with a hazard ratio of 4.16. The difficulty with gene expression signatures in myeloma is that there is currently no firm consensus; the UAMS 17-gene signature, IFM 15-gene signature and our own 6-gene signature share no common genes, and more work is required to define common genes, regions or gene functionality before these signatures can be more widely applied. Until then, whilst high risk gene expression signatures remain valid and useful tools within the context of specialist centers, and provide valuable insight into myeloma biology, their application in a multi-centered setting is uncertain. In comparison there is an emerging consensus regarding FISH lesions associated with short survival, and this study demonstrated that defining cases with co-segregation of these lesions, and incorporating the ISS, can refine these associations to identify a group of patients associated with a very poor clinical outcome. This system was strongly associated with survival in the overall data set, and in subgroup analyses of all treatment contexts: patients treated with conventional induction therapy, patients treated with thalidomide-based induction therapy, patients treated with high dose melphalan, patients treated non-intensively, patients treated with thalidomide maintenance and patients who did not received maintenance. The system would require validation in other treatment settings such as bortezomib therapy. Some reports have suggested that bortezomib therapy may overcome the adverse prognosis associated with some adverse genetic lesions, although he largest study addressing this question found that t(4;14) and del(17p13) remained prognostic parameters in patients receiving bortezomib induction(14). This suggests that this model may remain prognostic in bortezomib treated patients, and even if the individual lesions included in the model require reassessment in alternative therapeutic contexts, the concept of a summative impact on survival of co-segregating adverse lesions is likely to remain relevant.
In conclusion, this study demonstrates that t(4;14), t(14;16), t(14;20), +1q21 and del(17p13) can be used to define adverse prognosis in myeloma in the context of thalidomide and conventional induction therapy, with or without autologous transplantation, and patients with the worst clinical outcome are identified by the co-segregation of more than one of these lesions. We also show the importance of combining clinical and genetic factors for predicting patient outcome.
Supplementary Material
Acknowledgements
Main financial support for the Myeloma IX clinical trial was from UK Medical Research Council, with additional funding in the form of unrestricted educational grants from Novartis, Schering Health Care, Chugai, Pharmion, Celgene and Ortho Biotech. The LLR UKMF Cytogenetics group received financial support from Leukaemia and Lymphoma Research. The Institute of Cancer Research received support from Myeloma UK, Cancer Research UK and the biological research center of the National Institute for Health Research at the Royal Marsden Hospital. The University of Leeds acted as the trial sponsor. We acknowledge the support of the National Institute for Health Research, through the National Cancer Research Network. We thank Rebecca Protheroe, David Stockley, Tim Parker, Hazel Robinson, Elisabet Dachs Cabanas and Christina Rudduck of the LLR UKMF Cytogenetics group for probe preparation and FISH scoring. We also thank staff from the Clinical Trials Research Unit, University of Leeds, for trial co-ordination and data management.
Footnotes
Disclosure of Conflict of Interest
The authors have no relevant conflicts of interest to report.
References
- 1.Greipp PR, San Miguel J, Durie BG, Crowley JJ, Barlogie B, Blade J, et al. International staging system for multiple myeloma. J Clin Oncol. 2005 May 20;23(15):3412–3420. doi: 10.1200/JCO.2005.04.242. [DOI] [PubMed] [Google Scholar]
- 2.Shaughnessy JD, Jr., Zhan F, Burington BE, Huang Y, Colla S, Hanamura I, et al. A validated gene expression model of high-risk multiple myeloma is defined by deregulated expression of genes mapping to chromosome 1. Blood. 2007 Mar 15;109(6):2276–2284. doi: 10.1182/blood-2006-07-038430. [DOI] [PubMed] [Google Scholar]
- 3.DecauxO LL, Magrangeas F, et al. Prediction of survival in multiple myeloma based on gene expression profiles reveals cell cycle and chromosomal instability signatures in high-risk patients and hyperdiplod signatures in low risk patients: A study of the Intergroupe Francophone dy Myelome. J Clin Oncol. 2008;26(24) doi: 10.1200/JCO.2007.13.8545. [DOI] [PubMed] [Google Scholar]
- 4.Dickens NJ, Walker BA, Leone PE, Johnson DC, Brito JL, Zeisig A, et al. Homozygous deletion mapping in myeloma samples identifies genes and an expression signature relevant to pathogenesis and outcome. Clin Cancer Res. 2010 Mar 15;16(6):1856–1864. doi: 10.1158/1078-0432.CCR-09-2831. [DOI] [PMC free article] [PubMed] [Google Scholar]
- 5.Keats JJ, Reiman T, Maxwell CA, Taylor BJ, Larratt LM, Mant MJ, et al. In multiple myeloma, t(4;14)(p16;q32) is an adverse prognostic factor irrespective of FGFR3 expression. Blood. 2003 Feb 15;101(4):1520–1529. doi: 10.1182/blood-2002-06-1675. [DOI] [PubMed] [Google Scholar]
- 6.Fonseca R, Blood E, Rue M, Harrington D, Oken MM, Kyle RA, et al. Clinical and biologic implications of recurrent genomic aberrations in myeloma. Blood. 2003 Jun 1;101(11):4569–4575. doi: 10.1182/blood-2002-10-3017. [DOI] [PubMed] [Google Scholar]
- 7.Chang H, Sloan S, Li D, Zhuang L, Yi QL, Chen CI, et al. The t(4;14) is associated with poor prognosis in myeloma patients undergoing autologous stem cell transplant. Br J Haematol. 2004 Apr;125(1):64–68. doi: 10.1111/j.1365-2141.2004.04867.x. [DOI] [PubMed] [Google Scholar]
- 8.Gertz MA, Lacy MQ, Dispenzieri A, Greipp PR, Litzow MR, Henderson KJ, et al. Clinical implications of t(11;14)(q13;q32), t(4;14)(p16.3;q32), and - 17p13 in myeloma patients treated with high-dose therapy. Blood. 2005 Oct 15;106(8):2837–2840. doi: 10.1182/blood-2005-04-1411. [DOI] [PMC free article] [PubMed] [Google Scholar]
- 9.Zhan F, Huang Y, Colla S, Stewart JP, Hanamura I, Gupta S, et al. The molecular classification of multiple myeloma. Blood. 2006 Sep 15;108(6):2020–2028. doi: 10.1182/blood-2005-11-013458. [DOI] [PMC free article] [PubMed] [Google Scholar]
- 10.Avet-Loiseau H, Attal M, Moreau P, Charbonnel C, Garban F, Hulin C, et al. Genetic abnormalities and survival in multiple myeloma: the experience of the Intergroupe Francophone du Myelome. Blood. 2007 Apr 15;109(8):3489–3495. doi: 10.1182/blood-2006-08-040410. [DOI] [PubMed] [Google Scholar]
- 11.Neben K, Jauch A, Bertsch U, Heiss C, Hielscher T, Seckinger A, et al. Combining information regarding chromosomal aberrations t(4;14) and del(17p13) with the International Staging System classification allows stratification of myeloma patients undergoing autologous stem cell transplantation. Haematologica. 2010 Jul;95(7):1150–1157. doi: 10.3324/haematol.2009.016436. [DOI] [PMC free article] [PubMed] [Google Scholar]
- 12.San Miguel JF, Schlag R, Khuageva NK, Dimopoulos MA, Shpilberg O, Kropff M, et al. Bortezomib plus melphalan and prednisone for initial treatment of multiple myeloma. N Engl J Med. 2008 Aug 28;359(9):906–917. doi: 10.1056/NEJMoa0801479. [DOI] [PubMed] [Google Scholar]
- 13.Pineda-Roman M, Zangari M, Haessler J, Anaissie E, Tricot G, van Rhee F, et al. Sustained complete remissions in multiple myeloma linked to bortezomib in total therapy 3: comparison with total therapy 2. Br J Haematol. 2008 Mar;140(6):625–634. doi: 10.1111/j.1365-2141.2007.06921.x. [DOI] [PMC free article] [PubMed] [Google Scholar]
- 14.Avet-Loiseau H, Leleu X, Roussel M, Moreau P, Guerin-Charbonnel C, Caillot D, et al. Bortezomib plus dexamethasone induction improves outcome of patients with t(4;14) myeloma but not outcome of patients with del(17p) J Clin Oncol. 2010 Oct 20;28(30):4630–4634. doi: 10.1200/JCO.2010.28.3945. [DOI] [PubMed] [Google Scholar]
- 15.Ross FM, Ibrahim AH, Vilain-Holmes A, Winfield MO, Chiecchio L, Protheroe RK, et al. Age has a profound effect on the incidence and significance of chromosome abnormalities in myeloma. Leukemia. 2005 Sep;19(9):1634–1642. doi: 10.1038/sj.leu.2403857. [DOI] [PubMed] [Google Scholar]
- 16.Avet-Loiseau H, Malard F, Campion L, Magrangeas F, Sebban C, Lioure B, et al. Translocation t(14;16) and multiple myeloma: is it really an independent prognostic factor? Blood. 2011 Feb 10;117(6):2009–2011. doi: 10.1182/blood-2010-07-295105. [DOI] [PubMed] [Google Scholar]
- 17.Drach J, Ackermann J, Fritz E, Kromer E, Schuster R, Gisslinger H, et al. Presence of a p53 gene deletion in patients with multiple myeloma predicts for short survival after conventional-dose chemotherapy. Blood. 1998 Aug 1;92(3):802–809. [PubMed] [Google Scholar]
- 18.Chang HQC, Yi QL, Reece D, Stewart AK. p53 gene deletion detected by fluorescent in situ hybridization is an adverse prognostic factor for patients with multiple myeloma following autologous stem cell transplantation. Blood. 2005;105:358–360. doi: 10.1182/blood-2004-04-1363. [DOI] [PubMed] [Google Scholar]
- 19.Harousseau JL, Avet-Loiseau H, Attal M, Charbonnel C, Garban F, Hulin C, et al. Achievement of at least very good partial response is a simple and robust prognostic factor in patients with multiple myeloma treated with high-dose therapy: long-term analysis of the IFM 99-02 and 99-04 Trials. J Clin Oncol. 2009 Dec 1;27(34):5720–5726. doi: 10.1200/JCO.2008.21.1060. [DOI] [PubMed] [Google Scholar]
- 20.Tricot G, Barlogie B, Jagannath S, Bracy D, Mattox S, Vesole DH, et al. Poor prognosis in multiple myeloma is associated only with partial or complete deletions of chromosome 13 or abnormalities involving 11q and not with other karyotype abnormalities. Blood. 1995 Dec 1;86(11):4250–4256. [PubMed] [Google Scholar]
- 21.Perez-Simon JA, Garcia-Sanz R, Tabernero MD, Almeida J, Gonzalez M, Fernandez-Calvo J, et al. Prognostic value of numerical chromosome aberrations in multiple myeloma: A FISH analysis of 15 different chromosomes. Blood. 1998 May 1;91(9):3366–3371. [PubMed] [Google Scholar]
- 22.Zojer N, Konigsberg R, Ackermann J, Fritz E, Dallinger S, Kromer E, et al. Deletion of 13q14 remains an independent adverse prognostic variable in multiple myeloma despite its frequent detection by interphase fluorescence in situ hybridization. Blood. 2000 Mar 15;95(6):1925–1930. [PubMed] [Google Scholar]
- 23.Chiecchio L, Protheroe RK, Ibrahim AH, Cheung KL, Rudduck C, Dagrada GP, et al. Deletion of chromosome 13 detected by conventional cytogenetics is a critical prognostic factor in myeloma. Leukemia. 2006 Sep;20(9):1610–1617. doi: 10.1038/sj.leu.2404304. [DOI] [PubMed] [Google Scholar]
- 24.Gutierrez NC, Castellanos MV, Martin ML, Mateos MV, Hernandez JM, Fernandez M, et al. Prognostic and biological implications of genetic abnormalities in multiple myeloma undergoing autologous stem cell transplantation: t(4;14) is the most relevant adverse prognostic factor, whereas RB deletion as a unique abnormality is not associated with adverse prognosis. Leukemia. 2007 Jan;21(1):143–150. doi: 10.1038/sj.leu.2404413. [DOI] [PubMed] [Google Scholar]
- 25.Hanamura I, Stewart JP, Huang Y, Zhan F, Santra M, Sawyer JR, et al. Frequent gain of chromosome band 1q21 in plasma-cell dyscrasias detected by fluorescence in situ hybridization: incidence increases from MGUS to relapsed myeloma and is related to prognosis and disease progression following tandem stem-cell transplantation. Blood. 2006 Sep 1;108(5):1724–1732. doi: 10.1182/blood-2006-03-009910. [DOI] [PMC free article] [PubMed] [Google Scholar]
- 26.Fonseca R, Van Wier SA, Chng WJ, Ketterling R, Lacy MQ, Dispenzieri A, et al. Prognostic value of chromosome 1q21 gain by fluorescent in situ hybridization and increase CKS1B expression in myeloma. Leukemia. 2006 Nov;20(11):2034–2040. doi: 10.1038/sj.leu.2404403. [DOI] [PubMed] [Google Scholar]
- 27.Fonseca R, Bergsagel PL, Drach J, Shaughnessy J, Gutierrez N, Stewart AK, et al. International Myeloma Working Group molecular classification of multiple myeloma: spotlight review. Leukemia. 2009 Dec;23(12):2210–2221. doi: 10.1038/leu.2009.174. [DOI] [PMC free article] [PubMed] [Google Scholar]
- 28.Morgan GJ, Davies FE, Gregory WM, Cocks K, Bell SE, Szubert AJ, et al. First-line treatment with zoledronic acid as compared with clodronic acid in multiple myeloma (MRC Myeloma IX): a randomised controlled trial. Lancet. 2010 Dec 11;376(9757):1989–1999. doi: 10.1016/S0140-6736(10)62051-X. [DOI] [PMC free article] [PubMed] [Google Scholar]
- 29.Nair B, van Rhee F, Shaughnessy JD, Jr., Anaissie E, Szymonifka J, Hoering A, et al. Superior results of Total Therapy 3 (2003-33) in gene expression profiling-defined low-risk multiple myeloma confirmed in subsequent trial 2006-66 with VRD maintenance. Blood. 2010 May 27;115(21):4168–4173. doi: 10.1182/blood-2009-11-255620. [DOI] [PMC free article] [PubMed] [Google Scholar]
- 30.Ross FM, Chiecchio L, Dagrada G, Protheroe RK, Stockley DM, Harrison CJ, et al. The t(14;20) is a poor prognostic factor in myeloma but is associated with long-term stable disease in monoclonal gammopathies of undetermined significance. Haematologica. 2010 Jul;95(7):1221–1225. doi: 10.3324/haematol.2009.016329. [DOI] [PMC free article] [PubMed] [Google Scholar]
Associated Data
This section collects any data citations, data availability statements, or supplementary materials included in this article.