Abstract
A remarkable feature of neuronal glutamate transporters (EAATs) is their dual functions of classical carriers and ligand-gated chloride (CI−) channels. CI− conductance is rapidly activated by glutamate in subtype EAAT5, which mediates light responses in depolarizing bipolar cells (DBC) in retinae of lower vertebrates. In this study, we examine whether EAAT5 also mediates the DBC light response in mouse. We took advantage of an infrared illuminated micro-injection system, and studied the effects of the EAAT blocker (TBOA) and a glutamate receptor agonist (LAP4) on the mouse electroretinogram (ERG) b-wave responses. Our results showed that TBOA and LAP4 shared similar temporal patterns of inhibition: both inhibited the ERG b-wave shortly after injection and recovered with similar time courses. TBOA inhibited the b-wave completely at mesopic light intensity with an IC50 value about 1 log unit higher than that of LAP4. The inhibitory effects of TBOA and LAP4 were found to be additive in the photopic range. Furthermore, TBOA alone inhibited the b-wave in the cone operative range in knockout mice lacking DBCRs at a low concentration that did not alter synaptic glutamate clearance activity. It also produced a stronger inhibition than that of LAP4 on the cone-driven b-wave measured with a double flash method in wildtype mice. These electrophysiological data suggest a significant role for EAAT5 in mediating cone-driven DBC light responses. Our immunohistochemistry data indicated the presence of postsynaptic EAAT5 on some DBCCs and some DBCRs, providing an anatomical basis for EAAT5’s role in DBC light responses.
Keywords: Bipolar cells, retina, glutamate transporter, EAAT5, electroretinogram, immunohistochemistry
1 INTRODUCTION
The amino acid L-glutamate is the major retinal excitatory transmitter that is used by the first synapse between photoreceptors and second-order retinal neurons (Massey and Redburn 1987; Massey 1990). In darkness, L-glutamate (GLU) is continuously released from axonal terminals of cone and rod photoreceptors (Copenhagen and Jahr 1989). Light hyperpolarizes photoreceptors and decreases vesicular GLU release, suppresses GLU binding with postsynaptic GLU receptors, and changes bipolar and horizontal cell responses (Cervetto and MacNichol 1972; Murakami, Otsuka et al. 1975; Attwell 1990). The membrane potentials in the bipolar and horizontal cells are largely determined by the concentration of GLU in the synaptic cleft, so it is critical to precisely control the amount of GLU in the cleft to ensure reliable transmission of light elicited signal. This is achieved by GLU uptake by excitatory amino acid transporters (EAATs). To date, five subtypes of EAATs have been identified in the mammalian central nervous system (Danbolt 2001; Shigeri, Seal et al. 2004), named EAAT1 to EAAT5.
A remarkable observation of EAATs is their dual functions of classical carriers and ligand-gated chloride (CI−) channels (reviewed by (Sonders and Amara 1996)). Briefly, some EAATs were found to mediate substrate-elicited currents exceeding that predicted for coupling stoichiometry, to a magnitude comparable to a bona fide ion channel. More interestingly, some variants of the transporters have been shown to mediate currents without transporting the substrate. The CI− current, rapidly activated by glutamate and dependent on sodium ions, was reported to be more pronounced in EAAT5 (Arriza, Eliasof et al. 1997) in contrast to the small but measurable conductance associated with the other EAATs (Wadiche, Amara et al. 1995). In retina, such CI− conductance has been demonstrated in terminals of salamander (Sarantis, Everett et al. 1988; Grant and Werblin 1996), turtle (Tachibana and Kaneko 1988), mouse (Hasegawa, Obara et al. 2006) and ground squirrel photoreceptors (Szmajda and Devries 2011), as well as teleost (Grant and Dowling 1995; Grant and Dowling 1996) and mouse bipolar cells (Wersinger, Schwab et al. 2006), suggesting a possible role in regulating presynaptic endogenous GLU release. Most interestingly, EAAT5 has been shown to act as a postsynaptic receptor and mediate light responses in teleost bipolar cells through its associated chloride conductance (Grant and Dowling 1995; Grant and Dowling 1996; Wong, Adolph et al. 2005; Wong, Cohen et al. 2005; Nelson and Singla 2009), implying that the GLU-gated EAAT5 channels may play a significant role in the ON pathway in the retina.
It is believed that the postsynaptic mechanism mediating light responses depends on the group III metabotropic glutamate receptor mGluR6 on depolarizing bipolar cells in mammal (Nakajima, Iwakabe et al. 1993). In human, mutations in the gene encoding mGluR6 lead to night blindness (Dryja, McGee et al. 2005). Affected patients are blind under scotopic condition but have near-normal visual acuity and limited degradation of visual function under photopic lighting condition. Their electroretinograms showed no rod-driven b-wave but partially preserved cone b-wave. Similarly, mGluR6 deficiency in mouse eliminated b-wave and resulted in a negative ERG in the rod operative range (Masu, Iwakabe et al. 1995). Interesting, a minor corneal-positive component was also shown in the ERGs under the photopic range at around 50msec (See Fig. 4D of the Masu et al paper) and the behavioral test result was normal. Similar corneal-positive component has been found in our preliminary results at 40–50msec (unpublished observation). The above findings could be partly explained if there are other glutamate receptors on the depolarizing bipolar cells besides mGluR6.
To test the above hypothesis and determine whether EAAT5 mediates the light response of depolarizing bipolar cells (DBC) in dark-adapted mouse retina, we took advantage of an infrared illuminated micro-injection system to apply GLU analogue and EAAT5 blocker shortly before the scotopic ERG b-wave (which originates from DBCs) was measured. The time course and dose-response relations of those drugs are also reported. Finally, we verified our electrophysiological findings with anatomical evidence by localizing EAAT5 in mouse retina using immunohistochemistry (IHC).
2 MATERIAL AND METHODS
2.1 Animals
Ninety-three Wildtype (WT) mice (C57BL/6) from Jackson Laboratories (Bar Harbor, ME) and 7 Bhlhb4(−/−) mice (99% C57BL/6 genetic background) (Bramblett, Pennesi et al. 2004) between 8 and 12 weeks old were used for experiments. Animals were treated in accordance with NIH guidelines and the Baylor College of Medicine IACUC welfare guidelines.
2.2 Intravitreal Injection
Solutions containing LAP4 (Cat. no. 0103, Tocris bioscience, Minneapolis, MN), or TBOA (Cat. no.1223, Tocris bioscience) were prepared by dissolving them in sterile Balanced Salt Solution (Alcon, Fort Worth, TX). Retinal concentrations of drugs were calculated assuming injected solution was diluted by 20μL of vitreous.
Prior to injection, mice were first allowed to adapt to the dark for a minimum of 4 hours. Under dim red light, mice were anaesthetized with weight-based intraperitoneal injection of solution containing ketamine (46mg/ml), xylazine (9.2mg/ml), and acepromazine (0.77mg/ml). A single drop of 1% tropicamide, 2.5% phenylephrine and 0.5% proparacaine hydrochloride were instilled on the cornea to dilate the pupil and for topical anesthesia. Under infrared illumination, a 32-gauge disposable needle was used to puncture the sclera. Drug containing solution, or control saline solution, was injected unilaterally using a NanoFil microinjection system (World Precision Instrument, FL) into the vitreous chamber with a 34-gauge blunt needle visible through the dilated pupil. To prevent the injected solution from escaping the eye when the needle was withdrawn, the needle was allowed to stay for an additional 30sec in the eye following the displacement of the plunger.
2.3 Electroretinogram
Mice were placed inside a Ganzfeld dome coated with highly reflective white paint (Munsell Paint, New Windsor, NY) with their body temperature maintained at 39°C using a heating pad. A blunt platinum active needle electrode was placed in contact with the center of each cornea. A small amount of 2.5% methylcellulose gel was applied to the eye. Reference and ground electrodes were respectively placed in the forehead and tail. Mice were then allowed to remain in complete darkness for 3 min before recording.
A half millisecond square pulse of 505 nm peak wavelength, generated using cyan light emitting diodes, was used for all scotopic stimuli. To facilitate dissection of the rod and cone pathways, the scotopic ERG protocol which was comprised of progressively increasing stimuli strength, was used to measure the b- and a- waves in different zones as defined previously (Abd-El-Barr, Pennesi et al. 2009). At the lowest intensity, 25 responses were averaged with a delay of 2 sec between each ash. As the intensity of the ash increased, fewer responses were averaged with a longer delay between ashes. At the end of the scotopic protocol, saturating stimuli were generated with 1500 W xenon flash bulbs (Novatron, Dallas, TX), attenuated with apertures and diffusers. The above protocol lasted 11 min and was implemented 4 times in the first hours following injection of the drugs to study the time course of their effects.
The cone ERG was studied by a double- ash method using the xenon ashes. An initial conditioning ash saturates both rods and cones 2 sec before a probe ash. The ERG recorded by the probe ash is attributed to responses driven by the cones. All flashes were calibrated with a photometer (ILT1700 International Light, MA) and converted to the unit photoisomerizations/rod (R*/Rod), where 1 scot cd m^2 = 581 photoisomerizations/rod/s (Saszik, Robson et al. 2002; Lyubarsky, Daniele et al. 2004). Signals were amplified with a Grass P122 amplifier (band-pass 0.1 to 1,000Hz; Grass Instruments, West Warwick, RI). Data were acquired at a sampling rate of 10 kHz with a data acquisition board (USB-6216, National Instruments, TX). Traces were averaged and analyzed with custom codes written in Matlab (The MathWorks, Natick, MA). To remove oscillatory potentials before fitting, the scotopic b-wave was digitally filtered using the filtfilt function (low-pass filtered; Fc = 60 Hz) in Matlab. Dose-response curves showing b-wave against drug concentration were fitted using the DoseRep function of OriginPro v8.6 (OriginLab Corp., Northampton, MA) pharmacology toolbox. Statistical comparison between groups in this paper was calculated using a 2 tailed t-test or one-way ANOVA with Tukey post-hoc test, and significant difference was defined as p<0.05 unless otherwise stated.
2.4 Antibody Characterization
The following antibodies were obtained from commercial suppliers and applied in order to label specific cell types of the retina (Table 1). Horizontal cells were immuno-labeled with a mouse monoclonal antibody against calbindin (de Melo, Qiu et al. 2003). ON-cone and rod bipolar cells were immuno-labeled with a mouse monoclonal antibody against G-protein Goα (Haverkamp and Wassle 2000). Rod bipolar cells were immuno-labeled with rabbit and mouse antibodies against PKCα (Zhang, Yang et al. 2005). Rod photoreceptor spherules were labeled with anti-PSD95 antibody (Oh, Khan et al. 2007). Fluorescein tagged peanut agglutinin (PNA) was used to stain cone pedicles (Blanks and Johnson 1983). Anti-EAAT5 antiserum was purchased from Santa Cruz Biotechnology (Santa Cruz, CA) for labeling membrane EAAT5. The antiserum has been shown to label rod spherules, cone pedicles, some amacrine and some bipolar cells (Fyk-Kolodziej, Qin et al. 2004) in the cat retina. The specificity of the antiserum has been verified by Western blots of retina which showed the immunoreactivity to be concentrated in a single band, at the published molecular weight of 63kD (Pow and Barnett 2000), that reduced greatly when pre-incubated with blocking peptide (Fyk-Kolodziej, Qin et al. 2004).
Table 1.
Primary Antibodies/lectin Used in This Study
| Antigen | Dilution | Host, type | Source | Catalog no. | Immunogen |
|---|---|---|---|---|---|
| Calbindin | 1:1000 | Rabbit, polyclonal | Millipore (Billerica, MA) | AB1778 | Recombinant mouse calbindin |
| EAAT5 | 1:20 | Goat, polyclonal | Santa Cruz Biotechnology (Santa Cruz, CA) | sc-18779 | Peptide corresponding to amino acid 150–220 from an internal region of human EAAT5 |
| Goα | 1:500 | Mouse, monoclonal | Chemicon International (Temecula, CA) | MAB3073 | Purified bovine brain Goα |
| PKCα | 1:1000 | Rabbit, polyclonal | Sigma-Aldrich Co. LLC (St. Louis, MO) | P4334 | synthetic peptide corresponding to amino acids 659–672 from the C-terminal variable (V5) region of rat PKCα |
| 1:250 | Mouse, monoclonal | BD Transduction Lab. (San Jose, CA) | 610107 | Human PKCα aa. 270–427 Recombinant Protein | |
| PSD95 | 1:100 | Rabbit, polyclonal | Abcam plc (Cambridge, MA) | Ab18258 | Synthetic peptide conjugated to KLH derived from within residues 50 – 150 of Mouse PSD95 |
| Peanut agglutinin | 1:50 | - | Vector Laboratories Inc (Burlingame, CA) | FL-1071 | - |
2.5 Tissue preparation and immunohistochemistry
The eyes were enucleated when the mice were deeply anesthetized, just before they were euthanized by an overdose of the anesthesia. The eyes were then dissected and the whole retina was isolated carefully. The whole retinae were fixed in 4% paraformaldehyde (Electron Microscopy Science, Fort Washington, PA) in phosphate buffer (DPBS, Invitrogen, La Jolla, CA), pH 7.4, for 45 minutes at room temperature.
IHC was performed using an indirect antibody method. The retinae were blocked with 10% donkey serum (Jackson Immunoresearch, West Grove, PA) in TBS (DPBS with 0.5% Triton X-100 (Sigma) and 0.1% sodium azide (Sigma), pH 7.2) at 4°C overnight to decrease nonspecific labeling. Blocked retinae were cut into vertical sections 40μm in thickness using a vibratome, and the free-floating sections were incubated in primary antibodies in the presence of 3% donkey serum-TBS for 4 days at 4°C. Controls lacking primary antibodies were also processed. After rinsing several times, the sections were transferred into donkey-hosted secondary antibodies conjugated with Cy5, Cy3 (1:200, Jackson Immunoresearch), or Alexa Fluor 488 (1:200, Molecular Probes, Eugene, OR) in 3% normal donkey serum-TBS solution at 4°C overnight. Following several rinses, the sections were mounted with Vectashield medium (Vector Laboratories, Burlingame, CA) and coverslipped. Mounted slides were observed with a confocal laser scanning microscope (LSM 510; Zeiss, Thornwood, NY). Images were acquired using 40x and 63x oil-immersion objectives with Zeiss LSM software. Adobe Photoshop CS5 (Adobe Systems, San Jose, CA) was then used to crop images and uniformly apply identical brightness and contrast adjustments.
3 RESULTS
3.1 Effects of injected saline on the ERG
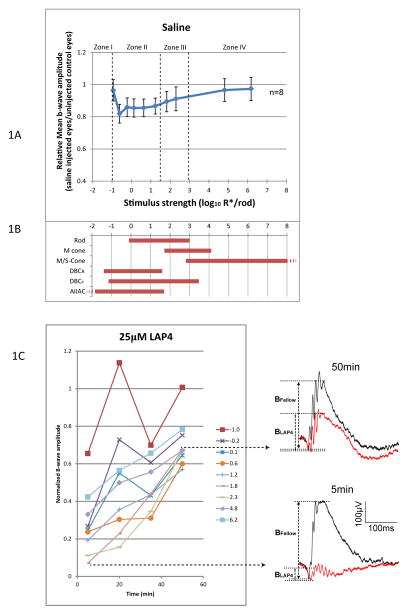
To control for possible artifactual effects of puncturing the eye and injecting saline on the ERG, a set of control experiments were conducted using exactly the same procedures in which sterile saline was injected unilaterally (Fig. 1A). It was found that injecting saline alone reduced the mean b-wave by 3–17% comparing to the uninjected control eyes depending on the strength of stimulus (n=8). Therefore, the subsequent results have been normalized according to their corresponding stimulus strength and recorded time to compensate for this saline attributed effect such that:
Figure 1.
(A) Relative b-wave amplitude against stimulus strength, measured 5 min after injection of saline. B-wave was reduced by a maximum of 17% in stimulus zone II, and about 3% in stimulus zone IV. This serves as a basis for normalization for the LAP4 or TBOA data. (B) Dynamic ranges (defined as 5–95% of maximum response) of various retinal neurons measured in wild type mice. Rod, M- and S-cone data are from suction-electrode recording from outer segments (Field and Rieke 2002; Nikonov, Kholodenko et al. 2006). M/S-cone range is extrapolated from the fact that many cones co-express both pigments (Applebury, Antoch et al. 2000). Ranges for DBCR, DBCC, and AIIAC are from light-evoked voltage-clamp results (Pang, Gao et al. 2004). (C) Changes of b-wave amplitude over time after applying 25μM (retinal concentration) LAP4. Lines represent corresponding strength of stimulus in log R*/Rod. Normalized b-wave amplitudes were lowest at the 5 min point and increased with time, implying that LAP4 inhibits the b-wave through a fast acting mechanism. Representative wave traces at 5min and 50min are shown on the right.
To facilitate dissection of the rod/cone pathways the stimulus strength is divided into four different zones (Abd-El-Barr, Pennesi et al. 2009), which correspond to the operating ranges of different retinal neurons including rod, cone, DBCR, DBCC and AII amacrine cells (Fig. 1B). For simplicity, zones I and II together may be regarded as scotopic zones, while zone III and IV may be respectively regarded as mesopic and photopic. In zone I, the positive and negative scotopic threshold response (STR) originated from third order neurons (Saszik, Robson et al. 2002) are the only detectable components of the flash ERG. As stimulus strength increases, DBCRs and DBCCs become functional in zone II and manifest as the characteristic rod driven b-wave. The b-wave increases in amplitude as the stimulus strength increases, and buries the positive STR which may also exist in zone II. In zone III, the M-cone driven DBCs are functional. Their electrical activities are added to the rod driven b-wave from zone II. In zone IV, the M/S-cone becomes active as well. The recorded ERG b-wave is a summation of the activities of the M/S-cone driven DBCs and those from zone III.
3.2 Effects of glutamate analogue LAP4 on the ERG
Exogenously introduced LAP4 (a synthesized glutamate analogue and a specific agonist for group III metabotropic glutamate receptors) inhibited the ERG b-wave shortly after being injected. As shown in Fig. 1C, such inhibition of the b-wave was most prominent at the 5 min point and dissipated partially within the first hour after injection.
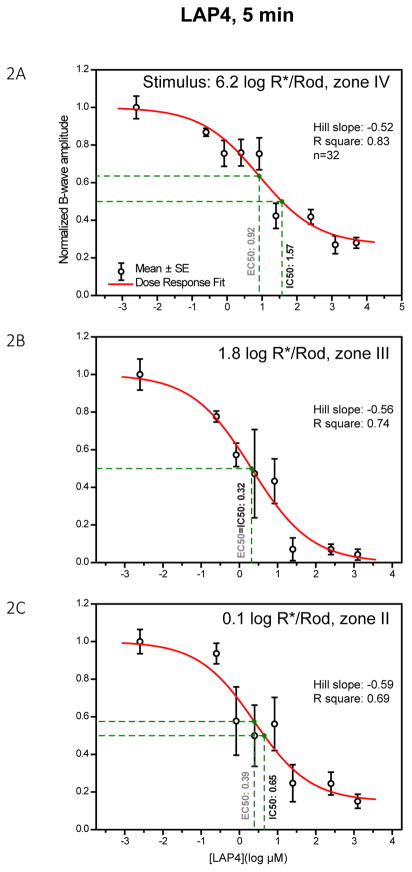
The inhibitory effect of LAP4 was studied with a titrating experimental approach to establish its dose-response relationship. Thirty-two mice were injected with various concentrations of the agonist and then the ERG was used to monitor the effect of the drug. The data at the 5 min time point at which inhibition was maximum was chosen for the above purpose before the LAP4 was cleared from the synaptic cleft with time. The b-wave amplitude was then plotted against the retinal concentration in figure 2 panels A–C according to the strength of stimulus. As read from the drop-lines, LAP4 has IC50 values of 1.57, 0.32 and 0.65 log μM (37, 2.1 and 4.5 μM) at stimulus strengths of 6.2, 1.8 and 0.1 log R*/Rod, respectively. The IC50, defined as the concentration of the drug that inhibits 50% of the measured response, was found to be about 1 or more log unit higher in the photopic zone IV than those in measured zone III and II.
Figure 2.
Dose-response curves showing the amplitude of the b-wave against log concentration of LAP4 measured at three different stimulus levels. Individual data points and error bars denote value mean and standard error respectively. Values in black and green beside the vertical drop-lines represent IC50 and EC50, respectively. (A) Dose-response curve measured with a strong rod-saturating zone IV stimulus within the operating range of cones. B-wave was inhibited by 72% with highest concentrations of LAP4. (B) Curve measured with a moderate zone III stimulus. The b-wave was nearly fully inhibited (96%) when concentrations were high enough. (C) Curve measured with a weaker zone II stimulus. The b-wave was strongly inhibited by the highest concentrations of the drug, with about 15% remaining.
The highest concentration tested was 3.7 log μM (5mM). The inhibitions leveled off at 3.1, 1.4 and 3.1 log μM at stimulus strengths of 6.2, 1.8 and 0.1 log R*/Rod, respectively. The b-wave was fully suppressible when measured with a zone III moderate stimulus but not with zone II or IV stimuli. It is unlikely that the LAP4 insensitive b-waves in zone II and IV were resulted from inadequate LAP4 concentrations in the synapses, because b-wave was fully suppressible in zone II by any LAP4 concentration higher than 1.4 log μM.
The residual “b-wave” in zone II may be attributed to a LAP4 insensitive component related to the positive STR, which arises from third-order retinal cells, appears as positive wave form of similar latency and could have been otherwise buried by the b-wave. We have previously found a similar corneal positive component resembling the positive STR in DBCRs-lacking bhlhb4(−/−) mice when ERG was recorded using appropriate stimuli after prolonged dark adaption. The residual b-wave in zone IV is further studied in result section 3.5.
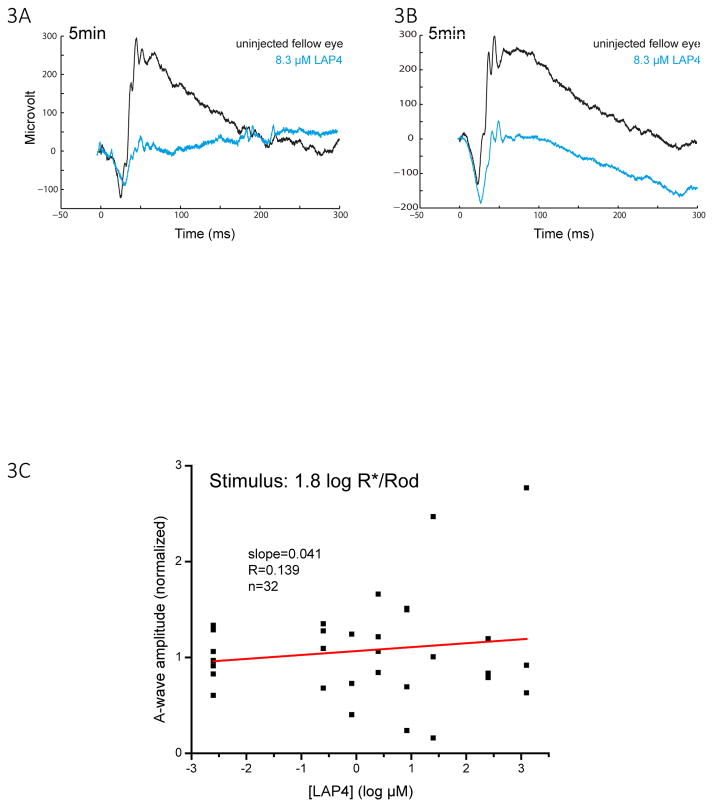
LAP4 inhibits the b-wave without consistently affecting the a-wave. When the raw ERG wave form is examined, the inhibition of the b-wave appeared to be associated with a minor change in the amplitude of the a-wave in some of the mice (Fig. 3A,B). The change in amplitude of the a-wave was different in individual mice and was not so dose-dependent, as shown in Fig. 3C. Because a-waves normally manifest as a PIII component truncated by a PII component (Granit 1933), LAP4 increased the variation of the a-wave through suppressing the b-wave.
Figure 3.
(A)(B) Representative raw wave traces showing the a- and b-wave of uninjected eye and injected eye in two different mice, each injected with 8.3 μM LAP4 in one eye. A consistent large reduction in the amplitude of the b-wave was observed together with a non-consistent change in the amplitude of the a-wave. (C) A scatterplot showing the normalized amplitude of a-wave versus log concentration of LAP4 measured with a zone III stimulus of 1.8 log R*/Rod. A-wave amplitude became quite variable when LAP4 concentrations were high. The slopes for the linear regression lines were 0.041, indicating that the amplitude of the a-wave barely changed with the concentration.
3.3 Effects of EAAT5 non-specific blocker (TBOA) on ERG
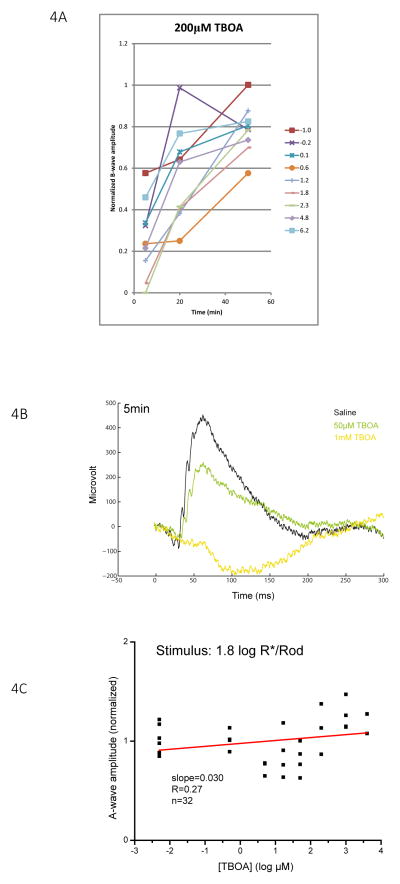
TBOA also inhibited the ERG b-wave shortly after it was injected. As shown in Fig. 4A, the b-wave was strongly inhibited with 200 μM TBOA at the 5 min post-injection time point, and recovered progressively during the 1 hour window measured for stimuli of all intensities tested. Similar to the case of LAP4, the amplitude of the a-wave was not systematically inhibited by TBOA (Fig. 4B, C) despite an increase in variation. Thus, implying that phototransduction was not inhibited.
Figure 4.
(A) Changes in b-wave amplitude over a 50 min period following injection of 200 μM (retinal concentration) TBOA. Lines represent corresponding stimulus strengths. Normalized b-wave amplitudes were the lowest at the 5 min point and increased with time, implying that TBOA inhibits the b-wave through a fast acting and temporary mechanism. (B) Representative raw ERG traces measured from eyes 5 minutes after injecting with saline, 50 μM TBOA and 1 mM TBOA with a zone III stimulus of 1.8 log R*/Rod. (C) Scatterplot showing the normalized amplitude of a-wave versus log concentration of TBOA measured with a zone III stimulus of 1.8 log R*/Rod. The slope of the regression lines is 0.03, indicating that the amplitude of the a-wave does not change with the concentration of TBOA.
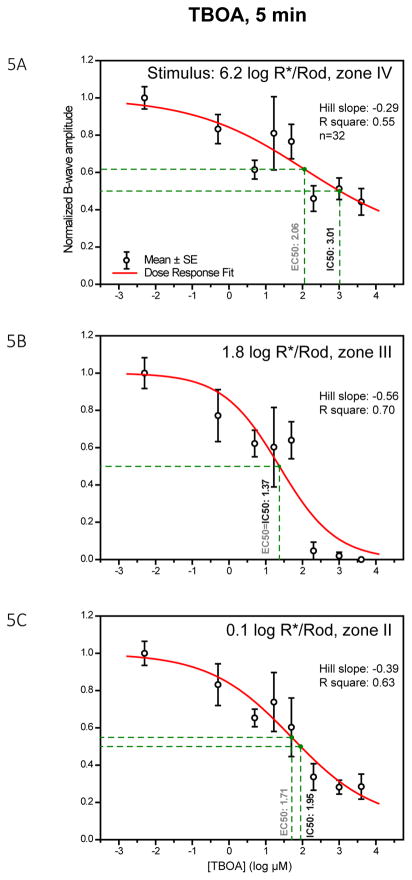
To characterize the dose-response relationship between TBOA and the inhibition of the b-wave, 32 mice were injected with several different concentrations of TBOA and then ERG was used to monitor the effect of the TBOA. Data at the 5 min time point was chosen to plot the dose-response curves in Fig. 5 panels A–C according to the strength of stimulus. As read from the drop-lines, TBOA has IC50 values of 3.01, 1.37 and 1.95 log μM (1023, 23, 89 μM) at stimulus strengths of 6.2, 1.8 and 0.1 log R*/Rod, respectively. Such values are higher than those of LAP4. TBOA fully inhibited the b-wave in stimulus range of zone III and partially inhibited the b-wave in zone II and IV. This pattern of inhibition is similar to that of LAP4.
Figure 5.
Dose-response curves showing amplitude of b-wave against log concentration of TBOA measured at three different stimulus levels. Individual data points and error bars denote value mean and standard error, respectively. Values in black and gray beside the vertical drop-lines represent IC50 and EC50, respectively. (A) Dose-response curve, measured with a strong rod-saturating zone IV stimulus within the operating range of cones. The b-wave was inhibited by 50–60% with the highest concentration of TBOA. (B) Curve measured with a moderate zone III stimulus. The b-wave was almost fully inhibited when TBOA concentration was high. (C) Curve measured with a weaker zone II stimulus. With the highest concentration of TBOA, the b-wave was largely reduced by about 75%.
3.4 Effects of injecting EAAT5 inhibitor (TBOA) on bhlhb4 −/− mice
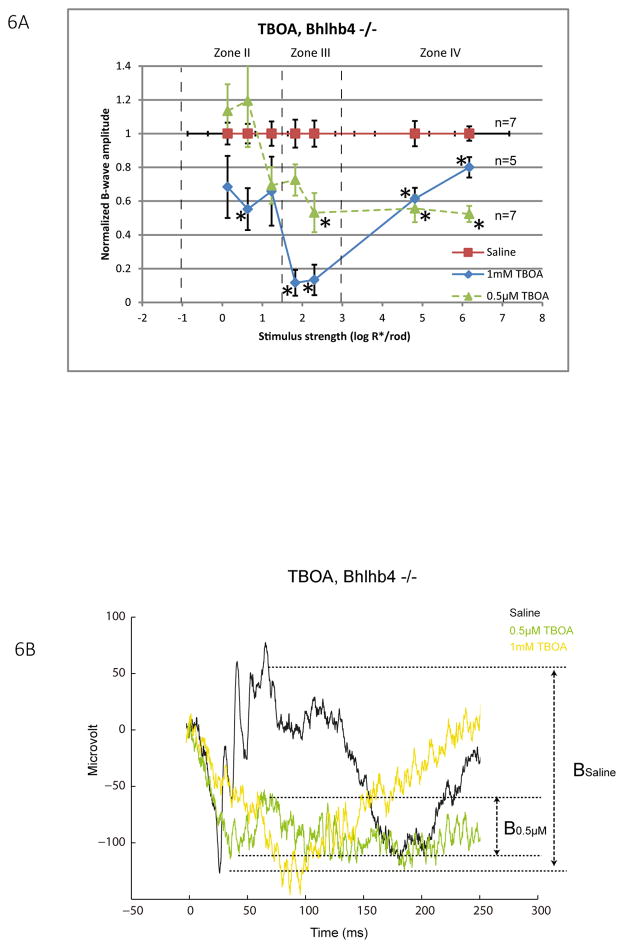
While it is known that the b-wave originates from retinal depolarizing bipolar cells, those cells can be classified as rod depolarizing bipolar cells (DBCR) and cone depolarizing bipolar cells (DBCC). To determine whether TBOA inhibits the b-wave through acting on the DBCCs, bhlhb4 −/− mice in which DBCRs are genetically removed (Bramblett, Pennesi et al. 2004), were injected with either a low concentration of TBOA (0.5μM, n=7) or a high concentration of TBOA (1mM, n=5). Bhlhb4 −/− mice are known to have reduced baseline amplitudes of the b-wave in all intensity zones (Abd-El-Barr, Pennesi et al. 2009) due to the lack of DBCRs. As shown in Fig. 6A, 0.5μM TBOA significantly inhibited the b-wave up to 45–48% in zone III and IV. A higher concentration 1mM TBOA extended the inhibition to zone II, in addition to zones III and IV. The fact that TBOA inhibited the b-wave in mice lacking DBCRs suggests that b-waves generated by DBCCs are suppressible by TBOA. Such inhibition can be mediated by a direct inhibition of postsynaptic EAAT5 on DBCcs, or by indirectly abolishing the glutamate buffering capacity of presynaptic EAATs and a resultant accumulation of synaptic glutamate. Since 0.5μM TBOA does not alter the buffering capacity for glutamate (as shown in section 3.3 of the companion paper), its inhibition of the b-wave in zone III and IV is best explained by the former mechanism. In contrast, inhibition of the b-wave in zone II was found only when a high concentration of TBOA was applied. This suggests that such inhibition was probably mediated by the latter mechanism. In light of the single cell dynamic range data (Fig 1B), TBOA could have directly inhibited the DBCCs driven by M-cones or M/S-cones, and indirectly inhibited the DBCCs driven by rods.
Figure 6.
(A) A line chart showing normalized b-wave amplitude for a range of increasing stimulus strength for bhlhb4−/− mice injected with 1mM TBOA (diamond, n=5) or saline (square, n=7). Data points and error bars represent mean and standard error. Dashed lines represent boundaries between the I, II, III and IV zones of stimulus strength. Mean values that are significantly different from that of the saline group were marked with asterisks. TBOA significantly inhibited the b-wave in all three zones to different extents depending on the injected concentration. Strongest inhibition was observed particularly in zone III. (B) Representative raw ERG traces measured from eyes 5 minutes after injecting with saline, 0.5 μM TBOA and 1 mM TBOA with a zone III stimulus of 2.3 log R*/Rod.
3.5 Additional inhibitory effect of TBOA over saturated dose of LAP4
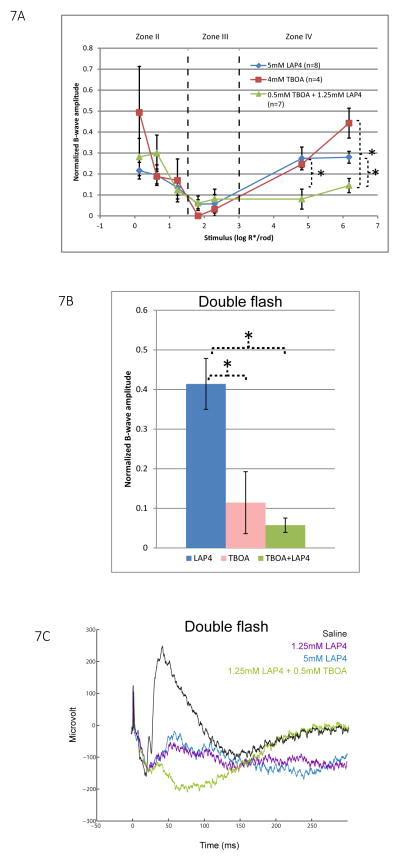
In Fig. 2, 5, and 6, we have shown that LAP4 or TBOA, when injected alone, inhibited the b-wave strongly in stimulus zone III, but partially in zone II and IV. We sought to test whether their inhibitory effects are additive by co-injecting them in wild type mice. ERG was then measured and compared to those of control mice injected with a saturating dose of either LAP4 or TBOA (5mM and 4mM respectively at the retina level). These concentrations are known to produce maximum possible inhibition of the b-wave as predicted by the dose-response curves constructed earlier as Fig. 2B and 5A.
As shown in Fig. 7A zone IV, the saturating concentration of 5mM LAP4 inhibited the mean b-wave amplitude by about 72%. Mice injected with a slightly lower concentration of 1.25mM LAP4 in the presence of 0.5mM co-injected TBOA produced a significantly stronger inhibition of 86–88% of the b-wave. This suggests that the inhibition exerted by LAP4 and TBOA, to a certain extent, are additive in this range of stimulus strength, where both the rod and cone pathways contribute to the ERG.
Figure 7.
(A) A line chart showing normalized b-wave amplitude for a range of increasing stimulus strength for wild type mice injected with saturating concentrations of LAP4 (n=7), TBOA (n=4), or a mixture of them (n=6). Data points and error bars represent mean and standard error, respectively. In stimulus zone II and III, all three groups showed inhibition of the b-wave and there is no significant difference between them. In zone IV, eyes co-injected with LAP4 and TBOA showed the smallest amplitude of b-wave, which is significantly smaller than that in eyes injected with either drug alone. (B) Isolated cone b-wave response measured using a double flash method for the same three groups of mice. Data again normalized to saline control. Saturated dose of LAP4 inhibited cone b-wave by 58% compared to that of saline control. TBOA, when injected alone, or when co-injected with LAP4 produced significantly stronger inhibition, resulting in residual mean b-wave amplitudes of 12% and 6% respectively. (C) Representative wave traces elicited by the second (probe) flash in the double flash ERG. Traces shown were eyes injected with saline, 1.25mM LAP4, 5 mM LAP4 or a mixture of LAP4 and TBOA. The two concentrations of LAP4 produced similar wave traces in which b-waves were partially inhibited. In eyes injected with the mixture of drugs, the b-wave was greatly diminished to become a small positive potential that failed to fully truncate the PIII, which manifested as a negative potential after the small b-wave.
The fact that the above additive nature takes place only in zone IV may suggest a specific role for TBOA in the cone pathway. To test this hypothesis, we repeated the above experiment using the same grouping of animals but measured them with the double flash ERG protocol to isolate the cone driven response from that of rods. In Fig. 7B, eyes injected with 5mM LAP4 have a mean residual b-wave amplitude of 42%. Eyes injected with TBOA or the mixture have mean residual b-wave amplitudes of 12% and 6%, respectively. In other words, TBOA, when injected alone or when co-injected produced significantly stronger inhibition of the b-wave than solely injected LAP4. Since multiple subtypes of DBCC and DBCR that directly receive input from cones are potentially contributing to the measured cone-driven b-wave, our result may indicate that some of the LAP4-insensitive DBCs were inhibited by TBOA. Representative raw ERG traces resulting from the second flash (probe flash) are shown in Fig 7C. The small residual b-wave following the application of LAP4 was abolished by co-injection of TBOA, revealing the late portion of the negative Granit PIII component (Granit 1933) otherwise truncated by the residual b-wave. Similar small residual b-waves in the photopic range were sometimes regarded as oscillatory potentials in some previous studies (Masu, Iwakabe et al. 1995), without considering that the late PIII component should have become visible if b-wave was fully suppressed, and that oscillatory potentials should have manifested as a higher frequency component.
In human, the OFF-bipolar cell (HBCc) pathway has been reported to constitute a significant component of the cone-dominated b-wave in single flash ERG (Fitzgerald, Cibis et al. 1994). Therefore, there is a possibility that the current TBOA inhibition on the mouse cone-driven ERG b-wave was mediated through a blockage of the mouse HBCc, via blockage of presynaptic EAATs and accumulation of endogenous glutamate in the photoreceptor-HBCc synapse. This hypothesis is refuted by the finding that the cone-driven ERG b-wave does not contain a significant HBCc component in mouse like it does in human. Blocking HBCCs using injected CNQX, a AMPA/KA receptor antagonist, produced only a minor inhibition and reduced the photopic b-wave to 90% of uninjected control (Smith, Tremblay et al. 2013). Our unpublished data using injected DNQX (another AMPA/KA receptor antagonist) have shown a similar extent of minor inhibition of the cone driven b-wave which was not different from that produced by injected saline.
3.6 Effects of co-injecting TBOA with GABA antagonists
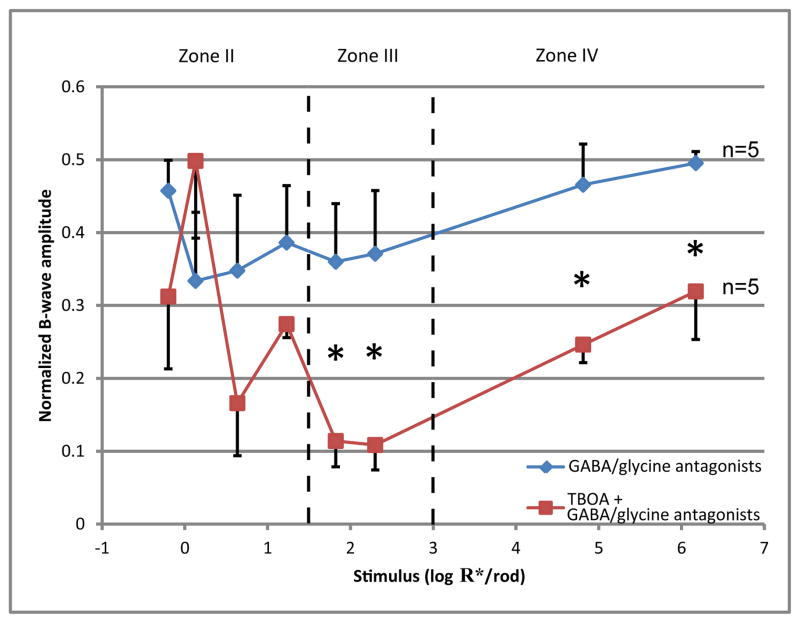
It has been reported that some gamma-aminobutyric acid (GABA)-ergic and glycinergic amacrine cells exert negative feedback on the axon terminals of bipolar cells (Tachibana and Kaneko 1987; Tachibana and Kaneko 1988; Eggers, McCall et al. 2007; Eggers and Lukasiewicz 2011), and that such feedback may shape, augment or suppress the ERG b-wave (Kapousta-Bruneau 2000; Awatramani, Wang et al. 2001; Dong and Hare 2002). To determine whether TBOA inhibited the ERG b-wave through the above GABA-ergic or glycinergic feedback mechanisms, a cocktail of GABA and glycine receptor antagonists was co-injected with TBOA into one eye of wild type mice to block the feedback before ERG was measured. Antagonists used were 1μM strychnine, 100μM bicuculline and 100μM TPMPA (calculated retinal concentrations).
As shown in Fig 8, blocking GABA-ergic and glycinergic feedback by injecting the antagonist cocktail partially inhibited the b-wave. Injecting TBOA in the presence of GABA/glycine antagonists produced stronger inhibition than injecting the antagonists alone. TBOA produced a similar pattern of inhibition regardless of whether it was injected alone (Fig 7A) or was co-injected with the antagonist cocktail (Fig. 8). These results indicate that the mechanism through which TBOA suppresses the b-wave does not rely on GABA-ergic or glycinergic negative feedbacks.
Figure 8.
A plot of normalized b-wave amplitude for a range of increasing stimulus strength for mice injected with a cocktail of GABA/glycine antagonists (n=5), and mice co-injected with 1mM TBOA and the same cocktail (n=5). Data points and error bars represent mean and standard error, respectively. Dashed lines represent boundaries between the II, III and IV zones of stimulus strength. Mice injected with GABA antagonist cocktail alone have the b-wave inhibited by 50–65%. Mice co-injected with the cocktail and TBOA have significantly lower b-wave than the other group in zone III and IV.
3.7 Immunohistochemistry
To unravel the anatomical basis for the TBOA sensitivity of ERG b-waves, a series of IHC experiments were performed to study the expression of EAAT5 in retina. EAAT5 staining was found to be present in the OPL as well as the ON and the OFF strata of the IPL. We focused the subsequent experiments on the OPL because the b-wave is generated by DBCs, and the OPL is where the DBCs receive synaptic inputs from primary neurons. It is known that the OPL contains processes from five types of neurons including rod axon terminals, cone axon terminals, DBCR dendrites, DBCC dendrites, and horizontal cell processes and their somas. Thus a combination of antibodies was used and advantage was taken of the bhlhb4 −/− mice that lack DBCRs.
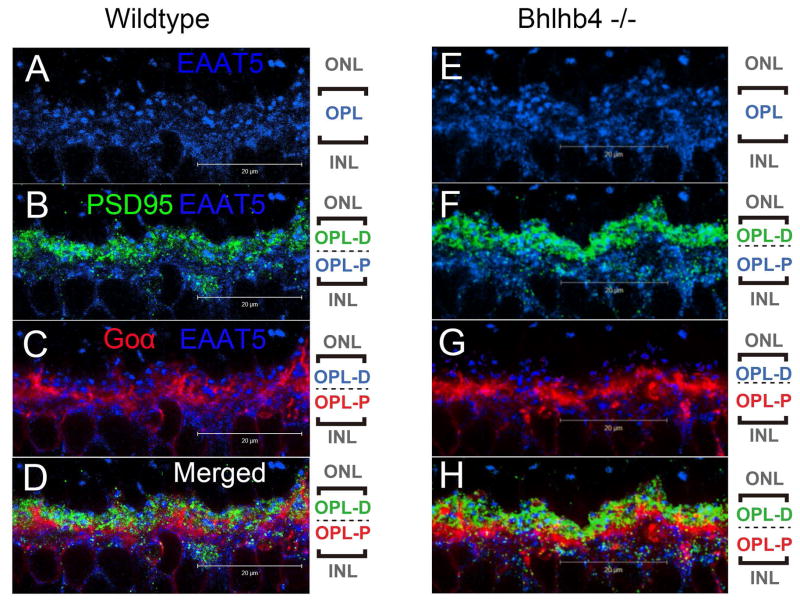
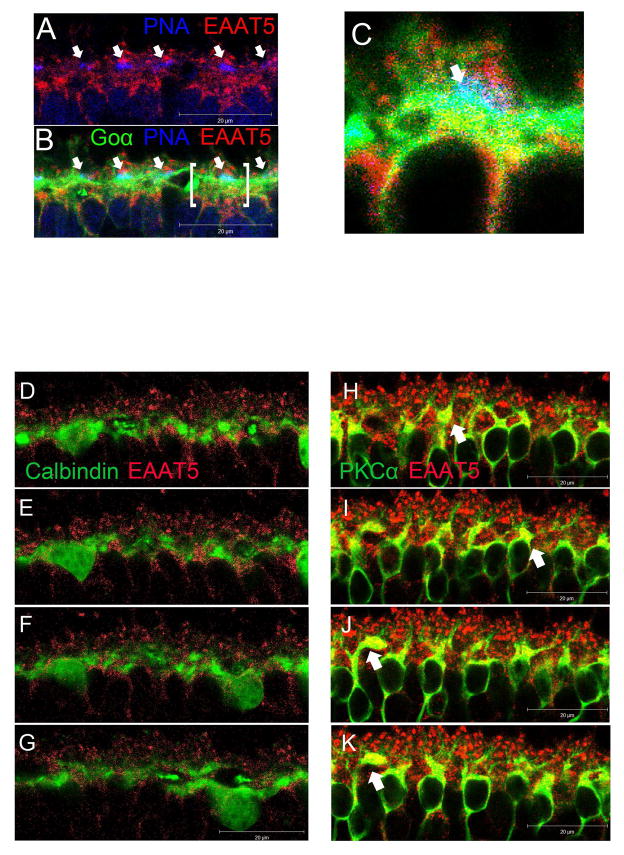
Fig. 9A shows that EAAT5 is present throughout the whole thickness of the OPL. Fig. 9B shows that EAAT5 is present on the rod spherules; and fig. 9C and 9D show that EAAT5 is present on the dendritic processes of DBCs (DBCR or DBCC) in wild type mice. Using the bhlhb4 −/− mice, it is shown that EAAT5 is also present throughout the entire OPL (Fig. 9E), on the rod spherules (Fig. 9F) and on the dendritic process of DBCCs(Fig. 9G and H). EAAT5 was not observed on the active zones of cone pedicles (Fig. 10A), but on the active zones of DBC dendrites synapsing with the pedicles (Fig. 10B, C). Horizontal cells appeared to be negative for EAAT5 (Fig. 10D–G). In contrast, some DBCRs in the wild type retina were found to express EAAT5 on their dendritic processes, at least extrajunctionally (Fig. 10H–K).
Figure 9.
(A–D) Confocal microscopic images of retina from wild-type mice processed for EAAT5 (blue), PSD95 (green), and Goα (red) immunofluorescence. The pictorial legends on the right denote the sub-stratification of the OPL into the distal (OPL-D) and the proximal (OPL-P) layers. (A) EAAT5 staining was found throughout the whole thickness of the OPL. (B) PSD95 staining was confined mostly to the distal half of the OPL where it co-localized with about half of the EAAT5 staining. This indicates the presence of EAAT5 on the rod spherules, and also on some postsynaptic structures. (C) Goα staining was observed intensely in the proximal half of the OPL where it overlapped nicely with the EAAT5 staining pattern not occupied by PSD95 staining. This indicates that EAAT5 is present on the dendritic processes and somas of some bipolar cells. (D) A three channel merged view of the above.
(E–H) Confocal microscopic images of retina from bhlhb4 −/− mice processed for EAAT5 (blue), PSD95 (green), Goα (red) immuno-fluorescence showing a segment of the OPL. (E) EAAT5 immuno-labeling was observed throughout the whole thickness of the OPL. (F) PSD95 staining co-localized with EAAT5 staining in the distal half while (G) Goα co-localized with EAAT5 in the proximal half region. Since bhlhb4 −/− mice lack DBCR, the Goα staining here is attributed to DBCC. (H) A merged image showing all three channels.
Figure 10.
(A–C) Confocal microscopic images of retina from wild-type mice processed for EAAT5 (red), PNA (blue), and Goα (green) immunofluorescence. (A) EAAT5 staining did not overlap with PNA staining but was present on the structure above it, suggesting that EAAT5 is not present on the active zones (arrows) of cone pedicles but is present extrajunctionally on the terminal. (B) Introducing the Goα green channel helped identify cone-bipolar synapses (arrows), one of which (bracketed) is further magnified in panel (C). (C) A bipolar cell (green) making a synapse with a cone pedicle labeled in blue. Red EAAT5 co-localized with the green Goα on the bipolar cell dendrites results in the yellowish patches immediately below the cone pedicle, suggesting that EAAT5 is present on the DBCC active zone postsynaptically.
(D–G) A z-axis image series showing consecutive optical sections (1μm apart) of wild type retina processed for Calbindin (green) and EAAT5 (Red) immunofluorescence. Calbindin staining showed minimal overlapping with that of EAAT5, implying that EAAT5 does not express on horizontal cells. (H–K) Similar image series from wild type retina processed for PKCα (green) and EAAT5 (Red) immunofluorescence. EAAT5 labeling co-localized with that of PKCα, resulting in yellow color on the dendritic processes of some DBCRs. Such EAAT5 immuno-labeling is stronger on some DBCRs (arrows) than others. It is difficult to determine whether the EAAT5 is present junctionally on the dendrites, which extended to the distant half of the OPL and invaginated the rod spherules.
4 DISCUSSION
In the present study, we took advantage of an infrared illuminated microinjection system to study the effect of TBOA and LAP4 on the ERG of dark-adapted mice. We found that TBOA and the glutamate analogue LAP4 shared a similar time course for inhibiting the ERG b-wave. The IC50 value for TBOA inhibition of the b-wave was found to be 23.4 μM (1.37 log μM), which is about 1 log unit higher than that of LAP4 in stimulus zone III. Our data also showed that the TBOA induced inhibition of b-waves in bhlhb4 −/− mice was most prominent in zones III and IV, where M-cones and M/S cones are actively driving DBCCs. More interestingly, the data suggested that TBOA associated inhibition and LAP4 associated inhibition were somewhat additive in the strongest stimulus zone IV, where the b-wave is comprised of a cone-driven response in addition to a rod-driven response. Additionally, TBOA alone, compared to LAP4, produced a stronger inhibition of the isolated cone-driven b-wave measured using a double flash protocol. Similar inhibition was not observed when EAAT1 or EAAT2 blockers were injected (as shown in section 3.2 of the companion paper). The above electrophysiological data suggest a significant role for EAAT5 in mediating cone-driven bipolar cell light responses, and perhaps a minor role in mediating rod-driven bipolar cell light responses.
By comparing with the effect of injecting GABA-ergic and glycinergic antagonists, we’ve shown that TBOA mediated inhibition of the b-wave uses a mechanism different from the negative feedback from amacrine cells. Our IHC data indicated the presence of postsynaptic EAAT5 on some DBCCs, and probably on some DBCRs, providing a possible anatomical basis for its role on the b-wave.
4.1 EAAT5 in other species
Apart from those lower vertebrates reviewed earlier, EAAT5 has been found in retinae of several mammals, mostly located presynaptically. It has been reported on the terminals of rods, DBCCs and DBCRs in rat (Pow and Barnett 2000), rods and DBCCs in cat (Fyk-Kolodziej, Qin et al. 2004), rods in rabbit and macaque (Pow, Barnett et al. 2000), and terminals of rods, cones, DBCRs and HBCs in mouse (Hasegawa, Obara et al. 2006; Wersinger, Schwab et al. 2006; Cheng, Djajadi et al. 2012).
Using IHC double labeling, the present study confirms the single labeling morphology-based observation of an earlier study that EAAT5 is present on mouse rod spherules, but suggested that its presence on mouse cone pedicles is not junctional but extrajunctional.
The present study is the first to report postsynaptic EAAT5 on mice DBCCs and some DBCRs. Wersinger et al (2006) detected a small TBOA-sensitive current when glutamate was puffed on DBCR dendrites and did not study it further. Hasegawa et al (2006), however, did not find such a current in their similar experiment on DBCRs. Since our IHC result indicates that some DBCRs express more EAAT5 than others on their dendritic processes, this may be one of the reasons why previous studies have had limited success in detecting them with a small sample size. Another possibility could be that the invaginated shape of the rod-DBCR synapse acted as a diffusion barrier for the puffed glutamate and prevented it from reaching postsynaptic EAAT5 on the DBCR in a timely manner.
4.2 Possible mechanism of light response mediated by EAAT5
In darkness, endogenous GLU is continuously released from photoreceptor terminals, resulting in a high concentration of GLU in the synaptic cleft. The extracellular GLU binds to mGluR6 on DBCs and closes the gated cation channel, which contributes to the tonic hyperpolarization in DBCs. The extracellular GLU also binds to EAAT5 and opens the chloride channel (Grant and Dowling 1995), which allows Cl− to enter the cell down its concentration gradient and also contributes to tonic hyperpolarization in DBCs. Exposure to light stops endogenous GLU release and reverses the above processes, causing the DBC to depolarize. The swift change from a hyperpolarized state to a depolarized state in DBCs causes a corneal-positive potential, truncating the corneal-negative a-wave and manifests as the b-wave.
Exogenously applied GLU analogue LAP4 keeps the mGluR6 occupied regardless of light, precluding the cation channel from opening and the DBC from depolarizing, thus effectively inhibiting the light response.
It is not surprising that injected TBOA above a certain concentration would block pre-synaptic EAATs or EAAT1 on the Müller cells, leading to an accumulation of GLU in the synaptic cleft and subsequently inhibit the b-wave in a way similar to that when exogenous GLU is injected. We’ve studied this phenomenon in our companion paper and found that TBOA inhibited the b-wave at a low concentration (0.5 μM) at which the GLU buffering/removing capacity of pre-synaptic/Müller EAATs was unaffected (no effect on the GLU dose-response curve). Given that the same 0.5μM concentration of TBOA significantly inhibited the residual b-wave in Bhlhb4 KO mice (Fig. 6B), it is indicated that TBOA at low concentration inhibits the b-wave by acting on the postsynaptic EAAT5 instead of presynaptic/Müller EAATs.
In darkness, GLU opens EAAT5 coupled Cl− channels on DBC dendrites resulting in an influx of Cl− that hyperpolarizes DBCs. Light closes the Cl− channels, suppresses Cl− influx and depolarizes DBCs. We propose that TBOA blocks the EAAT5-coupled Cl− channels in darkness, abolishes their contribution to the hyperpolarized state of the cell, and suppresses light-induced depolarization. Such a mechanism takes place at a low TBOA concentration, without significantly affecting the re-uptake process of synaptic GLU by presynaptic EAATs.
4.3 Possible physiological function
Traditionally, the transporter function of EAAT5 has received more attention than its ligand gated channel function (Sonders and Amara 1996). More recently, multiple splice variants of EAAT5 have been reported and it is predicted that some of those EAAT5 isoforms possess one of the above functions while some possess the other (Lee, Anderson et al. 2012). There are multiple subtypes of DBCC and DBCR as classified by their morphology and photoreceptor input (Ghosh, Bujan et al. 2004; Pang, Gao et al. 2010) in mouse. It is yet to be elucidated which DBC subtypes adopt the mGluR6 mechanism, the EAAT5 mechanism or a combination of them. Our IHC data has shown that the EAAT5 machinery is present on the dendritic processes of some DBCCs and DBCRs. Performing single cell recording from individual DBCs one by one will be a challenging task. The current ERG study has provided tools to screen for the functional EAAT5 mechanism, provided resolving power to dissect the underlying rod/cone pathway and is an important step for future studies. In light of our data, it is likely that EAAT5 plays a role in mediating ON-light responses of some DBCs driven by cones. Other DBCs may either possess only the mGluR6 machinery, or possess both mGluR6 and EAAT5 machineries but have their light response dominated by the mGluR6 mechanism.
It remains unclear why the retina needs two different signaling mechanisms for the On-light response of DBCs. Intuitively, the two mechanisms may coexist as some form of parallel processing. Their differences in sensitivity, dynamics or operating range may also enable them to serve different functions, in a manner similar to the differential roles of NMDA, AMPA and kainate ionotropic receptors that coexist on dendrites of some neurons. The EAAT5 mechanism may also provide some resiliency to retinal signal processing by acting as a backup and limit the degradation of visual functions when the mGluR6 mechanism fails, as exemplified by the cases of human mGluR6-deficient night blindness (Dryja, McGee et al. 2005).
Another possible physiological function of EAAT5 on DBCs is importing Cl− at DBC dendrites and maintaining a high dendritic [Cl−]. A high dendritic [Cl−], which makes the chloride reversal potential Ecl> resting potential ER, is postulated to be critical for horizontal cells to depolarize DBCs through GABA (Miller and Dacheux 1983; Vardi and Sterling 1994). Recent work using two-photon imaging has proved the existence of a higher dendritic [Cl−] over somatic [Cl−] in DBCs, and shown that this gradient was largely preserved after the application of blockers for Na-K-Cl cotransporter (NKCC) and K-Cl co-transporter (KCC) (Duebel, Haverkamp et al. 2006). This suggests that the remaining [Cl−] gradient requires an additional transport system, which is not NKCC (Zhang, Delpire et al. 2007) but could potentially be the EAAT5 chloride channels on DBC dendrites.
4.4 Conclusion
The present study has provided electrophysiological evidencse that suggest a significant role for EAAT5 in mediating cone-driven bipolar cell light responses, and perhaps a peripheral role in mediating rod-driven bipolar cell light responses. Our IHC data indicated the presence of postsynaptic EAAT5 on some DBCCs, and probably on some DBCRs. These provides an anatomical basis for its role on the ERG b-wave and probably on the maintenance of a high chloride concentration at DBCs dendrites.
Highlights.
EAAT5 mediates light response in the mouse cone-driven depolarizing bipolar cells.
Such response contributes to the ERG b-wave under certain photopic condition.
EAAT5 is present junctionally on some cone depolarizing bipolar cells dendrites.
EAAT5 is present extra-junctionally on some rod bipolar cells dendrites.
Acknowledgments
GRANTS
This work was supported by NIH EY004446 & EY019908, NIH Vision Core EY02520, the Retina Research Foundation(Houston), Research to Prevent Blindness Inc, and the International Retinal Research Foundation Loris and David Rich Postdoctoral Scholar Award.
We thank J.J. Pang and I. Fahrenfort for suggestions and comments, Z. Yang for technical support, R Jacoby for carefully reading manuscript and helpful comments.
Abbreviations
- ERG
electroretinogram
- BC
bipolar cell
- EAAT
excitatory amino-acid transporter
- GLU
glutamate
- LAP4
L-(+)-2-amino-4-phosphonobutyric acid
- TBOA
DL-threo-β-benzyloxyaspartic acid
- ONL
outer nuclear layer
- OPL
outer plexiform layer
- INL
inner nuclear layer
- IPL
inner plexiform layer
- IC50
half maximal inhibitory concentration
- EC50
half maximal effective concentration
- DBCR
rod depolarizing bipolar cell
- DBCC
cone depolarizing bipolar cell
- AIIAC
AII amacrine cell
- IHC
immunohistochemistry
Footnotes
DISCLOSURES
No conflicts of interest, financial or otherwise, are declared by the authors.
AUTHOR CONTRIBUTIONS
D.Y.T and I.C. participated in designing the experiment, collecting and analyzing the data, and writing the article. S.M.W. was involved in designing the experiment, interpreting the data, and writing the article.
Publisher's Disclaimer: This is a PDF file of an unedited manuscript that has been accepted for publication. As a service to our customers we are providing this early version of the manuscript. The manuscript will undergo copyediting, typesetting, and review of the resulting proof before it is published in its final citable form. Please note that during the production process errors may be discovered which could affect the content, and all legal disclaimers that apply to the journal pertain.
References
- Abd-El-Barr MM, Pennesi ME, et al. Genetic dissection of rod and cone pathways in the dark-adapted mouse retina. Journal of neurophysiology. 2009;102(3):1945–1955. doi: 10.1152/jn.00142.2009. [DOI] [PMC free article] [PubMed] [Google Scholar]
- Applebury ML, Antoch MP, et al. The murine cone photoreceptor: a single cone type expresses both S and M opsins with retinal spatial patterning. Neuron. 2000;27(3):513–523. doi: 10.1016/s0896-6273(00)00062-3. [DOI] [PubMed] [Google Scholar]
- Arriza JL, Eliasof S, et al. Excitatory amino acid transporter 5, a retinal glutamate transporter coupled to a chloride conductance. Proceedings of the National Academy of Sciences of the United States of America. 1997;94(8):4155–4160. doi: 10.1073/pnas.94.8.4155. [DOI] [PMC free article] [PubMed] [Google Scholar]
- Attwell D. The photoreceptor output synapse. In: Osborne N, Chader G, editors. Progress in Retinal Research. Oxford: Pergamon Press; 1990. p. 9. [Google Scholar]
- Awatramani G, Wang J, et al. Amacrine and ganglion cell contributions to the electroretinogram in amphibian retina. Visual neuroscience. 2001;18(1):147–156. doi: 10.1017/s0952523801181149. [DOI] [PubMed] [Google Scholar]
- Blanks JC, Johnson LV. Selective lectin binding of the developing mouse retina. The Journal of comparative neurology. 1983;221(1):31–41. doi: 10.1002/cne.902210103. [DOI] [PubMed] [Google Scholar]
- Bramblett DE, Pennesi ME, et al. The transcription factor Bhlhb4 is required for rod bipolar cell maturation. Neuron. 2004;43(6):779–793. doi: 10.1016/j.neuron.2004.08.032. [DOI] [PubMed] [Google Scholar]
- Cervetto L, MacNichol EF., Jr Inactivation of horizontal cells in turtle retina by glutamate and aspartate. Science. 1972;178(4062):767–768. doi: 10.1126/science.178.4062.767. [DOI] [PubMed] [Google Scholar]
- Cheng CL, Djajadi H, et al. Cell-Specific Markers for the Identification of Retinal Cells by Immunofluorescence Microscopy #. T Retinal Degeneration. 2012;935:185–199. doi: 10.1007/978-1-62703-080-9_12. [DOI] [PubMed] [Google Scholar]
- Copenhagen DR, Jahr CE. Release of endogenous excitatory amino acids from turtle photoreceptors. Nature. 1989;341(6242):536–539. doi: 10.1038/341536a0. [DOI] [PubMed] [Google Scholar]
- Danbolt NC. Glutamate uptake. Progress in neurobiology. 2001;65(1):1–105. doi: 10.1016/s0301-0082(00)00067-8. [DOI] [PubMed] [Google Scholar]
- de Melo J, Qiu X, et al. Dlx1, Dlx2, Pax6, Brn3b, and Chx10 homeobox gene expression defines the retinal ganglion and inner nuclear layers of the developing and adult mouse retina. The Journal of comparative neurology. 2003;461(2):187–204. doi: 10.1002/cne.10674. [DOI] [PubMed] [Google Scholar]
- Dong CJ, Hare WA. GABAc feedback pathway modulates the amplitude and kinetics of ERG b-wave in a mammalian retina in vivo. Vision research. 2002;42(9):1081–1087. doi: 10.1016/s0042-6989(02)00032-9. [DOI] [PubMed] [Google Scholar]
- Dryja TP, McGee TL, et al. Night blindness and abnormal cone electroretinogram ON responses in patients with mutations in the GRM6 gene encoding mGluR6. Proceedings of the National Academy of Sciences of the United States of America. 2005;102(13):4884–4889. doi: 10.1073/pnas.0501233102. [DOI] [PMC free article] [PubMed] [Google Scholar]
- Duebel J, Haverkamp S, et al. Two-photon imaging reveals somatodendritic chloride gradient in retinal ON-type bipolar cells expressing the biosensor Clomeleon. Neuron. 2006;49(1):81–94. doi: 10.1016/j.neuron.2005.10.035. [DOI] [PubMed] [Google Scholar]
- Eggers ED, Lukasiewicz PD. Multiple pathways of inhibition shape bipolar cell responses in the retina. Visual neuroscience. 2011;28(1):95–108. doi: 10.1017/S0952523810000209. [DOI] [PMC free article] [PubMed] [Google Scholar]
- Eggers ED, McCall MA, et al. Presynaptic inhibition differentially shapes transmission in distinct circuits in the mouse retina. The Journal of physiology. 2007;582(Pt 2):569–582. doi: 10.1113/jphysiol.2007.131763. [DOI] [PMC free article] [PubMed] [Google Scholar]
- Field GD, Rieke F. Nonlinear signal transfer from mouse rods to bipolar cells and implications for visual sensitivity. Neuron. 2002;34(5):773–785. doi: 10.1016/s0896-6273(02)00700-6. [DOI] [PubMed] [Google Scholar]
- Fitzgerald KM, Cibis GW, et al. Retinal signal transmission in Duchenne muscular dystrophy: evidence for dysfunction in the photoreceptor/depolarizing bipolar cell pathway. The Journal of clinical investigation. 1994;93(6):2425–2430. doi: 10.1172/JCI117250. [DOI] [PMC free article] [PubMed] [Google Scholar]
- Fyk-Kolodziej B, Qin P, et al. Differential cellular and subcellular distribution of glutamate transporters in the cat retina. Visual neuroscience. 2004;21(4):551–565. doi: 10.1017/S0952523804214067. [DOI] [PubMed] [Google Scholar]
- Ghosh KK, Bujan S, et al. Types of bipolar cells in the mouse retina. The Journal of comparative neurology. 2004;469(1):70–82. doi: 10.1002/cne.10985. [DOI] [PubMed] [Google Scholar]
- Granit R. The components of the retinal action potential in mammals and their relation to the discharge in the optic nerve. The Journal of physiology. 1933;77(3):207–239. doi: 10.1113/jphysiol.1933.sp002964. [DOI] [PMC free article] [PubMed] [Google Scholar]
- Grant GB, Dowling JE. A glutamate-activated chloride current in cone-driven ON bipolar cells of the white perch retina. The Journal of neuroscience : the official journal of the Society for Neuroscience. 1995;15(5 Pt 2):3852–3862. doi: 10.1523/JNEUROSCI.15-05-03852.1995. [DOI] [PMC free article] [PubMed] [Google Scholar]
- Grant GB, Dowling JE. On bipolar cell responses in the teleost retina are generated by two distinct mechanisms. Journal of neurophysiology. 1996;76(6):3842–3849. doi: 10.1152/jn.1996.76.6.3842. [DOI] [PubMed] [Google Scholar]
- Grant GB, Werblin FS. A glutamate-elicited chloride current with transporter-like properties in rod photoreceptors of the tiger salamander. Visual neuroscience. 1996;13(1):135–144. doi: 10.1017/s0952523800007185. [DOI] [PubMed] [Google Scholar]
- Hasegawa J, Obara T, et al. High-density presynaptic transporters are required for glutamate removal from the first visual synapse. Neuron. 2006;50(1):63–74. doi: 10.1016/j.neuron.2006.02.022. [DOI] [PubMed] [Google Scholar]
- Haverkamp S, Wassle H. Immunocytochemical analysis of the mouse retina. The Journal of comparative neurology. 2000;424(1):1–23. [PubMed] [Google Scholar]
- Kapousta-Bruneau NV. Opposite effects of GABA(A) and GABA(C) receptor antagonists on the b-wave of ERG recorded from the isolated rat retina. Vision research. 2000;40(13):1653–1665. doi: 10.1016/s0042-6989(00)00028-6. [DOI] [PubMed] [Google Scholar]
- Lee A, Anderson AR, et al. Alternate splicing and expression of the glutamate transporter EAAT5 in the rat retina. Gene. 2012;506(2):283–288. doi: 10.1016/j.gene.2012.07.010. [DOI] [PubMed] [Google Scholar]
- Lyubarsky AL, Daniele LL, et al. From candelas to photoisomerizations in the mouse eye by rhodopsin bleaching in situ and the light-rearing dependence of the major components of the mouse ERG. Vision research. 2004;44(28):3235–3251. doi: 10.1016/j.visres.2004.09.019. [DOI] [PubMed] [Google Scholar]
- Massey SC. Cell types using glutamate as a neurotransmitter in the vertebrate retina. In: Osborne N, Chader G, editors. Progress in Retinal Research. Oxford: Pergamon Press; 1990. p. 9. [Google Scholar]
- Massey SC, Redburn DA. Transmitter circuits in the vertebrate retina. Progress in neurobiology. 1987;28(1):55–96. doi: 10.1016/0301-0082(87)90005-0. [DOI] [PubMed] [Google Scholar]
- Masu M, Iwakabe H, et al. Specific deficit of the ON response in visual transmission by targeted disruption of the mGluR6 gene. Cell. 1995;80(5):757–765. doi: 10.1016/0092-8674(95)90354-2. [DOI] [PubMed] [Google Scholar]
- Miller RF, Dacheux RF. Intracellular chloride in retinal neurons: measurement and meaning. Vision research. 1983;23(4):399–411. doi: 10.1016/0042-6989(83)90087-1. [DOI] [PubMed] [Google Scholar]
- Murakami M, Otsuka T, et al. Effects of aspartate and glutamate on the bipolar cells in the carp retina. Vision research. 1975;15(3):456–458. doi: 10.1016/0042-6989(75)90101-7. [DOI] [PubMed] [Google Scholar]
- Nakajima Y, Iwakabe H, et al. Molecular characterization of a novel retinal metabotropic glutamate receptor mGluR6 with a high agonist selectivity for L-2-amino-4-phosphonobutyrate. The Journal of biological chemistry. 1993;268(16):11868–11873. [PubMed] [Google Scholar]
- Nelson RF, Singla N. A spectral model for signal elements isolated from zebrafish photopic electroretinogram. Visual neuroscience. 2009;26(4):349–363. doi: 10.1017/S0952523809990113. [DOI] [PMC free article] [PubMed] [Google Scholar]
- Nikonov SS, Kholodenko R, et al. Physiological features of the S- and M-cone photoreceptors of wild-type mice from single-cell recordings. The Journal of general physiology. 2006;127(4):359–374. doi: 10.1085/jgp.200609490. [DOI] [PMC free article] [PubMed] [Google Scholar]
- Oh EC, Khan N, et al. Transformation of cone precursors to functional rod photoreceptors by bZIP transcription factor NRL. Proceedings of the National Academy of Sciences of the United States of America. 2007;104(5):1679–1684. doi: 10.1073/pnas.0605934104. [DOI] [PMC free article] [PubMed] [Google Scholar]
- Pang JJ, Gao F, et al. Direct rod input to cone BCs and direct cone input to rod BCs challenge the traditional view of mammalian BC circuitry. Proceedings of the National Academy of Sciences of the United States of America. 2010;107(1):395–400. doi: 10.1073/pnas.0907178107. [DOI] [PMC free article] [PubMed] [Google Scholar]
- Pang JJ, Gao F, et al. Light-evoked current responses in rod bipolar cells, cone depolarizing bipolar cells and AII amacrine cells in dark-adapted mouse retina. The Journal of physiology. 2004;558(Pt 3):897–912. doi: 10.1113/jphysiol.2003.059543. [DOI] [PMC free article] [PubMed] [Google Scholar]
- Pow DV, Barnett NL. Developmental expression of excitatory amino acid transporter 5: a photoreceptor and bipolar cell glutamate transporter in rat retina. Neuroscience letters. 2000;280(1):21–24. doi: 10.1016/s0304-3940(99)00988-x. [DOI] [PubMed] [Google Scholar]
- Pow DV, Barnett NL, et al. Are neuronal transporters relevant in retinal glutamate homeostasis? Neurochemistry international. 2000;37(2–3):191–198. doi: 10.1016/s0197-0186(00)00022-x. [DOI] [PubMed] [Google Scholar]
- Sarantis M, Everett K, et al. A presynaptic action of glutamate at the cone output synapse. Nature. 1988;332(6163):451–453. doi: 10.1038/332451a0. [DOI] [PubMed] [Google Scholar]
- Saszik SM, Robson JG, et al. The scotopic threshold response of the dark-adapted electroretinogram of the mouse. The Journal of physiology. 2002;543(Pt 3):899–916. doi: 10.1113/jphysiol.2002.019703. [DOI] [PMC free article] [PubMed] [Google Scholar]
- Shigeri Y, Seal RP, et al. Molecular pharmacology of glutamate transporters, EAATs and VGLUTs. Brain research Brain research reviews. 2004;45(3):250–265. doi: 10.1016/j.brainresrev.2004.04.004. [DOI] [PubMed] [Google Scholar]
- Smith BJ, Tremblay F, et al. Voltage-gated sodium channels contribute to the b-wave of the rodent electroretinogram by mediating input to rod bipolar cell GABA receptors. Experimental eye research. 2013 doi: 10.1016/j.exer.2013.09.006. [DOI] [PubMed] [Google Scholar]
- Sonders MS, Amara SG. Channels in transporters. Current opinion in neurobiology. 1996;6(3):294–302. doi: 10.1016/s0959-4388(96)80111-5. [DOI] [PubMed] [Google Scholar]
- Szmajda BA, Devries SH. Glutamate spillover between mammalian cone photoreceptors. The Journal of neuroscience : the official journal of the Society for Neuroscience. 2011;31(38):13431–13441. doi: 10.1523/JNEUROSCI.2105-11.2011. [DOI] [PMC free article] [PubMed] [Google Scholar]
- Tachibana M, Kaneko A. gamma-Aminobutyric acid exerts a local inhibitory action on the axon terminal of bipolar cells: evidence for negative feedback from amacrine cells. Proceedings of the National Academy of Sciences of the United States of America. 1987;84(10):3501–3505. doi: 10.1073/pnas.84.10.3501. [DOI] [PMC free article] [PubMed] [Google Scholar]
- Tachibana M, Kaneko A. L-glutamate-induced depolarization in solitary photoreceptors: a process that may contribute to the interaction between photoreceptors in situ. Proceedings of the National Academy of Sciences of the United States of America. 1988;85(14):5315–5319. doi: 10.1073/pnas.85.14.5315. [DOI] [PMC free article] [PubMed] [Google Scholar]
- Tachibana M, Kaneko A. Retinal bipolar cells receive negative feedback input from GABAergic amacrine cells. Visual neuroscience. 1988;1(3):297–305. doi: 10.1017/s0952523800001954. [DOI] [PubMed] [Google Scholar]
- Vardi N, Sterling P. Subcellular localization of GABAA receptor on bipolar cells in macaque and human retina. Vision research. 1994;34(10):1235–1246. doi: 10.1016/0042-6989(94)90198-8. [DOI] [PubMed] [Google Scholar]
- Wadiche JI, Amara SG, et al. Ion fluxes associated with excitatory amino acid transport. Neuron. 1995;15(3):721–728. doi: 10.1016/0896-6273(95)90159-0. [DOI] [PubMed] [Google Scholar]
- Wersinger E, Schwab Y, et al. The glutamate transporter EAAT5 works as a presynaptic receptor in mouse rod bipolar cells. The Journal of physiology. 2006;577(Pt 1):221–234. doi: 10.1113/jphysiol.2006.118281. [DOI] [PMC free article] [PubMed] [Google Scholar]
- Wong KY, Adolph AR, et al. Retinal bipolar cell input mechanisms in giant danio. I. Electroretinographic analysis. Journal of neurophysiology. 2005;93(1):84–93. doi: 10.1152/jn.00259.2004. [DOI] [PubMed] [Google Scholar]
- Wong KY, Cohen ED, et al. Retinal bipolar cell input mechanisms in giant danio. II. Patch-clamp analysis of on bipolar cells. Journal of neurophysiology. 2005;93(1):94–107. doi: 10.1152/jn.00270.2004. [DOI] [PubMed] [Google Scholar]
- Zhang J, Yang Z, et al. Development of cholinergic amacrine cells is visual activity-dependent in the postnatal mouse retina. The Journal of comparative neurology. 2005;484(3):331–343. doi: 10.1002/cne.20470. [DOI] [PubMed] [Google Scholar]
- Zhang LL, Delpire E, et al. NKCC1 does not accumulate chloride in developing retinal neurons. Journal of neurophysiology. 2007;98(1):266–277. doi: 10.1152/jn.00288.2007. [DOI] [PubMed] [Google Scholar]


