

Abstract
Background & Aims
Patients with cirrhosis develop abnormal hematologic indices (HI) from multiple factors, including hypersplenism. We aimed to analyze the sequence of events and determine whether abnormal HI has prognostic significance.
Methods
We analyzed a database of 213 subjects with compensated cirrhosis without esophageal varices. Subjects were followed for approximately 9 years until the development of varices or variceal bleeding or completion of the study; 84 subjects developed varices. Abnormal HI was defined as anemia at baseline (hemoglobin, ≤13.5 g/dL for men and 11.5 g/dL for women), leukopenia (white blood cell counts, ≤4000/mm3), or thrombocytopenia (platelet counts, ≤150,000/mm3). The primary end points were death or transplant surgery.
Results
Most subjects had thrombocytopenia at baseline. Kaplan–Meier analysis showed that leukopenia occurred by 30 months (95% confidence interval, 18.5–53.6), and anemia occurred by 39.6 months (95% confidence interval, 24.1–49.9). Baseline thrombocytopenia (P = .0191) and leukopenia (P = .0383) were predictors of death or transplant, after adjusting for baseline hepatic venous pressure gradient (HVPG), and Child–Pugh scores. After a median of 5 years, a significant difference in death or transplant, mortality, and clinical decompensation was observed in patients who had leukopenia combined with thrombocytopenia at baseline compared with patients with normal HI (P < .0001). HVPG correlated with hemoglobin and white blood cell count (hemoglobin, r = −0.35, P < .0001; white blood cell count, r = −0.31, P < .0001).
Conclusions
Thrombocytopenia is the most common and first abnormal HI to occur in patients with cirrhosis, followed by leukopenia and anemia. A combination of leukopenia and thrombocytopenia at baseline predicted increased morbidity and mortality.
Hematologic indices (HI) are frequently abnormal in patients with cirrhosis. Studies examining the occurrence of abnormal HI have reported a prevalence of anemia, thrombocytopenia, and leukopenia (alone or in combination) in between 6% and 77% of patients with cirrhosis.1–9 Most studies have evaluated HI in a cross-sectional manner, and the sequential development of anemia, leukopenia, and thrombocytopenia is not known. The pathogenesis is multifactorial, with splenic and splanchnic sequestration, bone marrow suppression, and alterations in hematopoietic stimulating factors contributing to the etiology.10,11
Liangpunsukul et al12 found that spontaneous bacterial peritonitis, variceal hemorrhage, and death were more likely to occur in patients with severe hypersplenism (defined as platelet count <75,000 per mm3 and/or white blood cell count <2,000 per mm3 in the presence of splenomegaly). The median survival was also reduced in subjects with severe hypersplenism. The authors concluded that severe hypersplenism in patients with cirrhosis might constitute an indicator for prophylactic measures. Other studies have shown that thrombocytopenia is associated with a reduced median survival in compensated cirrhosis.13–16 The clinical significance of leukopenia and anemia in compensated cirrhosis needs further elucidation.
A prospective, randomized controlled trial evaluating the efficacy of treatment with nonselective beta-blockers in patients with compensated cirrhosis has been previously published.17 With this database, we have previously shown that thrombocytopenia significantly correlates with increased hepatic venous pressure gradient (HVPG). In the current study we wanted to determine the sequence of abnormal HI in cirrhosis and whether the presence of abnormal HI in patients with compensated cirrhosis with portal hypertension has prognostic significance in longitudinal follow-up.
Methods
The study was a nested cohort study in the setting of an investigator-initiated, prospective, randomized, double-blind, placebo-controlled clinical trial to evaluate the efficacy of non- selective beta-blockers in preventing gastroesophageal varices (GEV) and the usefulness of sequential measurements of HVPG, a measure of portal pressure. The complete description of the methodology has been published elsewhere.17 The protocol to conduct secondary analysis was approved by the institutional review board.
Patients
Patients were enrolled between August 1993 and March 1999 and followed until September 2002. Eligible patients had cirrhosis and portal hypertension as defined by an HVPG at least 6 mm Hg, did not have GEV, and were older than 18 years and younger than 75 years of age. Exclusion criteria included ascites requiring diuretics, hepatocellular carcinoma, splenic or portal vein thrombosis, concurrent illness expected to decrease life expectancy to less than 1 year, the use of any drug or procedure affecting the splanchnic hemodynamics or portal pressure, primary biliary cirrhosis or primary sclerosing cholangitis, contraindications to beta-blocker therapy, pregnancy, or alcohol intake during the dose titration phase. A total of 213 patients were enrolled into the study. The mean Child–Pugh score was between 5 and 6, and the median follow-up was 54.9 months. Demographic details have been previously published.17
Follow-up
Patients were assessed at baseline, 1 month and 3 months after randomization, and every 3 months thereafter. At each visit, the heart rate and alcohol consumption were determined, and blood was obtained for hematologic and biochemical measurement. At baseline and every year thereafter, esophagogastroduodenoscopy and HVPG were performed. Primary end point was the development of varices or variceal hemorrhage. Follow-up ended at the time of development of a primary end point; otherwise, patients were followed to the termination of the study in September 2002. Prognostic outcomes were assessed by collecting all data about death, transplant, hepatocellular carcinoma, or clinical decompensation that had been prospectively collected in the randomized control trial, except in patients who developed the primary end point of that trial. Retrospective review of charts of these patients was performed to have complete follow-up about death, transplant, or clinical decompensation until the end of the study (September 2002). Clinical decompensation was defined as the occurrence of variceal hemorrhage, ascites, and hepatic encephalopathy.
Definition and Creation of Hematologic Indices Groups
Abnormal HI was defined as the baseline occurrence of anemia (hemoglobin [Hgb], ≤13.5 g/dL for men and 11.5 g/dL for women), leukopenia (white blood cell count [WBC], ≤4,000/mm3), or thrombocytopenia (platelet count, ≤150,000/mm3). These values were based on previous studies evaluating the incidence and prevalence of abnormal HI in cirrhosis and the Centers for Disease Control and Prevention recommendations.1,3,18,19
Subjects were grouped according to the presence of thrombocytopenia, leukopenia, and/or anemia present at the baseline examination.
Statistical Analysis
The median time to each HI event obtained from Kaplan–Meier analysis was reported with 95% confidence intervals [CIs]. The Kaplan–Meier methods with log-rank test and Cox proportional hazards model were used to assess survival and hazard functions among the HI groups. The primary event of interest was death or liver transplant before September 26, 2002. The secondary events of interest were death without liver transplant, hepatocellular carcinoma, and clinical decompensation before September 26, 2002. Chi-square or Fisher tests were used to evaluate the associations between HI groups and variables such as baseline HVPG status, clinical decompensation, and liver-related death. Spearman correlation coefficients were used for the association between the HVPG and Hgb and WBC at baseline. One-way analysis of variance was used to compare the HVPG means of different HI groups. The post hoc pairwise comparisons were made by using Tukey studentized test. All calculations were performed by using the SAS statistical software package v 9.1 (SAS Institute Inc, Cary, NC).
Results
Occurrence of Abnormal Hematologic Indices
Table 1 lists the occurrence of thrombocytopenia, anemia, or leukopenia at baseline in the cohort. Most subjects had thrombocytopenia at baseline. Table 2 lists the different abnormal HI combinations. Once again, thrombocytopenia only was the most common abnormality at baseline.
Table 1. Occurrence of Anemia, Leukopenia, or Thrombocytopenia at Baseline Among the 213 Subjects.
| HI abnormality | Number (%) |
|---|---|
| Anemia | 45 (21.1) |
| Leukopenia | 50 (23.5) |
| Thrombocytopenia | 166 (77.9) |
Table 2. Occurrence of Various Combinations of HI Abnormalities at Baseline in the Entire Cohort (213 Subjects).
| HI abnormality group | Number (%) |
|---|---|
| Normal | 34 (15.9) |
| Anemia only | 10 (4.7) |
| Leukopenia only | 2 (0.9) |
| Anemia and leukopenia | 1 (0.5) |
| Thrombocytopenia only | 99 (46.5) |
| Anemia and thrombocytopenia | 20 (9.4) |
| Thrombocytopenia and leukopenia | 33 (15.5) |
| Thrombocytopenia, leukopenia, and anemia | 14 (6.6) |
One hundred ninety-seven subjects had thrombocytopenia, of which 84% had it present at baseline, and 16% developed it during the course of the study. Anemia was present in 126 subjects during the study, among which 37% had it at baseline, whereas 63% developed it during the course of the study. One hundred eighteen subjects had leukopenia, of which 42% had it at baseline, whereas 58% developed it during the course of the study. Kaplan–Meier analysis showed that leukopenia occurred later, at a median of 30 months (95% CI, 18.5–53.6) into the study. Anemia occurred the latest, at a median of 39.6 months (95% CI, 24.1–49.9) into the study (Figure 1).
Figure 1.
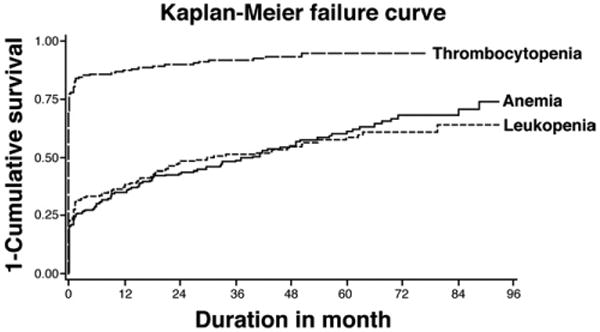
Kaplan–Meier failure curve for the occurrence of thrombocytopenia, anemia, and leukopenia in the entire cohort (n = 213). 77% of the patients had thrombocytopenia at baseline; whereas the median time to occurrence for anemia was 39.6 months (95% CI, 24.1–49.9), and leukopenia was 30 months (95% CI, 18.5–53.6).
The occurrence of cytopenias was analyzed longitudinally in the 34 patients with normal HI at baseline. Thrombocytopenia was the most common cytopenia to occur in 20 (59%) patients at a median 28 months into the study. Twelve (35%) developed anemia and 7 (21%) developed leukopenia on follow-up. The median time to onset for anemia and leukopenia could not be calculated because less than 50% of the normal HI patients developed either of these 2 cytopenias (Figure 2).
Figure 2.
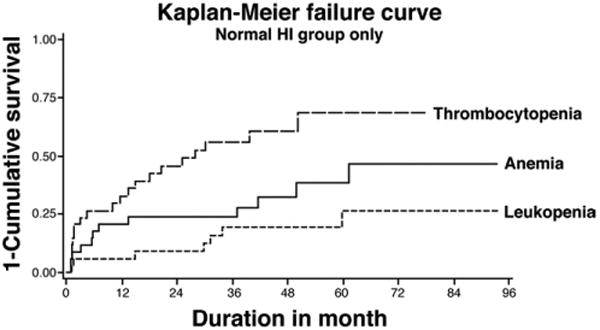
Kaplan–Meier failure curve for the occurrence of thrombocytopenia, anemia, and leukopenia in patients (n = 34) with normal HI at baseline. 59% of the patients developed thrombocytopenia on follow-up, with a median time to occurrence of 28 months. Anemia occurred in 35%, and leukopenia occurred in 21% of patients.
Death and Transplant Among the Abnormal Hematologic Indices Groups
As shown in Tables 3 and 4, baseline thrombocytopenia and leukopenia were found to be significantly associated with death or transplant under univariate analysis. Anemia at baseline was not found to have any association. Given their association with a poor outcome in cirrhosis, baseline HVPG and Child–Pugh score were considered as potential confounders of the association of thrombocytopenia or leukopenia with death or transplant, and multivariate analysis was conducted. A history of alcoholic cirrhosis was not associated with death or transplant and was not found to be a confounder, despite the known association with bone marrow suppression. Under multivariate analysis, thrombocytopenia and leukopenia, like the HVPG and Child–Pugh score, were independently associated with death or transplant, as shown in Table 4.
Table 3. Univariate Analysis.
| Risk factors for death or transplant | Hazard ratio (95%CI) | P value |
|---|---|---|
| Thrombocytopenia at baseline | 5.6 (1.7–17.8) | .0040 |
| Leukopenia at baseline | 2.9 (1.7–5.0) | .0001 |
| Anemia at baseline | 1.7 (0.9–3.1) | .1039 |
NOTE. Both leukopenia and thrombocytopenia were significantly associated with death or transplant on follow-up. Anemia was not significant.
Table 4. Multivariate Analysis.
| Risk factors for death or transplant | Hazard ratio (95%CI) | P value |
|---|---|---|
| Thrombocytopenia at baseline | 4.1 (1.3–13.6) | .0191 |
| Leukopenia at baseline | 1.8 (1.0–3.3) | .0383 |
| Baseline HVPG | 1.1 (1.0–1.2) | .0132 |
| Child–Pugh score at baseline | 1.6 (1.1–2.2) | .0105 |
NOTE. Both leukopenia and thrombocytopenia were significantly associated with death or transplant on follow-up when controlled for baseline Child–Pugh Score and HVPG measurement as confounders.
Because of the later occurrence of leukopenia compared with thrombocytopenia, it was hypothesized that patients with leukopenia plus thrombocytopenia had an advanced stage of compensated cirrhosis and were at higher risk of death or transplant compared with patients with normal HI or thrombocytopenia at baseline (Figure 3). Death or transplant was significantly more likely to occur among patients who had leukopenia plus thrombocytopenia at baseline (23/47, 49%), compared with 2 of 34 (6%) for the normal and 28 of 119 (24%) for the thrombocytopenia groups (Figure 3). The increased occurrence of either death or transplant in the leukopenia plus thrombocytopenia group was significantly greater than the normal (P < .0001) and thrombocytopenia groups (P = .0002). Patients in the thrombocytopenia group were also significantly more likely to have death or transplant during follow-up compared with patients in the normal group (P = .0314). Similar results were found when non-liver deaths were excluded from the analysis (normal, 1/34 [3%]; thrombocytopenia, 21/119 [18%]; leukopenia and thrombocytopenia, 18/47 [38%]; P < .0001).
Figure 3.
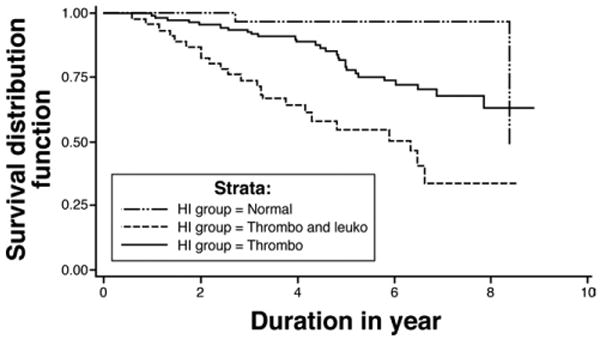
Kaplan–Meier survival analysis of death/transplant among the HI groups (P < .0001). Thrombo, thrombocytopenia only; Thrombo and Leuko, thrombocytopenia and leukopenia. Pairwise comparisons by log-rank test: leukopenia combined with thrombocytopenia vs normal, P < .0001; leukopenia combined with thrombocytopenia vs thrombocytopenia, P = .0002; thrombocytopenia vs normal, P = .0314.
Death Among the Abnormal Hematologic Indices Groups
The occurrence of death was compared among the 3 HI groups during the median follow-up of 54.9 months (Figure 4). In the leukopenia plus thrombocytopenia group, 13 of 47 (28%) died during follow-up, compared with 2 of 34 (6%) in the normal and 21 of 119 (18%) for the thrombocytopenia groups (Figure 4). The increased mortality in the leukopenia plus thrombocytopenia group was significantly greater than in the normal (P = .0053) and thrombocytopenia groups (P = .0280). A greater proportion of deaths in leukopenia plus thrombocytopenia group (8/47, 17%) were liver-related compared with other groups, but this did not achieve statistical significance (normal, 1/34 [3%], P = .07; thrombocytopenia, 14/119 [12%], P = .3682). There were 13 patients who had non–liver-related causes of mortality including normal (n = 1) (cardiac arrest), thrombocytopenia (n = 7) (1 pneumonia and sepsis, 1 pneumonia only, 1 sepsis only, 1 sepsis with dementia, 1 epiglottic cancer, 1 adenocarcinoma of unknown primary, and 1 cervical cancer), and leukopenia plus thrombocytopenia (n = 5) (3 pneumonia, 1 sepsis with aortic valve replacement, and 1 carcinoma of unknown primary).
Figure 4.
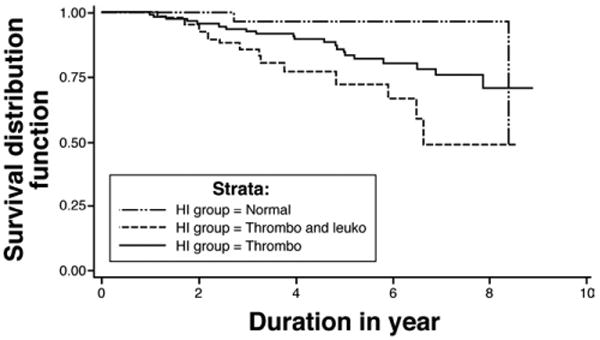
Kaplan–Meier survival analysis of death among the HI groups (P = .0093). Thrombo, thrombocytopenia only; Thrombo and Leuko, thrombocytopenia and leukopenia. Pairwise comparisons by log-rank test: leukopenia combined with thrombocytopenia vs normal, P = .0053; leukopenia combined with thrombocytopenia vs thrombocytopenia, P = .0280.
Clinical Decompensation Among the Abnormal Hematologic Indices Groups
Patients with leukopenia plus thrombocytopenia at baseline were more likely to develop clinical decompensation. Twenty of 47 (43%) in the leukopenia plus thrombocytopenia group developed clinical decompensation on follow-up compared with 4 of 34 (12%) in the normal group (P = .0031). Although no statistical difference was noted, clinical decompensation was more common in patients with leukopenia plus thrombocytopenia group compared with the thrombocytopenia group (32/119 [27%], P = .06) (Table 5). Hepatocellular carcinoma was significantly more common in the leukopenia plus thrombocytopenia group (11/47, 23%) compared with the normal (1/34, 3%) and thrombocytopenia groups (13/119, 11%) (P = .01).
Table 5. Clinical Decompensation During Follow-up in Patients in the Normal HI, Thrombocytopenia, and Leukopenia Combined With Thrombocytopenia Groups (P = .0083).
| Normal | Thrombocytopenia | Leukopenia combined with thrombocytopenia | |
|---|---|---|---|
| Clinical decompensation | |||
| Yes | 4 | 32 | 20 |
| No | 30 | 87 | 27 |
NOTE. Group comparisons: normal vs leukopenia combined with thrombocytopenia, P = .0031. Normal vs thrombocytopenia, P = .0714. Thrombocytopenia vs leukopenia combined with thrombocytopenia, P = .0633.
Correlation Between Hepatic Venous Pressure Gradient and White Blood Cell Count and Hemoglobin
There was a statistically significant correlation between HVPG and WBC at baseline by using Spearman correlation (Spearman correlation, −0.31; P < .0001, n = 213). Similarly, a significant correlation was found between HVPG and Hgb (Spearman correlation, −0.35; P < .0001, n = 213) (Figure 5).
Figure 5.
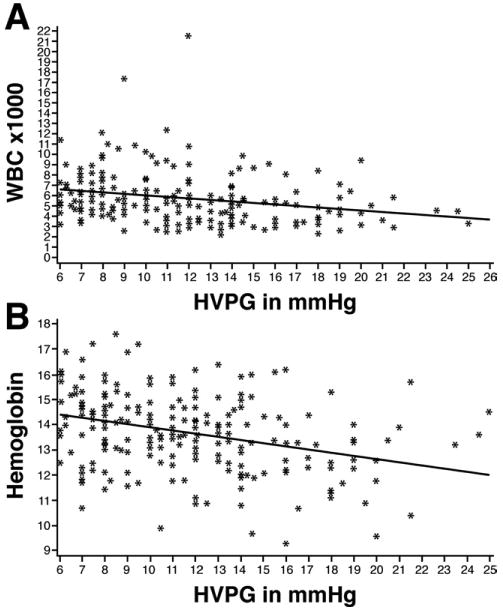
(A) Correlation curve showing a relationship between WBC and HVPG at baseline (Spearman correlation, −0.31; P < .0001, n = 213). (B) Correlation curve showing a relationship between Hgb and HVPG at baseline (Spearman correlation, −0.35; P < .0001, n = 213).
Hepatic Venous Pressure Gradient and Abnormal Hematologic Indices
Baseline HVPG was significantly different among the 3 HI groups (P < .0001). Compared with the normal group (8.6 ± 2.6 mm Hg), the thrombocytopenia (11.5 ± 4.1 mm Hg, P < .05) and leukopenia plus thrombocytopenia groups (14.1 ± 3.9 mm Hg, P < .05) had significantly higher HVPG. There was a significantly greater elevation of the HVPG in patients with leukopenia plus thrombocytopenia than in the thrombocytopenia group (P < .05) (Figure 6).
Figure 6.
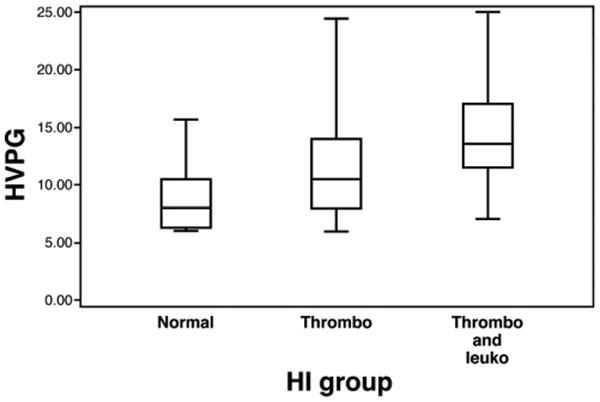
HVPG among different HI groups expressed in median with interquartile ranges. Thrombo, thrombocytopenia only; Thrombo and Leuko, thrombocytopenia and leukopenia. Pairwise comparisons: Leukopenia combined with thrombocytopenia vs normal, P < .05. Leukopenia combined with thrombocytopenia vs thrombocytopenia, P < .05. Thrombocytopenia vs normal, P < .05.
Clinically significant portal hypertension (HVPG >10 mm Hg) was more common at baseline in the leukopenia plus thrombocytopenia group (42/47, 89%), compared with the normal (11/34, 32%, P < .0001) and thrombocytopenia (73/119, 61%, P = .0003) groups. On follow-up, an HVPG >10 mm Hg had occurred in 45 of 47 (96%) of the leukopenia plus thrombocytopenia group, compared with 18 of 34 (53%, P < .0001) for the normal and 90 of 119 (76%, P = .0018) for the thrombocytopenia groups (Table 6).
Table 6. Occurrence of HVPG ≥10 mm Hg Among the Different Groups at Baseline (P < .0001) and on Follow-up (P < .0001).
| HVPG ≥10 mm Hg at baseline (%) | HVPG ≥10 mm Hg on follow-up (%) | |
|---|---|---|
| Normal | 11/34 (32) | 18/34 (53) |
| Thrombocytopenia | 73/119 (61) | 90/119 (76) |
| Leukopenia combined with thrombocytopenia | 42/47 (89) | 45/47 (96) |
Discussion
Hematologic abnormalities are very common in cirrhosis. Studies evaluating patients with varying severity of cirrhosis report an incidence of any HI from 6%–64%.1–8 A retrospective chart review by Bashour et al1 compared the prevalence of cytopenias between patients with cirrhosis and patients with fibrosis as determined by liver biopsy. Among cirrhotic patients, 64% were found to have a platelet count less than 150,000 per mm3 compared with only 5.5% in the normal control group. Leukopenia was slightly increased in patients with cirrhosis (5%) compared with controls (3.3%). This difference in HI was independent of the etiology of cirrhosis. In the current study, 84% of the subjects had a cytopenia on entry to the study. Among these subjects, thrombocytopenia was the most common abnormality present in 77% of the subjects. Both anemia and leukopenia were present with similar prevalence. The combination of thrombocytopenia and leukopenia with or without anemia was a frequent finding.
As would be expected from previous reports, thrombocytopenia was the most common abnormal HI, with the vast majority being thrombocytopenic at baseline (77%). In contrast, leukopenia was present in 42% of patients at baseline and anemia in 37%.
Previous studies have reported a wide range for abnormal HI in cirrhosis.1–8 This might partly be due to the cross-sectional nature of prior studies and the differing severities of cirrhosis. Because patients with differing severity of portal hypertension were included in the current study, analysis of the sequence of abnormal HI in the normal group was conducted. Subjects with normal HI had lower baseline portal pressures suggestive of milder liver disease compared with the other groups. Once again, thrombocytopenia was the most common cytopenia to occur in 59% of the normal HI patients at a median 28 months into the study. Similarly, anemia and leukopenia occurred less frequently in 35% and 21% of patients, respectively. Median time of onset of both anemia and leukopenia could not be calculated because less than 50% developed either cytopenia on follow-up, but on the basis of the Kaplan–Meier analysis, they occur later than thrombocytopenia.
The sequence of thrombocytopenia, leukopenia, and anemia differed, suggesting that the occurrence of cytopenias alone or in combination reflects a different stage of cirrhosis. The current study confirms that thrombocytopenia at baseline was associated with a significantly increased risk of morbidity and mortality as previously shown.13–16 However, a novel and clinically important finding of this study is that leukopenia at baseline was also associated with a significantly increased risk of death or transplant, whereas anemia was not found to be significant. Because the natural history of compensated cirrhosis is associated with a reduced life expectancy and the occurrence of leukopenia lags thrombocytopenia by almost 2.5 years, it could be suggested that the presence of both abnormal HI is associated with a poor prognosis. This was confirmed in the study by showing that patients with leukopenia plus thrombocytopenia at baseline had increased occurrence of death or transplant during 54.9 months of longitudinal follow-up, compared with the normal HI and thrombocytopenia groups. This suggests that patients with leukopenia plus thrombocytopenia have progressed in the course of compensated cirrhosis reflected by more severe portal hypertension (median HVPG, 14.1 mm Hg) and increased morbidity related to clinical decompensation and hepatocellular carcinoma compared with patients with normal HI. During the data collection for the primary study, other important markers of morbidity such as gastrointestinal bleeding, spontaneous bacterial peritonitis, prolonged hospitalization, intensive care unit stay, and poor quality of life were not collected. However, on the basis of the differences in clinical decompensation and hepatocellular carcinoma, it is quite possible that these other morbidity markers would have been more prevalent in the leukopenia plus thrombocytopenia group. Clinically significant portal hypertension (HVPG >10 mm Hg) has been shown to have an increased risk of mortality and complications of portal hypertension.20 Other reports have shown the importance of clinically significant portal hypertension.21–24
Liver-related mortality was more common in patients with leukopenia plus thrombocytopenia at baseline compared with normal or thrombocytopenia groups. However, these differences were not significant. The occurrence of liver transplantation might have affected the analysis of liver-related mortality. Because survival of many patients with cirrhosis and clinical decompensation or hepatocellular carcinoma is grim without liver transplantation, the occurrence of liver-related mortality or transplantation was analyzed as a combined end point. Liver-related death or transplant was significantly more common in patients with baseline leukopenia plus thrombocytopenia, thus confirming a poorer prognosis for such patients.
An additional consideration is that leukopenia in patients with cirrhosis might have contributed to a higher risk of infection and therefore to the mortality in non–liver-related deaths. The occurrence of leukopenia might be associated with additional immunodeficiency effecting leukocyte extravasation and activation and impaired cytokine release or function. Notably, only 1 non–liverrelated death occurred out of 34 patients in the normal group, which was unrelated to infection. In contrast, 5 non–liver-related deaths occurred out of 47 patients in the leukopenia and thrombocytopenia group. Of these 5 patients, 4 had an infection or sepsis present at death. Patients with thrombocytopenia at baseline also had non-liver deaths related to infection or sepsis. These findings would be consistent with previously published data that patients with cirrhosis are at greater risk of infection and its associated complications.25–27
The presence or absence of anemia had no effect on the finding of death or transplant, despite the later occurrence suggested by our data. This might be explained by the fluctuations that might occur with occult hemorrhage from portal and non-portal hypertensive causes, hemolysis, bone marrow suppression from alcohol, and viral factors or alterations in hematopoietic factors. Alternatively, unlike anemia, leukopenia in cirrhosis might be associated with increasing the risk of infectious and malignant events caused by impaired immune function.
We have previously reported a significant correlation between portal pressures and platelet count.9 However, portal hypertension alone was not sufficient to cause thrombocytopenia in compensated cirrhosis. A statistically significant correlation between HVPG and WBC and Hgb was also found in the current study. Compared with thrombocytopenia, portal hypertension alone appears to contribute even less in the development of anemia or leukopenia in cirrhosis, suggesting that alterations in growth factors such as erythropoietin or alterations in hematopoietic stem cell activity might play a greater role.
A limitation of the current study is the retrospective analysis of data obtained in a prospective, randomized controlled trial. The death, transplant, and clinical decompensation data were also collected retrospectively for the patients who had reached the primary end point, the development of esophageal varices. These findings might need to be validated in a prospective study. Furthermore, studies are needed to determine why the development of leukopenia and anemia lag behind thrombocytopenia in patients with compensated cirrhosis.
In conclusion, we have shown that in patients with compensated cirrhosis and portal hypertension, thrombocytopenia is the first cytopenia to develop, followed in a sequential fashion by leukopenia and anemia. The combination of leukopenia with thrombocytopenia present at baseline is predictive of an increase in morbidity and mortality.
Acknowledgments
Funding: Supported by a grant (RO1 46580) from the National Institute of Diabetes and Digestive and Kidney Diseases and Goldberg Junior Faculty Award (7/1/06–6/30/08). The CIBERehd is funded by the Instituto de Salud Carlos III.
Abbreviations used in this paper
- CI
confidence interval
- GEV
gastroesophageal varices
- Hgb
hemoglobin
- HI
hematologic indices
- HVPG
hepatic venous pressure gradient
- WBC
white blood cell count
Footnotes
Conflicts of interest: The authors disclose no conflicts.
References
- 1.Bashour FN, Teran JC, Mullen KD. Prevalence of peripheral blood cytopenias (hypersplenism) in patients with nonalcoholic chronic liver disease. Am J Gastroenterol. 2000;95:2936–2939. doi: 10.1111/j.1572-0241.2000.02325.x. [DOI] [PubMed] [Google Scholar]
- 2.Morlock CG, Hall BE. Association of cirrhosis, thrombocytopenia and hemorrhagic tendency. Arch Intern Med. 1943;72:69–77. [Google Scholar]
- 3.Mutchnik MG, Lerner E, Conn HO. Effect of portocaval anastamosis on hypersplenism. Dig Dis Sci. 1980;25:929–938. doi: 10.1007/BF01308044. [DOI] [PubMed] [Google Scholar]
- 4.Sullivan BH, Tumen HJ. The effect of portocaval shunt on thrombocytopenia associated with portal hypertension. Ann Intern Med. 1961;55:598–603. doi: 10.7326/0003-4819-55-4-598. [DOI] [PubMed] [Google Scholar]
- 5.Soper NJ, Nikker LF. Effect of operations for variceal hemorrhage on hypersplenism. Am J Surg. 1982;144:700–703. doi: 10.1016/0002-9610(82)90554-2. [DOI] [PubMed] [Google Scholar]
- 6.Hutson DG, Zeppa R, Levi J, et al. The effect of distal splenorenal shunt on hypersplenism. Ann Surg. 1977;185:605–612. doi: 10.1097/00000658-197705000-00014. [DOI] [PMC free article] [PubMed] [Google Scholar]
- 7.Ferrara J, Ellison C, Martin EW, et al. Correction of hypersplenism following DSRS. Surgery. 1979;86:570–573. [PubMed] [Google Scholar]
- 8.Pusnani K, Sillin L, Kaplan D, et al. Effect of transjugular intrahepatic portosystemic shunt on secondary hypersplenism. Am J Surg. 1997;173:169–173. doi: 10.1016/s0002-9610(97)00006-8. [DOI] [PubMed] [Google Scholar]
- 9.Qamar AA, Grace ND, Groszmann RJ, et al. Platelet count and changes over time as predictors of gastroesophageal varices in cirrhosis. Hepatology. 2008;47:153–159. doi: 10.1002/hep.21941. [DOI] [PubMed] [Google Scholar]
- 10.Peck-Radosavljevic M. Thrombocytopenia in liver disease. Can J Gastroenterol. 2000;(Suppl):60D–66D. doi: 10.1155/2000/617428. [DOI] [PubMed] [Google Scholar]
- 11.Peck-Radosavljevic M. Hypersplenism. Eur J Gastroenterol Hepatol. 2001;13:317–323. doi: 10.1097/00042737-200104000-00004. [DOI] [PubMed] [Google Scholar]
- 12.Liangpunsakul S, Sithat M, Ulmer B, et al. Predictors and implications of severe hypersplenism in patients with cirrhosis. Am J Med Sci. 2003;326:111–116. doi: 10.1097/00000441-200309000-00001. [DOI] [PubMed] [Google Scholar]
- 13.Talwalkar JA, Kamath PS. Influence of recent advances in medical management on clinical outcomes of cirrhosis. Mayo Clin Proc. 2005;80:1501–1508. doi: 10.4065/80.11.1501. [DOI] [PubMed] [Google Scholar]
- 14.D'Amico G, Morabito A, Pagliaro L, et al. Survival and prognostic indicators in compensated and decompensated cirrhosis. Dig Dis Sci. 1986;31:468–475. doi: 10.1007/BF01320309. [DOI] [PubMed] [Google Scholar]
- 15.Realdi G, Fattovich G, Hadziyannis S, et al. Investigators of the European Concerted Action on Viral Hepatitis (EUROHEP): survival and prognostic factors in 366 patients with compensated cirrhosis type B—a multicenter study. J Hepatol. 1994;21:656–666. doi: 10.1016/s0168-8278(94)80115-0. [DOI] [PubMed] [Google Scholar]
- 16.Gentilini P, Laffi G, La Villa G, et al. Long course and prognostic factors of virus-induced cirrhosis of the liver. Am J Gastroenterol. 1997;92:66–72. [PubMed] [Google Scholar]
- 17.Groszmann RJ, Garcia-Tsao G, Bosch J, et al. Beta-blockers to prevent gastroesophageal varices in patients with cirrhosis. N Engl J Med. 2005;353:2254–2261. doi: 10.1056/NEJMoa044456. [DOI] [PubMed] [Google Scholar]
- 18.Toghill PJ, Green S. Splenic influences on the blood in chronic liver disease. Quart J Med. 1979;48:613–625. [PubMed] [Google Scholar]
- 19.Recommendations to prevent and control iron deficiency in the United States: Centers for Disease Control and Prevention. MMWR Recomm Rep. 1998;47(RR-3):1–29. [PubMed] [Google Scholar]
- 20.Ripoll C, Groszmann RJ, Garcia-Tsao G. Hepatic venous pressure gradient predicts clinical decompensation in patients with compensated cirrhosis. Gastroenterology. 2007;133:481–488. doi: 10.1053/j.gastro.2007.05.024. [DOI] [PubMed] [Google Scholar]
- 21.Armonis A, Patch D, Burroughs A. Hepatic venous pressure measurement: an old test as a new prognostic marker in cirrhosis? Hepatology. 1997;25:245–248. doi: 10.1053/jhep.1997.v25.ajhep0250245. [DOI] [PubMed] [Google Scholar]
- 22.D'Amico G, Garcia-Tsao G, Pagliaro L. Natural history and prognostic indicators of survival in cirrhosis: a systematic review of 118 studies. J Hepatol. 2006;44:217–231. doi: 10.1016/j.jhep.2005.10.013. [DOI] [PubMed] [Google Scholar]
- 23.Ripoll C, Bañares R, Rincón D, et al. Influence of hepatic venous pressure gradient on the prediction of survival of patients with cirrhosis in the MELD era. Hepatology. 2005;42:793–801. doi: 10.1002/hep.20871. [DOI] [PubMed] [Google Scholar]
- 24.Ripoll C. Hepatic venous pressure gradient and outcomes in cirrhosis. J Clin Gastroenterol. 2007;41(Suppl 3):S330–S335. doi: 10.1097/MCG.0b013e318150d0f4. [DOI] [PubMed] [Google Scholar]
- 25.Caly WR, Strauss E. A prospective study of bacterial infection in patients with cirrhosis. J Hepatol. 1993;18:353–358. doi: 10.1016/s0168-8278(05)80280-6. [DOI] [PubMed] [Google Scholar]
- 26.Borzio M, Salerno F, Piantoni L, et al. Bacterial infection in patients with advanced cirrhosis: a multicentre prospective study. Dig Liver Dis. 2001;33:41–48. doi: 10.1016/s1590-8658(01)80134-1. [DOI] [PubMed] [Google Scholar]
- 27.Rosa H, Silvério AO, Perini RF, et al. Bacterial infection in cirrhotic patients and its relationship with alcohol. Am J Gastroenterol. 2000;95:1290–1293. doi: 10.1111/j.1572-0241.2000.02026.x. [DOI] [PubMed] [Google Scholar]