

Abstract
Habitat heterogeneity influences pathogen ecology by affecting vector abundance and the reservoir host communities. We investigated spatial patterns of disease risk for two human pathogens in the Borrelia genus–B. burgdorferi and B. miyamotoi–that are transmitted by the western black-legged tick, Ixodes pacificus. We collected ticks (349 nymphs, 273 adults) at 20 sites in the San Francisco Bay Area, California, USA. Tick abundance, pathogen prevalence and density of infected nymphs varied widely across sites and habitat type, though nymphal western black-legged ticks were more frequently found, and were more abundant in coast live oak forest and desert/semi-desert scrub (dominated by California sagebrush) habitats. We observed Borrelia infections in ticks at all sites where we able to collect >10 ticks. The recently recognized human pathogen, B. miyamotoi, was observed at a higher prevalence (13/349 nymphs = 3.7%, 95% CI = 2.0–6.3; 5/273 adults = 1.8%, 95% CI = 0.6–4.2) than recent studies from nearby locations (Alameda County, east of the San Francisco Bay), demonstrating that tick-borne disease risk and ecology can vary substantially at small geographic scales, with consequences for public health and disease diagnosis.
Introduction
Human infection by tick-borne pathogens is the culmination of interactions between the transmission biology of the pathogen, the ecology of the reservoir hosts and competent vectors, and the consequent exposure and disease in the human case. Local habitat and environmental conditions can influence any and all aspects of these interactions, and disease risk and incidence vary as a result [1,2].
California exhibits a high degree of climatic and habitat heterogeneity which influences tick abundance, reservoir host communities, and the entomologic risk of Lyme disease [1,2]. For example, hardwood-dominated woodlands exhibit higher densities of nymphal ticks infected by Borrelia burgdorferi, the etiologic agent of Lyme disease, than do conifer-dominated woodlands that include redwood or pine [2]. Human incidence also varies within the state, with most cases occurring in northwestern counties, and fewer cases being reported from southern California [3].
Given the habitat and climate diversity, it is unsurprising that recent research has highlighted a concurrent remarkable diversity of Californian tick-borne pathogens [4–6]. The western black-legged tick, Ixodes pacificus, is a known vector of B. burgdorferi sensu stricto (ss), but also harbors other Borrelia species, including B. miyamotoi, which has recently been recognized as a human pathogen [7–12]. Recent tick-borne pathogen surveillance observed eight borrelial genospecies in ticks and small mammals from just Alameda County, east of the San Francisco Bay [6]. Other emerging tick-borne pathogens in California include Anaplasma phagocytophilum, cause of human granulocytic anaplasmosis, and Rickettsia 364D which has caused clusters of eschar-associated illness [13–14].
Here we investigate the ecology of tick-borne pathogens in the San Francisco Bay Area of northern California. Specifically, we describe Borrelia ecology in recreational areas, and report variation in pathogen prevalence and western black-legged tick (I. pacificus) density. In addition, we investigate the importance of local landscape attributes–vegetation type, soil type etc.–upon tick-borne disease risk. Increased recognition of the ecology of these disease agents in an area of high human population density and significant outdoor use may facilitate adoption of preventive behaviors, public health and medical responses to tick-borne pathogens in California.
Materials and Methods
Study sites and tick collection
All sites (n = 20) were in the San Francisco Bay area (Marin, Napa, San Mateo, Santa Clara, Santa Cruz and Sonoma counties) and the majority were recreational areas (e.g., California State Parks (SP), Midpeninsular Open Space Preserves (OSP)) (Fig 1). We thank the Midpeninsular Regional Open Space District, San Mateo County Parks, Jasper Ridge Biological Preserve, City of Palo Alto, the Horse Park at Woodside, and California State Parks for permission to collect ticks. We also thank local community members of Portola Valley and Woodside and California Department of Public Health’s Vector-Borne Disease Section for assistance in collecting ticks.
Fig 1. Recreational areas in the San Francisco Bay area (left) sampled for western black-legged ticks, with a close-up (right) of recreational areas sampled in San Mateo and Santa Clara Counties.

In northern California, the period of highest nymphal abundance spans April to June, though local conditions dictate seasonal patterns of tick density and phenology [15]. For this study we collected ticks during May 2012 and May 2013 to ensure significant sample sizes of I. pacificus nymphs throughout the region. All ticks were identified to species and stage via morphology, and here we report studies of I. pacificus only. Nymphal and adult ticks were collected by dragging a 1m2 white flannel blanket along vegetation and/or leaf-litter. We recorded the number of nymphal ticks collected in 30m transects along trails. Transects were separated from each other by at least 60m to provide some degree of independence between transects, and each transect occurred in a single vegetation type. To augment sample sizes of ticks for data on pathogen prevalence, we collected ticks along trails between the 30m transects, but these samples are not included in the analyses of tick density-habitat relationships.
We recorded the GPS co-ordinates of the beginning of each transect to access GIS data on elevation (meters above sea level), distance to road (meters), and vegetation and soil type (Fig 2). GIS data were downloaded from the Conservation Lands Network (http://www.bayarealands.org/mapsdata.html). Elevation and distance to the nearest road are continuous variables; vegetation and soil types are categorical variables. For further details on vegetation and soil classification see [16–17]. We analyzed relationships between disease risk and landscape attributes only using data for which we had >15 transects for each vegetation classification. Habitat classifications included (1) coast live oak woodland–dominant species is coast live oak (Quercus agrifolia) with associated species including madrone (Arbutus menziesii), California blackberry (Rubus ursinus), and poison oak (Toxicodendron diversilobum); (2) redwood forest–dominant species is coastal redwood (Sequoia sempervirens) with associated species such as Douglas fir (Pseudotsuga menziesii) and tanoak (Lithocarpus densiflorus); (3) Douglas fir forest–dominant species is Pacific Douglas fir, with associated species such as coastal redwood, ponderosa pine (Pinus ponderosa), coast live oak and tanoak; (4) coastal scrub–dominant species are coyote brush (Baccharis pilularis) and poison oak, with associated species such as California sagebrush (Artemisia californica); (5) desert/semi-desert scrub–dominant species are California sagebrush and chamise (Adenostoma spp.) with other shrubs present; (6) warm grasslands–dominated by annual grasses and forbs, with varying amounts of native perennials, where July maximum temperatures are 26–30°C; and (7) moderate grasslands–dominated by annual grasses and forbs, with varying amounts of native perennials, where July maximum temperatures are 22–26°C. Sites often included multiple types of habitat, and habitat types were found across numerous recreational areas e.g., Windy Hill OSP contained coast live oak woodland, desert/semi-desert scrub, Douglas fir forest, coastal scrub, moderate grassland and warm grasslands.
Fig 2. Study area showing independent variables: soil type (top left), elevation (top right), vegetation type (bottom left) and distance to roads (bottom right).
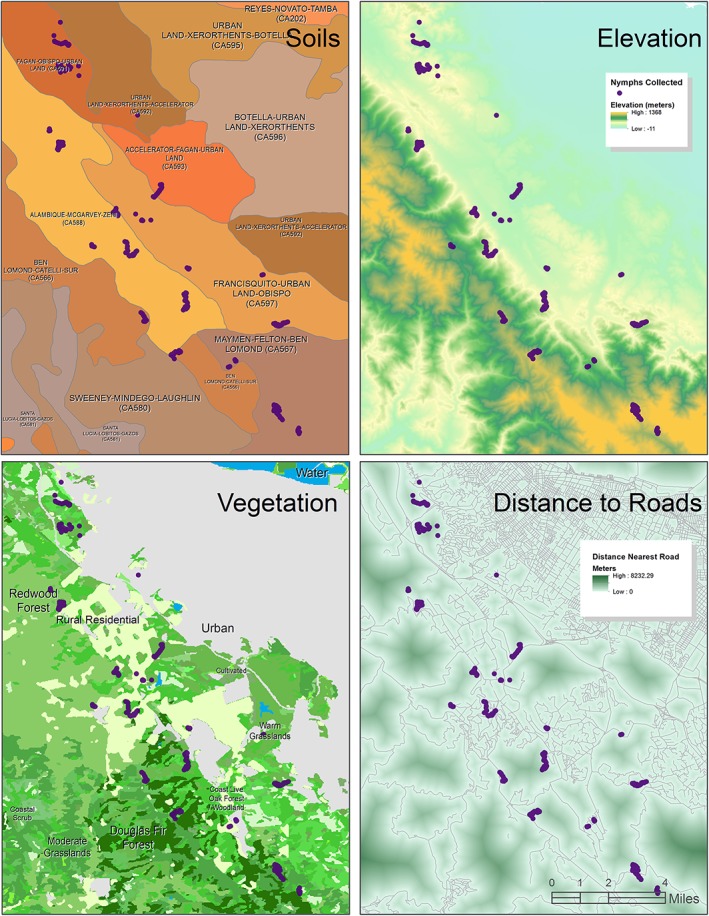
Purple dots represent tick- drag transects in Santa Clara and San Mateo counties.
Detection of Borrelia spp. in I. pacificus nymphs
All ticks were removed from the site and stored in 70% ethanol. Nymphal ticks collected in 2013 were examined individually by a previously developed quantitative polymerase chain reaction (qPCR) diagnostic that identifies a segment of the 16S gene of Borrelia spp. DNA [18]. The assay utilizes primer pairs that can detect any member of the Borrelia genus and then combines species-specific hybridization probes to distinguish between Lyme group and TBRF group samples. DNA was extracted from individual ticks following manufacture’s protocols (DNeasy Blood and Tissue kit, Qiagen, Valencia CA) and stored at -20°C until molecular analysis. All diagnostic assays were performed using qPCR SsoFast Supermix 1X (Life Science Research, Bio-Rad, Hercules, CA) on a CFX96-Touch qPCR system (Life Science Research, Bio-Rad, Hercules, CA) and included three negative controls (3.6 μl water) on each run. Each 20 μl reaction contained primers at a concentration of 300 nM, probe at 200 nM (Applied Biosystems, Life Technologies, Carlsbad, CA), and followed a two-step protocol recommended by the manufacturer. Samples were considered positive if they had a cycle threshold (CT) value < 40 and logarithmic qPCR amplification plots. To identify Borrelia species and strain genotype we attempted to sequence the 16S-23S intergenic spacer (rrs-rrlA, IGS) of each qPCR-positive tick sample using a nested-PCR protocol [19]. The nested PCR product was further purified using the QIAquick kit (Qiagen, Valencia, CA) and then sequenced using capillary Sanger sequencing on an ABI 3730 sequencer with both forward and reverse primers (EnGGen, Northern Arizona University).
Description of measures of entomologic risk
We report three measures of entomologic disease risk: (i) Density of nymphs (DON)—i.e., the number of nymphal ticks found per 100m of transect, for both 2012 and 2013; (ii) Infection prevalence of Borreliae, i.e., percentage of ticks testing positive for the disease agent for samples from 2013; (iii) Density of infected nymphs (DIN), calculated by multiplying nymphal infection prevalence by the density of nymphs, and reported as the density of infected nymphs/100m.
Statistics and modeling approach
We constructed models to examine the influence of landscape variables (beginning with a full model incorporating elevation, distance from the nearest road, vegetation type, soil type and site) on the abundance of ticks in 30m-transects, and compared generalized linear models with Poisson errors and negative binomial errors to account for many zero-measures of ticks [20–21].
We compared the full model with simpler models and used Akaike’s Information Criterion (AIC) [22] to select the most parsimonious model with the highest predictive power of tick density. The model with the lowest AIC value was deemed the best, though other models within two AIC units were considered to be competing models with substantial support [23].
Results
Nymphal abundance
Nymphal I. pacificus abundance varied widely across all of our 20 study sites (0–10 nymphs/100m2; Table 1). Density of nymphs (DON) also ranged widely within recreational areas, depending on habitat or simply between different trails. For example, in Thornewood Open Space Preserve (OSP), DON was higher (3.1/100m2) in coast live oak forest compared to redwood habitats (1.2/100m2). In nearby Windy Hill OSP, DON varied between habitats dominated by coastal scrub and moderate grassland (0/100m2), and coast live oak forest at two locations: Betsy Crowder trail (10/100m2) and Meadow Trail, which also contained Douglas fir forest (1.25/100m2).
Table 1. Summary statistics of entomologic risk for Ixodes pacificus infected with Borrelia spp. in recreational areas of the San Francisco Bay Area.
Data are presented on density of nymphal (DON) I. pacificus (i.e., number of nymphs/100m2 (calculated by (number of ticks collected/meters covered by transects) x100); density of infected nymphs (DIN) for Borrelia spp. (calculated by Borrelia prevalence x DON); and for B. miyamotoi, B. burgdorferi ss, and for B. burgdorferi sl.
| Location | DON | DIN Borrelia | DIN B. miyamotoi | DIN B. burgdorferi ss | DIN B. burgdorferi sl |
|---|---|---|---|---|---|
| Napa Co. | |||||
| Bothe-Napa SP | 0.8 | 0.04 | 0.02 | 0 | 0.02 |
| San Mateo Co. | |||||
| Corte De Madera OSP | 0.7 | 0 | 0 | 0 | 0 |
| Edgewood Park | 2.2 | - | - | - | - |
| Horse Park at Woodside | 0 | 0 | 0 | 0 | 0 |
| Huddart Park | 2.3 | - | - | - | - |
| Jasper Ridge Biological Preserve | 1.7 | 0 | 0 | 0 | 0 |
| Los Trancos OSP | 1.1 | 0.2 | - | 0.1 | - |
| Pulgas Ridge OSP | 1.0 | 0 | 0 | 0 | 0 |
| Purisima Creek Redwood OSP | 0 | 0 | 0 | 0 | 0 |
| Thornewood OSP total | 2.0 | 0.4 | 0.2 | - | - |
| Thornewood OSP: coast live oak forest | 3.1 | 0.3 | - | - | - |
| Thornewood OSP: redwood forest | 1.2 | 0.2 | 0.2 | 0 | 0 |
| Windy Hill OSP total | 5.2 | 0.6 | 0.2 | 0 | 0.1 |
| Windy Hill OSP–Betsy Crowder Trail 1 | 10 | 1.0 | 0.4 | - | 0.2 |
| Windy Hill OSP–Anniversary Trail 2 | 0 | 0 | 0 | 0 | 0 |
| Windy Hill OSP–Meadow Trail 3 | 1.25 | 0.3 | - | - | - |
| Wunderlich Co. Pk. | 3.75 | 0.1 | - | 0.1 | - |
| Santa Clara Co. | |||||
| Foothills Park | 4.7 | 0.9 | 0.3 | 0.2 | 0.2 |
| Hidden Villa | 2.2 | 0.2 | 0.1 | 0.1 | 0.1 |
| Monte Bello OSP | 0.3 | 0.03 | 0.03 | 0 | 0 |
| Pearson-Arastradero Preserve | 0 | 0 | 0 | 0 | 0 |
| Sierra Azul OSP | 0.7 | 0 | 0 | 0 | 0 |
| Santa Cruz Co. | |||||
| Castle Rock SP | 0 | 0 | 0 | 0 | 0 |
| Sonoma Co. | |||||
| Annadel SP | 6 | 0.6 | 0.1 | - | - |
| Jack London SP | 0.7 | 0.1 | - | 0.04 | - |
1Betsy Crowder Trail is comprised of coast live oak woodland.
2Anniversary Trail is comprised of coastal scrub and moderate grassland.
3Meadow Trail is comprised of coast live oak woodland and Douglas fir forest.
We attempted to collect ticks from a total of 347 transects, and used data from 311 transects for analyses of landscape variables and entomologic risk (excluding 36 transects that occurred on private property, or in habitat types that were rare e.g., eucalyptus woodland). The most parsimonious model for explaining nymphal abundance included site, soil type, and distance to roads, with a negative binomial distribution. However, equivalent models within two AIC units contained vegetation and elevation, also with negative binomial distribution (Table 2). Nymphs were more frequently found in coast live oak woodland (40.4% of transects) and desert/semi-desert scrub (48.0% of transects) habitats (Table 3).
Table 2. Results of model selection to explain nymphal I. pacificus abundance.
| Model | Model parameters | Df | Deviance | P | AIC |
|---|---|---|---|---|---|
| 1 | Site | 19 | 64.0 | <0.001 | 605.84 |
| Soil Type | 6 | 23.9 | <0.001 | ||
| Distance to roads | 1 | 4.6 | 0.033 | ||
| 2 | Site | 19 | 67.0 | <0.001 | 606.82 |
| Vegetation | 6 | 21.4 | 0.002 | ||
| Soil Type | 6 | 14.4 | 0.026 | ||
| Distance to roads | 1 | 4.8 | 0.029 | ||
| Elevation | 1 | 2.8 | 0.093 | ||
| 3 | Site | 19 | 66.7 | <0.001 | 607.64 |
| Vegetation | 6 | 21.3 | 0.002 | ||
| Soil Type | 6 | 10.7 | 0.026 | ||
| Distance to roads | 1 | 4.7 | 0.030 |
Table 3. Habitat classifications and entomologic risk of Borrelia.
| Habitat type | Number transects with I. pacificus nymphs/Number of transects | Abundance of nymphs/100m 2 (number of nymphs/total meters) | Mean nymph abundance if present in transects (range) | Borrelia spp. prevalence 1 | B. miyamotoi prevalence | B. burgdorferi ss prevalence | B. burgdorferi sl prevalence 2 |
|---|---|---|---|---|---|---|---|
| Coast live oak woodland | 42/102 (41.2%) | 3.1 (95/3060) | 2.3 (1–9) | N: 9/101 (8.9, 4.1–16.2) A: 3/42 (7.1, 1.5–19.5) | N: 4/101 (4.0, 1.1–9.8) | N: 1/101 (1.0, 0.02–5.4) | |
| Coastal scrub | 3/19 (15.8%) | 0.7 (4/570) | 1.3 (1–2) | ||||
| Desert/semi-desert scrub | 12/25 (48.0%) | 3.5 (26/750) | 2.2 (1–5) | ||||
| Douglas fir forest | 6/33 (18.2%) | 0.9 (9/990) | 1.5 (1–3) | N: 2/40 (5.0, 0.6–16.9) A: 3/26 (11.5, 2.4–30.2) | N: 1/40 (2.5, 0.06–13.2) A: 2/26 (7.7, 0.9–25.1) | N: 1/40 (2.5, 0.06–13.2) A: 1/26 (3.8, 0.1–19.6) | |
| Moderate grassland | 4/26 (15.4%) | 1.2 (9/780) | 2.3 (1–3) | ||||
| Redwood forest | 18/73 (24.7%) | 1.6 (35/2190) | 1.9 (1–4) | N: 8/71 (11.3, 5.0–21.0) A: 5/43 (11.6, 3.9–25.1) | N: 3/71 (4.2, 0.9–11.9) | N: 3/71 (4.2, 0.9–11.9) | |
| Warm grassland | 5/33 (15.2%) | 0.5 (5/990) | 1 (na) |
1Number ticks positive/Number ticks tested (% positive, 95% CI); N = nymphal I. pacificus; A = adult I. pacificus.
2Excluding Borrelia burgdorferi ss.
Borrelia-infection prevalence
Overall, we found Borrelia spp. in 10.6% (37/349) of nymphs and 8.1% (22/273) of adults (Table 4). Of the 59 qPCR positive samples we were able to obtain IGS sequence data from 26 nymphal samples and 9 adult samples. We found B. miyamotoi in nymphal ticks at 8/16 sites, ranging in prevalence from 2.4–33.3% when present, and at a total prevalence of 3.7% (13/349) for all examined nymphs (Table 4). Prevalence of B. miyamotoi in adults was 3.9–9.1% when observed (3 sites), and 1.8% for all tested adults (5/273) (Table 4). The agent of Lyme disease, B. burgdorferi ss, occurred at NIPs of 3.6–7.4% when present (5/16 sites), and in 2.0% (7/349) of all nymphs (Table 4). For B. burgdorferi sl (excluding B. burgdorferi ss), NIP ranged from 2.0–3.7% at the four sites where it was detected, and was 1.7% (6/349) overall (Table 4). For adult ticks, B. burgdorferi sl prevalence was 3.8–10% at the two sites we found it, and was 0.7% (2/273) overall (Table 4).
Table 4. Numbers of Ixodes pacificus ticks positive for Borrelia-infection from recreational areas in the San Francisco Bay area in May 2013.
Subtotals are also included for particular trails in Thornewood and Windy Hill OSPs to show within-site variation.
| Location | Nymphs 2013 | Adults 2013 | ||||||
|---|---|---|---|---|---|---|---|---|
| Borrelia spp. 1 | B miya | Bb ss | Bb sl | Borrelia spp. | B miya | Bb ss | Bbsl | |
| Marin Co. | ||||||||
| China Camp State Park (SP) | 1/10 (10, 0.3–44.5) | 1/10 (10, 0.3–44.5) | 0/2 | |||||
| Napa Co. | ||||||||
| Bothe-Napa SP | 2/38 (5.3, 0.6–17.7) | 1/38 (2.6, 0.1–13.8) | 1/38 (2.6, 0.1–13.8) | 3/26 (11.5, 2.4–30.1) | 2/26 (7.7, 0.9–25.1) | 1/26 (3.8, 0.1–19.6) | ||
| San Mateo Co. | ||||||||
| Corte De Madera Open Space Preserve (OSP) | 0/6 | 0/6 | 0/3 | |||||
| Jasper Ridge Biological Preserve | 0/3 | 3/28 (10.7, 2.3–28.2) | ||||||
| Los Trancos OSP | 4/27 (14.8, 4.2–33.7) | 2/27 (7.4, 0.9–24.3) | 1/10 (10, 0.3–44.5) | 1/10 (10, 0.3–44.5) | ||||
| Pulgas Ridge OSP | 0/6 | 1/11 (9.1, 0.2–41.3) | ||||||
| Thornewood OSP total | 5/28 (17.9, 6.0–36.9) | 3/28 (10.7, 2.3–28.2) | 1/29 (3.4, 0.1–17.8) | |||||
| Thornewood OSP: Schilling Lake Trail (coast live oak woodland) | 2/19 (10.5, 1.3–33.1) | 0/26 | ||||||
| Thornewood OSP: Bridle Trail (redwood forest) | 3/9 (33.3, 7.5–70.1) | 3/9 (33.3, 7.5–70.1) | 1/3 (33.3, 0.8–90.6) | |||||
| Windy Hill OSP total | 6/55 (10.9, 4.1–22.2) | 2/55 (3.6, 0.4–12.5) | 1/55 (1.8, 0.05–9.7) | 4/25 (16.0, 4.5–36.1) | 1/25 (4.0, 0.1–20.4) | |||
| Windy Hill OSP–Betsy Crowder Trail | 5/51 (9.8, 3.3–21.4) | 2/51 (3.9, 0.5–13.5) | 1/51 (2.0, 0.04–10.4) | 2/4 (50.0, 6.8–93.2) | ||||
| Windy Hill OSP–Anniversary Trail | 0/10 | |||||||
| Windy Hill OSP–Meadow Trail | 1/4 (25.0, 0.6–80.6) | 2/11 (18.2, 2.3–51.8) | 1/11 (9.1, 0.2–41.3) | |||||
| Wunderlich Co. Pk. | 2/27 (7.4, 0.9–24.3) | 1/27 (3.7, 0.1–19.0) | 0/22 | |||||
| Santa Clara Co. | ||||||||
| Foothills Park | 5/27 (18.5, 6.3–38.1) | 2/27 (7.4, 0.9–24.3) | 1/27 (3.7, 0.1–19.0) | 1/27 (3.7, 0.1–19.0) | 5/51 (9.8, 3.3–21.4) | 2/51 (3.9, 0.5–13.5) | 2/51 (3.9, 0.5–13.5) | |
| Hidden Villa | 3/28 (10.7, 2.3–28.2) | 1/28 (3.6, 0.1–18.3) | 1/28 (3.6, 0.1–18.3) | 1/28 (3.6, 0.1–18.3) | 0/9 | |||
| Monte Bello OSP | 2/20 (10, 1.2–31.7) | 2/20 (10, 1.2–31.7) | 0/37 | |||||
| Sierra Azul OSP | 0/2 | 0/1 | ||||||
| Santa Cruz Co. | ||||||||
| Castle Rock SP | 0/2 | |||||||
| Sonoma Co. | ||||||||
| Annadel SP | 4/41 (9.8, 2.7–23.1) | 1/41 (2.4, 0.1–12.9) | 0/4 | |||||
| Jack London SP | 3/29 (10.3, 2.2–27.4) | 2/29 (6.9, 0.8–22.8) | 4/15 (26.7, 7.8–55.1) | |||||
| Total | 37/349 (10.6, 7.6–14.3) | 13/349 (3.7, 2.0–6.3) | 7/349 (2.0, 0.8–4.1) | 6/349 (1.7, 0.6–3.7) | 22/273 (8.1, 5.1–11.9) | 5/273 (1.8, 0.6–4.2) | 2/273 (0.7, 0.1–2.6) | 2/273 (0.7, 0.1–2.6) |
1Number positive/number tested (percentage positive, exact binomial 95% CI). Prevalence data for ticks categorized by habitat were difficult to determine, as many of the Borrelia-positive samples were from the ticks collected off-transect. By including ticks from recreational areas where the GIS-informed habitat type could be ascertained without ambiguity, we derived prevalence data for sufficient numbers of ticks from three vegetation types (Table 3). There were no significant differences between prevalence of infection with Borrelia spp. in the three vegetation types.
Prevalence data for ticks categorized by habitat were difficult to determine, as many of the Borrelia-positive samples were from the ticks collected off-transect. By including ticks from recreational areas where the GIS-informed habitat type could be ascertained without ambiguity, we derived prevalence data for sufficient numbers of ticks from three vegetation types (Table 3). There were no significant differences between prevalence of infection with Borrelia spp. in the three vegetation types.
Density of infected nymphs (DIN)
Combining DON and NIP to generate DIN measures showed that exposure risk for tick-borne Borrelia spp. (number of Borrelia-infected nymphs/100m2) also varies widely, but was highest in transects that occurred in coast live oak-dominated woodlands, e.g., Windy Hill OSP–Betsy Crowder (1.0), Annadel State Park (0.6), Los Trancos OSP (0.5), and Foothills Park (0.4) (Table 1). Across all sites, DIN was largely equivalent for all three Borreliae detected on transects, though with idiosyncrasies. For example, in Thornewood OSP, tick density–and therefore sample size–was low in redwood habitat but B. miyamotoi NIP was high (33.3%), generating a DIN of 0.2/100m2. In contrast, in coast live oak woodland habitats within Thornewood OSP, nymphs were abundant (3.1/100m2, 4th highest density) but we did not observe ticks infected with B. miyamotoi.
Comparisons with other California Borrelia studies
The prevalence of B. miyamotoi is higher in our study area compared to nearby Alameda County [6], for both nymphal and adult ticks (Table 5). B. burgdorferi prevalence in nymphs was higher in Alameda County than in our study sites, though there was no appreciable difference in B. burgdorferi prevalence in adult ticks in both areas. It should be noted that sampling methods and PCR analyses may differ between our study and the study performed in Alameda County, and so these results should be interpreted with caution.
Table 5. Prevalence data for Borrelia in I. pacificus ticks from previous studies in California.
| Location | Tick life stage | B. miyamotoi prevalence 1 | B. burgdorferi sl prevalence | B. burgdorferi ss prevalence | Reference |
|---|---|---|---|---|---|
| Bay Area | Nymphs | 13/349 (3.7, 2.0–6.3) | 11/349 (3.2, 1.6–5.6) | 7/349 (2.0, 0.8–4.1) | This study |
| Bay Area | Adults | 5/273 (1.8, 0.6–4.2) | 4/273 (1.5, 0.4–3.7) | 2/273 (0.7, 0.1–2.6) | This study |
| Bay Area | Adults | 14/1108 (1.3, 0.7–2.1) | 13/1108 (1.2, 0.6–2.0) | 6/1108 (0.5, 0.2–1.2) | Salkeld et al. 2014 |
| Alameda County | Nymphs | 11/2890 (0.4, 0.2–0.7) | 189/2890 (6.5, 5.6–7.5) | 145/2890 (5.0, 4.3–5.9) | Fedorova et al. 2014 |
| Alameda County | Adults | 13/3070 (0.4, 0.2–0.7) | 29/3070 (0.9, 0.6–1.4) | 23/3070 (0.7, 0.4–1.1) | Fedorova et al. 2014 |
| Mendocino Co. | Nymphs | 264/5431 (4.9, 4.3–5.5) | Eisen et al. 2010 |
1Number positive/number tested (percentage positive, 95% CI).
Prevalence of Borreliae did not differ in adult ticks that were collected in 2013 (this study) and 2012 [12] in similar areas (B. miyamotoi: χ2 = 0.19, p = 0.67; B. burgdorferi ss: χ2 = 0.005, p = 0.94; B. burgdorferi sl: χ2 = 0.007, p = 0.93). B. burgdorferi prevalence was lower for nymphs in this study when compared to nymphs with B. burgdorferi ss in Mendocino County [2].
Discussion
Our tick surveillance data echo recent studies that show that Borrelia spp. are ubiquitous in the Bay Area where western black-legged ticks are abundant [6, 11–12, 24]. Our model linking tick abundance with landscape attributes did reveal a few significant statistical associations. Vegetation type, soil type, site and distance to roads were found to be significant factors influencing nymphal abundance. However, there were no significant differences between prevalence of infection with Borrelia spp. in different vegetation types. Exposure risk for tick-borne Borrelia spp. varied widely across the landscape, but was highest in coast live oak-dominated woodlands. These spatial associations are likely too weak to serve as a basis for a spatial targeting of preventive public health policies and information campaigns for recreational areas in the Bay Area. A larger sample size and repeated sampling over the season and over multiple years would be required to support such policies. However, these results do suggest that tick abundance may be idiosyncratic with respect to particular recreational areas. A locally-specific knowledge of local risk of tick exposure could promote tick-borne disease awareness and appropriate preventative measures.
The recent revelation that B. miyamotoi can cause disease in humans [7–8, 10] has prompted increased surveillance for this pathogen in tick populations. Adult ticks exhibited a B. miyamotoi prevalence of 1.8% (5/273 adults), which is similar with adult ticks sampled from many of the same sites in 2012 (1.3%; 14/1108 ticks) [12]. The 2012 prevalence was garnered by testing pooled samples of adult ticks, and therefore is a minimum estimate of prevalence, and may account for the slightly lower prevalence estimates from 2012.
Our data for recreational areas in the San Francisco Bay Area shows that B. miyamotoi prevalence in nymphs and adults is roughly equivalent to that of B. burgdorferi sensu lato (sl). This is in contrast to other regions in the United States—e.g., B. burgdorferi is the dominant spirochete within nymphal I. scapularis in the north-eastern US [25]. Similarly, in Sweden and Japan, B. miyamotoi is less commonly found than other Borreliae that cause Lyme-borreliosis—i.e., B. burgdorferi, B. garinii and B. afzelii [26–27]. Even at a more local scale, B. miyamotoi prevalence is higher in our study sites compared to ticks in nearby Alameda County [6].
We cannot yet explain why there is such an equivalent rate of B. miyamotoi and B. burgdorferi infection in I. pacificus ticks in our study area of California, though we surmise that factors such as reservoir host ecology, tick abundance and phenology, transmission dynamics and habitat heterogeneity may all have some influence. For example, horizontal transmission of B. miyamotoi can occur during co-feeding of naïve larvae and infected nymphs (I. scapularis), and subsequently for at least three weeks [25]. The simultaneous questing activity of I. pacificus larvae and nymphs in California, in comparison with a more asynchronous phenology of I. scapularis larvae and nymphs in the north-east, hypothetically allows the potential for increased transmission of B. miyamotoi during co-feeding and may account for higher relative abundance of in the Bay area. It is important to note that, unlike B. burgdorferi, B. miyamotoi can be transmitted trans-ovarially [25]. Furthermore, vertebrate hosts may differ in abundance and reservoir potential (the ability to infect feeding ticks) compared to areas that have received more attention e.g., Mendocino County where western gray-squirrels are one of the predominant reservoir hosts of B. burgdorferi ss [1, 28–29].
Density of nymphal ticks (DIN) varied widely, and when combined with data on the prevalence of pathogens suggests that disease risk varies widely. Reports on density of infected nymphs are not as common as reports of pathogen prevalence, so generalizations are difficult to make. In Mendocino County, densities of B. burgdorferi ss infected I. pacificus nymphs from 0–2.04/100m2, with a median density of 0.06/100m2 [2]. Estimates of DIN from our study are lower than the Mendocino County ranges: 0–1.0 when considering Borrelia, but smaller values for B. burgdorferi. This may be attributable to higher densities of ticks in Mendocino County. This emphasizes the point that multiple measures of disease risk need to be gathered [30].
With regards to bites by western black-legged ticks in the San Francisco Bay area, B. miyamotoi potentially poses as much risk of transmission to humans as B. burgdorferi. We are unaware of any reports documenting human incidence rates of B. miyamotoi in California, and this remains an unknown public health concern. In the north-east, seroprevalence rates (using IgG antibodies) in human populations ranges from 3.6% to 9.8% depending on specifics of the subject group e.g., within a study of 639 heathy participants from Rhode Island and Massachusetts, seroprevalence of B. miyamotoi infection was 3.9% (compared to 9.4% for B. burgdorferi) [31]. Thus, B. miyamotoi infection is not a rare infection in the northeastern United States [32].
In these areas of the northeastern United States where human seroprevalence has been examined, rates of B. miyamotoi infection in nymphal I. scapularis ticks are low: 1.1–1.6% in Rhode Island, and 2.5% in Massachusetts [18, 25]. Tick densities of 4.9 (SD = 23.5) nymphs per 100 m transect have been reported from Block Island in Rhode Island state [33]. By comparison, in our California study sites, nymphal infection prevalence of B. miyamotoi in our California study sites is higher (3.8% overall), though nymphal tick densities tend to be lower (Table 2).
Diagnosis of Borrelia miyamotoi disease can be complicated. B. miyamotoi infections may be misdiagnosed (e.g., for human granulocytic anaplasmosis) if the diagnosis is based only on clinical examinations, and not confirmed by specific laboratory assays [34]. Additionally, there may be previous exposure to B. burgdorferi, which can complicate interpretations of diagnostic tests [32]. Nonetheless, further research is needed to address the potential incidence of B. miyamotoi disease in human populations exposed to this pathogen in California, especially in areas where B. miyamotoi prevalence in tick populations is relatively high.
Overall, our data demonstrate that the ecology of Borrelia pathogens in California is highly variable at small geographical scales. Consequently, public health agencies and physicians should recognize that diverse disease risk and pathogen ecology may culminate in tick-borne diseases that demonstrate symptoms that are not entirely consistent with infections with B. burgdorferi s.s. Similarly, our results illustrate western black-legged ticks and their pathogens are ubiquitous in the San Francisco Bay Area, and therefore the general public should incorporate tick-bite prevention procedures when pursuing recreational activities in the locality.
Acknowledgments
We thank the Midpeninsular Regional Open Space District, San Mateo County Parks, Jasper Ridge Biological Preserve, City of Palo Alto, the Horse Park at Woodside, and California State Parks for permission to collect ticks. We also thank local community members of Portola Valley and Woodside and California Department of Public Health’s Vector-Borne Disease Section for assistance in collecting ticks.
Data Availability
Data are available at Genbank under accession numbers KT343318-KT343351.
Funding Statement
This study was supported by a grant from the Bay Area Lyme Foundation, http://www.bayarealyme.org/, to DJS, NCN and EL. The funders had no role in study design, data collection and analysis, decision to publish, or preparation of the manuscript.
References
- 1. Eisen L, Eisen RJ, Mun J, Salkeld DJ, Lane RS. Transmission cycles of Borrelia burgdorferi and B. bissettii in relation to habitat type in northwestern California. J Vector Ecol. 2009;34: 81–91. 10.3376/038.034.0110 [DOI] [PMC free article] [PubMed] [Google Scholar]
- 2. Eisen RJ, Eisen L, Girard YA, Fedorova N, Mun J, Slikas B, et al. A spatially-explicit model of acarological risk of exposure to Borrelia burgdorferi-infected Ixodes pacificus nymphs in northwestern California based on woodland type, temperature, and water vapor. Ticks Tick-Borne Dis. 2010;1: 35–43. 10.1016/j.ttbdis.2009.12.002 [DOI] [PMC free article] [PubMed] [Google Scholar]
- 3. Eisen RJ, Lane RS, Fritz CL, Eisen L. Spatial patterns of Lyme disease risk in California based on disease incidence data and modeling of vector-tick exposure. Am J Trop Med Hyg. 2006;75: 669–676. [PubMed] [Google Scholar]
- 4. Girard YA, Travinsky B, Schotthoefer A, Fedorova N, Eisen RJ, Eisen L, et al. Population structure of the Lyme borreliosis spirochete Borrelia burgdorferi in the western black-legged tick (Ixodes pacificus) in northern California. App Environ Microbiol 2009;75: 7243–7252. [DOI] [PMC free article] [PubMed] [Google Scholar]
- 5. Lane RS, Mun J, Peribáñezc MA, Fedorova N. Differences in prevalence of Borrelia burgdorferi and Anaplasma spp. infection among host-seeking Dermacentor occidentalis, Ixodes pacificus, and Ornithodoros coriaceus ticks in northwestern California. Ticks Tick-Borne Dis. 2010;1: 159–167. 10.1016/j.ttbdis.2010.09.004 [DOI] [PMC free article] [PubMed] [Google Scholar]
- 6. Fedorova N, Kleinjan JE, James D, Hui LT, Peeters H, Lane RS. Remarkable diversity of tick or mammalian-associated Borreliae in the metropolitan San Francisco Bay Area, California. Ticks Tick-Borne Dis. 2014;5: 951–961. 10.1016/j.ttbdis.2014.07.015 [DOI] [PubMed] [Google Scholar]
- 7. Platonov AE, Karan LS, Kolyasnikova NM, Makhneva NA, Toporkova MG, Maleev VV, et al. Humans infected with relapsing fever spirochete Borrelia miyamotoi, Russia. Emerg Infect Dis. 2011;17: 1816–1823. 10.3201/eid1710.101474 [DOI] [PMC free article] [PubMed] [Google Scholar]
- 8. Gugliotta JL, Goethert HK, Berardi VP, Telford SR III. Meningoencephalitis from Borrelia miyamotoi in an immunocompromised patient. New Engl J Med. 2013;368: 240–245. 10.1056/NEJMoa1209039 [DOI] [PMC free article] [PubMed] [Google Scholar]
- 9. Crowder CD, Carolan HE, Rounds MA, Honig V, Mothes B, Haag H, et al. Prevalence of Borrelia miyamotoi in Ixodes ticks in Europe and the United States. Emerg Infect Dis. 2014;20: 1678–1682. 10.3201/eid2010.131583 [DOI] [PMC free article] [PubMed] [Google Scholar]
- 10. Krause PJ, Narasimhan S, Wormser GP, Rollend L, Fikrig E, Lepore T, et al. Human Borrelia miyamotoi infection in the United States. New Engl J Med. 2013;368: 291–293. [DOI] [PMC free article] [PubMed] [Google Scholar]
- 11. Padgett KA, Bonilla DL, Kjemtrup A, Vilcins I-M, Yoshimizu MH, Hui L, et al. Large scale spatial risk and comparative prevalence of Borrelia miyamotoi and Borrelia burgdorferi sensu lato in Ixodes pacificus PLoS ONE 2014;9(10): e110853 10.1371/journal.pone.0110853 [DOI] [PMC free article] [PubMed] [Google Scholar]
- 12. Salkeld DJ, Cinkovich S, Nieto NC. Tick-borne pathogens in northwestern California, USA. Emerg Infect Dis. 2014;20: 493–494. 10.3201/eid2003.130668 [DOI] [PMC free article] [PubMed] [Google Scholar]
- 13. Foley JE, Nieto NC, Foley P. Emergence of tick-borne granulocytic anaplasmosis associated with habitat type and forest change in northern California. Am J Trop Med Hyg 2009;81: 1132–1140. 10.4269/ajtmh.2009.09-0372 [DOI] [PubMed] [Google Scholar]
- 14. Shapiro MR, Fritz CL, Tait K, Paddock CD, Nicholson WL, Abramowicz KF, et al. Rickettsia 364D: a newly recognized cause of eschar-associated illness in California. Clin Infect Dis. 2010;50: 541–548. 10.1086/649926 [DOI] [PubMed] [Google Scholar]
- 15. Salkeld DJ, Castro MB, Bonilla D, Kjemtrup A, Kramer VL, Lane RS, et al. Seasonal activity patterns of the western black-legged tick, Ixodes pacificus, in relation to onset of human Lyme disease in northwestern California. Ticks Tick-Borne Dis. 2014;5: 790–796. 10.1016/j.ttbdis.2014.05.002 [DOI] [PubMed] [Google Scholar]
- 16.Bay Area Open Space Council. The Conservation Lands Network: San Francisco Bay Area Upland Habitat Goals Project Report. Berkeley, CA. 2011. https://www.dropbox.com/s/09wjvsdvydsr3nd/CLN%201.0%20Original%20Report.pdf?dl=0
- 17.Soil Survey Staff, Natural Resources Conservation Service, United States Department of Agriculture. Web Soil Survey. Available online at http://websoilsurvey.nrcs.usda.gov/. Accessed [3/1/2011], additional link with metadata: http://www.nrcs.usda.gov/wps/portal/nrcs/detail/soils/survey/geo/?cid=nrcs142p2_053629
- 18. Barbour AG, Bunikis J, Travinsky B, Hoen AG, Diuk-Wasser MA, Fish D, et al. Niche partitioning of Borrelia burgdorferi and Borrelia miyamotoi in the same tick vector and mammalian reservoir species. Am J Trop Med Hyg. 2009;81: 1120–1131. 10.4269/ajtmh.2009.09-0208 [DOI] [PMC free article] [PubMed] [Google Scholar]
- 19. Bunikis J, Garpmo U, Tsao J, Berglund J, Fish D, Barbour AG. Sequence typing reveals extensive strain diversity of the Lyme borreliosis agents Borrelia burgdorferi in North America and Borrelia afzelii in Europe. Microbiol 2004;150: 1741–1755. [DOI] [PubMed] [Google Scholar]
- 20. Crawley MJ. Statistics: an introduction using R 1st ed. Chichester, UK: John Wiley & Sons; 2005. [Google Scholar]
- 21. Newman EA, Eisen L, Eisen RJ, Fedorova N, Hasty JM, Vaughn C, et al. Borrelia burgdorferi sensu lato spirochetes in wild birds in northwestern California: associations with ecological factors, bird behavior and tick infestation. PLoS ONE 2015;10(2): e0118146 10.1371/journal.pone.0118146 [DOI] [PMC free article] [PubMed] [Google Scholar]
- 22. Akaike H. A new look at the statistical model identification. IEEE Trans Automat Contr. 1974;19: 716–723. [Google Scholar]
- 23. Burnham KP, Anderson DR. Model selection and multimodel inference: a practical information-theoretic approach 2nd ed. New York: Springer; 2003. [Google Scholar]
- 24. Holden K, Boothby JT, Anand S, Massung RF. Detection of Borrelia burgdorferi, Ehrlichia chaffeensis, and Anaplasma phagocytophilum in ticks (Acari: Ixodidae) from a coastal region of California. J Med Entomol. 2003;40: 534–539. [DOI] [PubMed] [Google Scholar]
- 25. Scoles GA, Papero M, Beati L, Fish D. A relapsing fever group spirochete transmitted by Ixodes scapularis ticks. Vector-borne Zoon Dis. 2001;1: 21–34. [DOI] [PubMed] [Google Scholar]
- 26. Wilhelmsson P, Fryland L, Börjesson S, Nordgren J, Bergström S, Ernerudh J, et al. Prevalence and diversity of Borrelia species in ticks that have bitten humans in Sweden. J Clin Microbiol. 2010;48: 4169–4176. 10.1128/JCM.01061-10 [DOI] [PMC free article] [PubMed] [Google Scholar]
- 27. Taylor KR, Takano A, Konnai S, Shimozuru M, Kawabata H, Tsubota T. Borrelia miyamotoi infections among wild rodents show age and month independence and correlation with Ixodes persulcatus larval attachment in Hokkaido, Japan. Vector-borne Zoon Dis. 2013;13: 92–97. [DOI] [PubMed] [Google Scholar]
- 28. Salkeld DJ, Leonhard S, Girard YA, Hahn N, Mun J, Padgett KA, et al. Identifying the reservoir hosts of the Lyme disease spirochete Borrelia burgdorferi in California: the role of western gray squirrels (Sciurus griseus). Am J Trop Med Hyg. 2008;79: 535–540. [PMC free article] [PubMed] [Google Scholar]
- 29. Salkeld DJ, Lane RS. Community ecology and disease risk: lizards, squirrels and the Lyme disease spirochete in California. Ecology 2010;91: 293–298. [DOI] [PubMed] [Google Scholar]
- 30. Salkeld DJ, Padgett KA, Jones JH. A meta-analysis suggesting that the relationship between biodiversity and risk of zoonotic pathogen transmission is idiosyncratic. Ecol Lett. 2013;16: 679–686. 10.1111/ele.12101 [DOI] [PMC free article] [PubMed] [Google Scholar]
- 31. Krause PJ, Narasimhan S, Wormser GP, Barbour AG, Platonov AE, Brancato J, et al. Borrelia miyamotoi sensu lato seroreactivity and seroprevalence in the northeastern United States. Emerg Infect Dis. 2014; 20: 1183–1190. 10.3201/eid2007.131587 [DOI] [PMC free article] [PubMed] [Google Scholar]
- 32. Molloy PJ, Telford SR III, Chowdri HR, Lepore TJ, Gugliotta JL, Weeks KE, et al. Borrelia miyamotoi disease in the northeastern United States: a case series. Ann Intern Med 2015; 10.7326/M15-0333 [DOI] [PubMed] [Google Scholar]
- 33. Finch C, Al-Damluji MS, Krause PJ, Niccolai L, Steeves T, O’Keefe CF, et al. (2014) Integrated assessment of behavioral and environmental risk factors for Lyme Disease infection on Block Island, Rhode Island. PLoS ONE 9(1): e84758 10.1371/journal.pone.0084758 [DOI] [PMC free article] [PubMed] [Google Scholar]
- 34. Chowdri HR, Gugliotta JL, Berardi VP, Goethert HK, Molloy PJ, Sterling SL, et al. Borrelia miyamotoi infection presenting as human granulocytic anaplasmosis: a case report. Ann Intern Med. 2013;159: 21–27. 10.7326/0003-4819-159-1-201307020-00005 [DOI] [PubMed] [Google Scholar]
Associated Data
This section collects any data citations, data availability statements, or supplementary materials included in this article.
Data Availability Statement
Data are available at Genbank under accession numbers KT343318-KT343351.