

Abstract
Recent studies have shown that differentiated cancer cells can de-differentiate into cancer stem cells (CSCs) although to date no studies have reported whether this transition is influenced by systemic anti-cancer agents. Valproic acid (VA) is a histone deacetylase (HDAC) inhibitor that promotes self renewal and expansion of hematopietic stem cells and facilitates the generation of induced pluripotent stem cells from somatic cells and is currently being investigated in breast cancer clinical trials. We hypothesized that HDAC inhibitors reprogram differentiated cancer cells towards the more resistant stem cell-like state. Two highly aggressive breast cancer cell lines, SUM159 and MDA-231, were FACS-sorted based on ALDH activity and subsequently ALDH-negative and ALDH-positive cells were treated with one of two known HDAC inhibitors, VA or SAHA (suberoylanilide hydroxamic acid). In addition, primary tumor cells from patients with metastatic breast cancer were evaluated for ALDH activity following treatment with HDAC inhibitors. We demonstrate that single cell sorted ALDH- negative cells spontaneously generated ALDH-positive cells in vitro. Treatment of ALDH-negative cells with HDAC inhibitors promoted the expansion of ALDH-positive cells and increased mammosphere forming efficiency. Most importantly, it significantly increased the tumor-initiating capacity of ALDH- negative cells in limiting dilution outgrowth assays. Moreover, while HDAC inhibitors upregulated β-catenin expression and significantly increased WNT reporter activity, a TCF4 dominant negative construct abolished HDAC-inhibitor induced expansion of CSCs. These results demonstrate that HDAC inhibitors promote the expansion of breast CSCs through dedifferentiation and have important clinical implications for the use of HDAC inhibitors in the treatment of cancer.
Keywords: breast cancer stem cells, HDAC inhibitors, dedifferentiation, β-catenin
INTRODUCTION
It has been shown that many human cancers, including breast cancer, are maintained by a small population of cells called cancer stem cells (CSCs, also called tumor initiating cells). These cells possess an enhanced tumor-initiating capacity in mouse xenograft models, can self-renew and are capable of differentiating into the multiple lineages of the bulk tumor. Human breast CSCs can be enriched by specific cell surface markers such as CD44+CD24−/low, by aldehyde dehydrogenase (ALDH) enzyme activity as ALDH-positive cells, and by mammosphere formation in growth factor supplemented suspension culture, although the results of these three assays are not always equivalent 1–3. Increasing pre-clinical and translational evidence suggests that CSCs mediate tumor metastasis 4–7 and are resistant to conventional anti-cancer therapeutics that contribute to relapse 8–11. The evolving cancer stem cell theory has led to the proposal that targeting CSCs in combination with conventional or other targeted therapies may be required to eradicate cancer and efforts are underway to identify compounds that target this subpopulation 9, 12–15.
Several recent studies have demonstrated that CSCs and non-CSCs exhibit plasticity with a transition from one state to the other 16–19. These findings represent a divergence from the unidirectional hierarchical model of CSCs and raise the possibility that approaches to solely target CSCs will not be sufficient because the remaining non-CSCs may be reprogrammed to CSCs to reinitiate tumorigenesis. However, the potential of clinically available systemic anti-cancer agents to mediate this transition has not yet been studied.
Histone deacetylase (HDAC) inhibitors such as valproic acid (VA) and trichostatin-A stimulate the self-renewal and expansion of normal hematopoietic stem cells20–22. Similarly, the clonogenic capacity of CD34+ AML progenitor cells was enhanced with VA treatment in AML patients 23. Moreover, HDAC inhibitors, in particular VA, enables efficient reprogramming of adult somatic cells into pluripotent stem cells 24. In support of these findings, we recently demonstrated that VA has a differential effect on in vitro stem-like breast cancer cell cultures compared to in vitro differentiated breast cancer cells: radioprotecting the stem-like cells and radiosensitizing the differentiated cells 25. These observations led us to hypothesize that HDAC inhibitors increase the CSC population through dedifferentiation of non-stem cancer cells shifting the equilibrium towards the stem cell-like phenotype. Using the highly aggressive breast cancer cell lines SUM159 and MDA-231 as well as primary breast cancer cells derived from patients, we found that treatment with HDAC inhibitors increase ALDH activity, mammosphere forming efficiency and the tumor-initiating capacity of non-stem like cells and this effect was mediated through the β-catenin signaling pathway.
MATERIALS AND METHODS
Cell culture
The SUM159 cell line was obtained from Dr Stephen Ethier and is commercially available (Asterand, Detroit, MI). SUM159 cells were cultured in Ham’s F-12 media supplemented with 10% fetal bovine serum (FBS), 1 μg/ml hydrocortisone, 5 μg/ml insulin and 1% antibiotic-antimycotic. MDA-231 cells were obtained from ATCC and were cultured in α-media supplemented with 10% FBS, 1 μg/ml hydrocortisone, 1 μg/ml insulin, 12.5ng/ml EGF, sodium pyruvate, non-essential amino acids, 2mM Glutamine and 1% antibiotic-antimycotic.
VA (sodium salt; Sigma) was dissolved in PBS to a stock concentration of 1M and stored at 4°C. A final concentration of 1mM of VA, a dose we used in our previous study 25, was used to treat SUM159 cells. SAHA (Cayman) was dissolved in DMSO to a stock of 0.5M and stored at −80°C and a final concentration of 1μM was used for SUM159 cells based on a dose response study (data not shown). For MDA-231 cells, a dose of 0.5mM VA and 0.5μM SAHA was used to treat cells. Salinomycin (Sigma) was dissolved in DMSO at a stock concentration of 10mM and stored at −80°C and a final concentration of 10nM was used in this study.
Patient tumor cells
Cells from patient’s pleural fluid were obtained on an IRB approved protocol from patients undergoing thoracentesis for relief of pulmonary symptoms. Briefly, the pleural fluid was centrifuged at 400g for 30 min and pellets were suspended in PBS/HBSS and filtered through 40 μM cell strainer. Suspended cells were added to the top of 12.5ml Ficoll solution and the mix was spun at 2000 rpm for 30 minutes. Centrifuged cells were then washed three times with PBS and seeded into tissue culture plates using SUM159 media. After cells became confluent, they were passaged, treated with vehicle or HDAC-inhibitors for a week and samples collected for analysis. Three patient samples were included in this study: patient sample 1 (inflammatory breast cancer; ER+ PR− Her2/neu−), patient sample 2 (inflammatory breast cancer; ER+ (low) PR− Her2/neu−), and patient sample 3 (non inflammatory breast cancer; ER+ PR+ Her2/neu−).
DNA plasmids
The 7TGP, an eGFP expressing WNT activity reporter construct and the EdTP, a construct that expresses the dominant negative human TCF4 have been previously described by Nusse’s group 26 and were purchased from Addgene. The vector control was generated after removing the dominant negative TCF4 gene from the EdTP plasmid through digestion with BamHI and self ligating with the T4 ligase. All constructs were verified by sequencing the region of interest. Following transduction, cells were selected with 2mg/ml puromycin.
Aldefluor assay and sorting of ALDH negative/positive population
The Aldefluor assay was carried out following the manufacturer’s guidelines (StemCell Technologies, Vancouver, Canada). Briefly, about 5 × 10⁵ cells were suspended in Aldefluor assay buffer containing ALDH substrate and incubated for 30 min at 37°C. As a negative control for each sample cells were incubated with 50 mmol/L of the specific ALDH inhibitor diethylaminobenzaldehyde (DEAB). Aldefluor fluorescence was excited at 488 nm and fluorescence emission was detected using a Beckman Coulter machine and the data files were analyzed using FlowJo software (Treestar, Ashland, OR). For sorting, gates were established using ALDH-stained cells treated with DEAB as negative controls and taking the high negative and positive cells (Fig. 1A).
Figure 1. HDAC inhibitors expand the CSC-like population.
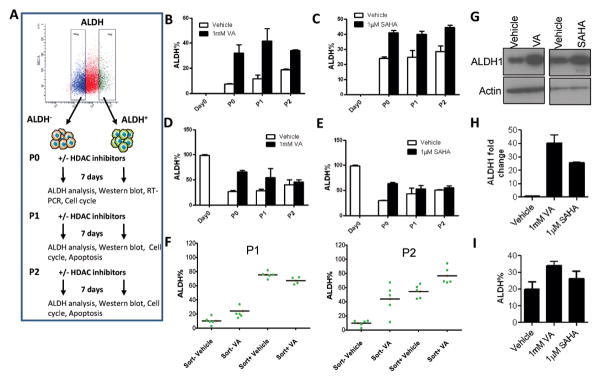
(A) Flow cytometry plot illustrating the gating strategy used to isolate subpopulations of SUM159 and MDA-231 cells based on ALDH activity as well as the generation of the different passages described in this paper. Gating is set to DEAB-inhibitor control cells. (B&C) Percentage of ALDH+ cells from SUM159 ALDH− cells pre-treated for 7 days with either 1mM valproic acid (VA) or 1μM suberoylanilide hydroxamic acid (SAHA) or vehicle (DMSO). Results are mean ± SEM from at least 2 biological replicates. Variation in ALDH% was sometimes observed depending on culture conditions and the kit, but the proportional fold increase was similar in vehicle vs HDAC inhibitor-treated cells. (D&E) Percentage of ALDH+ cells generated from SUM159 sorted ALDH+ cells pretreated for 7 days with either 1mM valproic acid (VA) or 1μM suberoylanilide hydroxamic acid (SAHA) or vehicle (DMSO). Results are mean ± SEM from at least 2 biological replicates. (F) ALDH percentage in single cell derived clones from sorted ALDH− or ALDH+ cells in the presence or absence of 1mM VA. (G) Immunoblot with anti-ALDH1 antibody in ALDH− cells treated with 1mM VA, 1μM SAHA or vehicle control. (H) Quantitative RT- PCR of ALDH1 expression in the ALDH− SUM159 cells treated with 1mM VA, 1μM SAHA or vehicle control. Data are represented as fold change relative to vehicle ± SEM. GAPDH was used as internal control. (I) Average percentage of ALDH+ cells in patient samples pre-treated with 1mM VA, 1μM SAHA or vehicle control. Results are mean ± SEM (N=3).
For single cell clonal analysis, ALDH− and ALDH+ SUM159 cells were single-cell deposited using FACSAria II (BD Biosciences) onto 24-well tissue culture plates in the presence or absence of 1mM VA. About three weeks later, five clones from each group were selected (P1) and expanded to analyze the ALDH content. These clones were then passaged for a week in the presence or absence of VA (P2) and the ALDH content analyzed. Similar single cell deposition onto 24-well plates were also performed for the GFP− and GFP+ WNT/Beta-catenin reporter cells in the presence or absence of 1mM VA (P1), clones were then expanded to evaluate the GFP content. These clones were passaged after a week (P2) and then for a third time (P3) in the presence or absence of VA.
RNA isolation and RT-PCR
Total RNA was isolated using Trizol reagent (Invitrogen) according to manufacturer’s protocol. After treatment with DNase I (Ambion), two micrograms of the RNA samples were reverse-transcribed with random hexamers using Super Script III First-Strand Synthesis System (Invitrogen). Control reactions excluded reverse transcriptase. Quantitative PCR was performed on 7300 Real-Time PCR equipment (Applied Biosystems) with aliquots of the cDNA samples and SYBR Green/ROX qPCR Master Mix (SABiosciences) at annealing temperature of 60°C with the following primers: ALDH1, forward 5′-ccgggaaaagcaatctgaag-3′ and reverse 5′-aacactggccctggtggtag-3′; GAPDH, forward 5′-cccactcctccacctttgac-3′ and reverse 5′-tggtggtccaggggtcttac-3′. For EMT-related mRNA gene expression analysis, EMT PCR Array (PAHS-090) was used as per the manufacture’s protocol (SABiosciences).
Mammosphere formation efficiency
To generate primary mammospheres, treated and untreated cells were grown in serum-free, growth factor enriched (mammosphere media) in low attachment plates as described previously 3,25. For secondary mammosphere assay, cells from primary mammospheres were dispersed with 0.05% trypsin, seeded in 6-well ultra-low attachment plates (10,000 cells/ml) in mammosphere media and counted after a week. Mammosphere media did not contain HDAC inhibitors throughout the duration of the mammosphere formation assays.
Immunoblotting
Cells were lysed in 1x RIPA lysis buffer containing 1 μM PMSF and 40 μg protein electrophoresed on 4–20% gradient SDS-polyacrylamide gels (Invitrogen). Membranes were incubated with primary antibodies: anti-ALDH1, anti-N-cadherin, anti-E-cadherin, anti-Fibronectin and anti-Vimentin (BD Biosciences), anti-β catenin, anti-TCF4 (Cell Signal) and anti-Tenascin C (Santa Cruz). Either β-actin or Gapdh antibody was used as a loading control.
Apoptosis, Cell cycle and proliferation assays
Apoptosis was assessed by staining with Annexin-V-FITC Apoptosis Detection Kit (BD Biosciences) according to the manufacturer’s instructions. For cell cycle, cells were fixed dropwise with 70% ice-cold ethanol overnight at 4°C. Then cells were suspended in 100 μl phosphate-citrate buffer (0.19 M Na2HPO4, 4 mM citric acid) and incubated for 30 min at room temperature and resuspended in PBS containing 10 μg/ml of propidium iodide (PI) and 10 μg/ml of RNase A. The PI-stained cell samples were analyzed using FACSCalibur (Becton-Dickinson San Jose, CA) and data analysis for the percentage of cells in each phase of the cell cycle (G1, S and G2/M) was performed with CELLQuest (Becton-Dickinson). For proliferation assay, cells were seeded at a density of 1.0×10⁴ in 6cm plates and treated with HDAC inhibitors or vehicle. After a week, cells were trypsinized and viable cells counted with a Cellometer automated cell counter (Nexcelom Bioscience, Lawrence, MA).
In vivo tumor initiation study
3–5 week old female SCID/Beige mice (Harlan, USA) were housed and used in accordance with institutional guidelines of the University of Texas MD Anderson Cancer Center under the Institutional Animal Care and Use Committee approved protocol (ACUF 07-08-07213). Mice were anesthetized through intraperitoneal injection of a cocktail containing ketamine (100 mg/kg), xylazine (2.5 mg/kg), and acepromazine (2.5 mg/kg) in sterile saline solution and fur at the surgical site was removed. The inguinal #4 glands were cleared of mammary epithelium and ALDH− SUM159 cells (5×10⁵ or 2×10⁵ in 15 μl of PBS) pretreated for 7 days with 1mM VA or vehicle were injected into the cleared fat pads. Transplants were allowed to grow out for 120 days. Tumor growth was monitored with caliper measurements. A portion of tumor or complete inguinal #4 glands were formalin fixed, paraffin-embedded, sectioned, stained with Hematoxylin and Eosin Ki67 antibody. All staining was performed with standard protocols and analyzed by a pathologist (SK) specializing in breast cancer.
Statistical methods
All data are represented in graphs as means ± SEM. A p-value of <0.05 in a paired two-sided test was considered statistically significant. Statistical analysis for limiting dilution experiment was performed using Chi-square test utilizing the Extreme limiting dilution analysis (ELDA) web tool 27.
RESULTS
Expansion of breast cancer stem-like cells by HDAC inhibitors
ALDH+ cells isolated from human breast tumors and cell lines have been demonstrated to have high tumor initiating population and have been used as surrogates to study CSC 2, 28. In the work described below we used the triple negative, basal subtype SUM159 breast cancer cell line which has been reported to have high stem cell features 7, 28. We sorted cells into aldefluor-negative (ALDH−) and aldefluor-positive (ALDH+) cells (Fig.1A). Post-sorting analysis was routinely performed to check the purity of the sorted negative cells with results indicating >99% purity (data not shown). After sorting we treated both ALDH− and ALDH+ cells with 1mM VA or 1μM SAHA or vehicle control for 7 days and evaluated the proportion of CSC-like cells by FACS and mammosphere formation assays. Interestingly, we found that ALDH− cells can generate ALDH+ cells even without any treatment (Fig.1B, 1C, Fig. S1B, S1C) supporting the recent work from Weinberg’s lab that showed CSC-like cells can arise spontaneously from more differentiated cell types 18. Since the proportion of ALDH+ cells generated in the first passage (P0) was significantly lower than the unsorted population (7.2±0.7% vs. 29.5±5.8%; P<0.001; Fig. S1A), we thought there should be an increase in the ALDH+ cells with serial passaging until it reaches the percentage in the unsorted population where it attains equilibrium. We found that there was an increase in the ALDH+ population with second passage (P1, 11.68±4.2%) and the third passage (P2, 18.7±1.1%) during which the percentage of ALDH+ cells reached the equilibrium level of the unsorted population (Fig. 1B,1C). Upon treatment with HDAC inhibitors, a significant increase in the ALDH+ cells was observed in both ALDH− and ALDH+ populations. On average in ALDH− P0 cells, the proportion of ALDH+ cells was 4.5 fold higher in VA-treated cells (VA vs. vehicle: 32.0±9.4 % vs.7.2±0.7%, P<0.001) and a 1.8-fold higher in SAHA-treated cells (SAHA vs. vehicle: 42±2.0% vs. 24±1.2%, P<0.0001) compared to vehicle-treated controls (Fig. 1B,1C). Similarly there was an increase in ALDH+ proportion in ALDH+ cells treated with HDAC inhibitors compared to vehicle-treated controls (65.9±4.5% vs. 27.1±2.3% for VA vs. vehicle, P<0.0001; 63.2±3.7% vs. 29.7±1.5% for SAHA vs. vehicle, P<0.0001; Fig. 1D,1E). These effects were maintained through second and third passages which showed a progressive increase in ALDH+ subpopulation (Fig 1 A–D; Fig. S1B, S1C). Such increase in ALDH+ cells was also observed in unsorted SUM159 cells treated with HDAC-inhibitors vs. vehicle treated controls (Fig. S1D) as well as in ALDH− MDA-231 cells treated with 0.5mM VA or 0.5μM SAHA (data not shown).
We confirmed the spontaneous generation of ALDH+ cells from ALDH− cells as well as the HDAC inhibitor-mediated expansion of ALDH+ cells through single cell clonal analysis (Fig 1F, Fig S1E). Single cell clones arising from ALDH− cells have an ALDH content ranging from 3% to 18.6% (Mean= 10.3±2.8%, N=5). This ALDH content was significantly increased in VA treated clones (P1: 21.3± 3.7%; P<0.05; P2: 43.8± 11.8% P<0.01). In single cell clones arising from ALDH+ cells, the P1 ALDH percentage varied from 68.9% to 81.9% (Mean= 75.4 ±2.3%, N=5) which was not significantly different from the P1 of VA-treated ALDH+ single cell clones (P>0.05). On the next passage (P2), however, a significant difference was observed in vehicle vs. VA-treated ALDH+ clones (54.4±4.7% vs. 76.7%±4.1%; P<0.05; Fig. 1F, S1F).
Further supporting the flow cytometry data, there was upregulation of both mRNA and protein expression of ALDH1 in ALDH− P0 cells treated with HDAC inhibitors (Fig. 1G, 1H). Remarkably, a similar increase in the percentage of ALDH+ cells was seen in VA or SAHA-treated cells using fresh tumor cells from patients with metastatic breast cancer (Mean, vehicle vs. VA: 20.0±2.5% vs. 34.0±1.5%, N=3, P=0.008; Mean, vehicle vs. SAHA: 20.0±2.5% vs. 26.3±2.5%, N=3, P=0.1; Fig. 1I). In sum, these data strongly suggest that CSCs can be generated directly from non-CSCs in culture and this can be enhanced through pretreatment with HDAC inhibitors. Alternative explanations including selective growth advantage of undetected ALDH+ cells in the ALDH− population and/or selective killing of differentiated cancer cells by HDAC inhibitors enriching for the CSC population will be discussed further below.
HDAC inhibitors and mammosphere formation
Mammosphere formation has been used as a measure of breast CSC self-renewal capacity and correlates closely with tumorigenicity 3, 29, 30. To evaluate the effect of exposure to HDAC inhibitors on mammosphere formation, ALDH− and ALDH+ cells were pre-treated with 1mM VA or 1μM SAHA or vehicle control in monolayer culture for 7 days and then were seeded in mammosphere media in low attachment plates. In accord with the observed increase in the ALDH+ population, P0 ALDH− cells pre-treated with VA showed a 7-fold increase in primary sphere formation and SAHA a 4-fold increase compared to vehicle-treated controls (Mean, Vehicle vs. VA: 8.7±1.8 vs. 57.5±2.3, P<0.0001; Mean, Vehicle vs. SAHA: 8.7±1.8 vs. 36.3±3.0, P<0.0001). These effects were observed in multiple passages (P<0.001, Fig. 2A). Likewise, a 12-fold and 6-fold increase in mammosphere formation was observed in ALDH+ P0 cells pretreated with VA and SAHA respectively (Mean, Vehicle vs. VA: 29.8±6.5 vs. 357.5±31.8, P<0.0001; Mean, Vehicle vs. VA: 29.8±6.5 vs. 181.3±11.2, P<0.0001; Fig. 2B). Similarly, secondary sphere formation was much higher (P<0.001) in VA/SAHA-treated ALDH− cells than vehicle-treated cells (Fig. 2C). Moreover, the spheres formed faster and the sizes of spheres were larger in treated vs. vehicle-treated controls (Fig. S2A). MDA-231 ALDH− cells treated with HDAC-inhibitors also showed a significant increase in primary sphere formation (P<0.001, Fig. S2B).
Figure 2. HDAC inhibitors markedly increase mammosphere formation in sorted ALDH− cells.

Primary mammosphere formation ability in (A) ALDH− and (B) ALDH+ cells exposed to HDAC inhibitor treatment and seeded in self renewal promoting suspension culture conditions. There is an increase in mammosphere formation in the first and subsequent passages. (C) Secondary mammosphere formation was also increased in P0 ALDH− cells treated with VA or SAHA. Mammosphere formation presented as the average number of spheres per 40,000 cells plated ± SEM; Representative data shown.
HDAC inhibitors and expression of EMT associated genes
In view of the findings that EMT increases the stem cell population in normal and malignant mammary epithelial cells 31, 32, we investigated EMT gene expression patterns by western blot in sorted cells pretreated with HDAC inhibitor or vehicle controls in multiple passages. Fig. 3 shows upregulation of a panel of mesenchymal markers including N-cadherin, vimentin, fibronectin and tenascin-C in ALDH− (Fig. 3A, 3B) and ALDH+ (Fig. 3C) cells while E-cadherin was not detected. We also examined gene expression profile using the EMT PCR array and found upregulation of vimentin, fibronectin, Twist, Slug, MMP3 and MMP9 while there was downregulation of other EMT genes such as Snail, Zeb1 and Foxc2 in HDAC inhibitor treated cells compared to vehicle-treated controls (Fig. 3D).
Figure 3. HDAC inhibitors increase the expression of EMT associated genes.

Western blot showed upregulation of known EMT promoting proteins in ALDH− cells treated for 7 days with or without (A) 1mM VA (B) 1 μM SAHA. E-cadherin was not detected. (C) ALDH+ cells also showed similar upregulation of EMT markers in all passages. P2 is shown. (D) Gene expression profile in ALDH− P0 cells using the EMT PCR array.
HDAC inhibitors and the tumor-initiating capacity of non-stem cells
We next evaluated the ability of ALDH− cells pretreated with VA or vehicle in vitro for 7 days to form tumors by injecting them into the cleared mammary fat pads of 3–5 week old female SCID/Beige mice at a cell concentration of 2×10⁵ or 5×10⁵. Tumor initiation was defined by the formation of a palpable tumor. VA-pretreated cells were able to form tumors in mice much more efficiently when compared with the vehicle treated cells (P = 0.004, Fig. 4A). In mice injected with 5×10⁵ cells, the tumor incidence was 6 out of 8 in VA- treated vs. 2 out of 8 in vehicle-treated xenografts while none of the mice injected with 2×10⁵ vehicle-treated cells (0 out of 8 mice) formed tumors, even after 120 days as opposed to 3 out of 7 in VA-treated cells (P=0.004, Fig. 4A). Furthermore, VA-treated cells had shorter xenograft tumor latency of 30 days compared to control xenografts (Fig. 4B; Fig. S3). These results indicate that VA-induced expansion of ALDH+ CSCs in vitro leads to a functional increase in breast CSCs in vivo. Histological examination of stained sections showed that tumors arising from VA-treated cells were invasive poorly differentiated tumor cells comprised predominantly of spindle cells. These tumor cells demonstrated prominent nucleolus and moderate amount of cytoplasm (Fig. 4C). Although the tumors arising from vehicle-treated cells were also invasive poorly differentiated tumors, they comprised predominantly epitheliod cells exhibiting marker nuclear pleomorphism including few large tumor cells. These tumor cells demonstrated large nucleolus, moderate amounts of cytoplasm and increased mitotic activity (Fig. 4C). In both vehicle and VA pre-treated tumors, labeling for KI67 was noted in almost all the tumor cells indicating extremely high proliferative index (Fig. 4D). No gross or microscopic metastasis was observed in either vehicle or VA-treated cells.
Figure 4. HDAC inhibitors increase the tumor-initiating capacity of non-stem cells in limiting dilution outgrowth assays.

(A) Tumor incidence in mouse xenografts injected with the indicated number of SUM159 ALDH− P0 cells pretreated for 7 days with 1mM VA or vehicle. Cells were injected into the cleared mammary fat pad of SCID/Beige mice. (B) Tumor latency in groups described above. VA-treated cells had shorter xenograft tumor latency compared to control xenografts. (C) Representative Hematoxylin and Eosin stained sections of outgrowths obtained following injection of 5×10⁵ ALDH− cells pre-treated with vehicle (top panel) or VA (bottom panel) into the cleared mammary fat pad of SCID/Beige mice. Vehicle pre-treated cells: invasive poorly differentiated tumor comprised of epitheliod cells exhibiting marked nuclear pleomorphism including few very large tumor cells. The tumor cells demonstrate large nucleolus, moderate amounts of cytoplasm and increased mitotic activity. Note the presence of abnormal mitotic figure in the tumor cell; VA pre-treated cells: Invasive poorly differentiated tumor comprised predominantly of spindle cells. The tumor cells demonstrate prominent nucleolus and moderate amount of cytoplasm. Note the scattered apoptotic bodies amidst the tumor cells. (D) KI67 labeling was noted in almost all the tumor cells indicating extremely high proliferative index.
HDAC inhibitors render breast cancer cells resistant to anti-cancer drugs
We have recently shown that VA radiosensitizes the committed breast cancer population to radiation while protecting the stem-like fraction 25. We hypothesized that HDAC inhibitors reprogram differentiated cancer cells, shifting the equilibrium towards the more resistant stem cell-like state. We tested the effects of treatment with 1mM VA, Taxol (2nM and 4nM) and a combination of the two on the ALDH percentage in sorted ALDH− cells. We found that while Taxol reduced the ALDH+ subpopulation, the percentage of ALDH+ was significantly higher in cells treated with a combination of VA and Taxol vs. Taxol alone, indicating that HDAC inhibitor mediated dedifferentiation renders cells resistant to Taxol (P<0.01; Fig. 5A). Similar results were obtained in a combinatorial treatment of ALDH− cells with salinomycin, a drug previously described to target CSCs 12. While VA increased ALDH+ population, 10nM salinomycin did not have a significant effect in ALDH+. Combination treatment, however, showed a significant increase of the ALDH+ population vs. salinomycin alone (P<0.05; Fig. 5B).
Figure 5. HDAC inhibitors render breast cancer cells resistant to anti-cancer drugs.

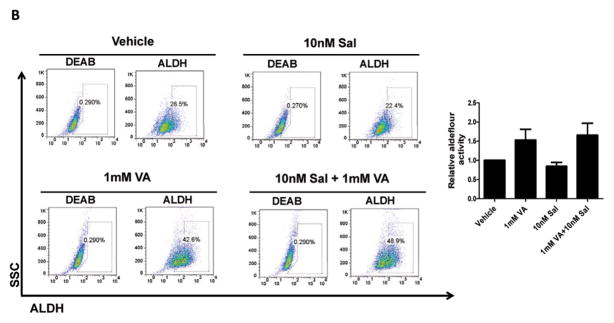
(A) ALDH percentage in P1 ALDH− cells pretreated with vehicle, 1mM VA, 2nM and 4nM Taxol or a combination of VA and Taxol. A representative flow cytometry data is shown. Bar graph shows mean ± SEM of 4 biological replicates. (B) ALDH percentage in P3 ALDH− cells pretreated with vehicle, 1mM VA, 10nM Salinomycin or a combination of VA and Salinomycin. A representative flow cytometry data is shown. Bar graph shows mean ± SEM of 3 biological replicates. Gating is set to DEAB-inhibitor control cells. A representative flow cytometry data is shown.
This raises an interesting point of whether CSCs arising from dedifferentiation are the same as the native CSCs and whether a drug that is known to target CSCs can also target induced CSCs arising from dedifferentiation. VA treated cells were similarly resistant to the EGFR tyrosine kinase inhibitor Erlotinib (Fig. S4) and all-trans retinoic acid (data not shown). Thus, HDAC inhibitors stimulate dedifferentiation that renders cells resistant to systemic anti-cancer therapeutics.
HDAC inhibitors in cell proliferation and the percentage of cycling cells
To further support the single cell clonal findings that HDAC inhibitors promote enrichment of breast CSCs through dedifferentiation and not proliferation of ALDH+ cells, we performed proliferation and cell cycle analysis experiments. As shown in Fig. 6A,6B and Fig. S5A, cells treated with HDAC inhibitors in both ALDH− and ALDH+ cell populations had significantly lower proliferation rates than vehicle treated controls P<0.01). Treated ALDH+ cells proliferated more slowly than treated ALDH− cells (data not shown). To determine whether HDAC inhibitor-mediated low proliferation is associated with the induction of apoptosis, we performed Annexin-V labeling and found no significant difference in the proportion of early apoptotic cells in treated vs. untreated cells (Fig 6C, Fig S5B). Moreover, cell cycle analysis using propidium iodide (PI) showed a marked difference in the cell cycle profile of VA treated vs. vehicle controls in both ALDH− and ALDH+ populations. VA significantly reduced cells in the S-phase while markedly increasing cells in the G0/G1 phase (P<0.01; Fig.6D, 6E) indicating that the untreated controls proliferate faster than the treated ALDH+ cells. This is supported by the protein upregulation of p21 and p27, two known cyclin dependent kinase inhibitors which play a critical role in regulating cell cycle progression, in VA-treated cells (Fig.6F). The reduced proliferation and arrested cell cycle following HDAC inhibitor treatment re-enforced our findings on EMT and CSC enrichment and are in line with the quiescent state of stem cells.
Figure 6. HDAC inhibitors reduce proliferation and the percentage of cycling cells.

Cell proliferation assay conducted to assess proliferation rates in (A) ALDH− or (B) ALDH+ cell population pre-treated for 7 days with 1mM VA or 1μM SAHA or vehicle control. (C) Assessment of apoptosis in ALDH− and ALDH+ P0 SUM159 cells pretreated for 7 days with 1mM VA, 1μM SAHA or vehicle control. The induction of apoptosis was determined by flow cytometric analysis of Annexin V-FITC and PI-staining. Cells in the lower right quadrant indicate Annexin-positive, early apoptotic cells while cells in the upper right quadrant indicate Annexin-positive/PI-positive, late apoptotic cells. (D) ALDH− and (E) ALDH+ SUM159 cells of multiple passages were profiled for their cell cycle pattern after they were pretreated with 1mM VA, 1μM SAHA or vehicle for 7 days. (F) Western blot analysis showed increased levels of cell cycle inhibitors p21 and p27 in VA-treated ALDH− P0 cells.
Mechanism of HDAC inhibitor-mediated expansion of cancer stem-like cells
Since previous studies have shown that VA directly inhibits GSK3β resulting in activation of the β-catenin signaling pathway 33–35 and β-catenin, in turn, is implicated in the self renewal of normal and neoplastic stem cells 13, 14, 36, we asked whether the increase in ALDH+ population observed in VA/SAHA treated cells is a result of an increase in β-catenin signaling. We first examined the protein expression of β-catenin in ALDH− cells pre-treated with HDAC inhibitors or vehicle and found a higher expression in the HDAC inhibitor-treated cells in the first as well as subsequent passages compared to untreated ALDH− cells (Fig. 7A, 7B). ALDH+ cells also showed higher protein levels in VA or SAHA-treated cells vs. untreated controls (Fig. S6A). This finding was supported by a functional assay using the 7TGP construct previously described by Nusse’s group 26, a reporter eGFP cassette that enriches for cells with a specific WNT/β-catenin reporter activity. We found a significant increase in GFP+ population in VA or SAHA-treated vs. vehicle-treated SUM159 cells expressing the reporter (51.4±0.5 vs 33.5±0.2, P<0.001; Fig.7C). Not only was the total percentage of GFP cells higher in treated cells, the β-catenin reporter activity in each cell was also (Fig. S6B). We then asked whether HDAC inhibitors could also reprogram β-catenin reporter non-expressing GFP− cells into GFP+ cells. We found that this conversion was significantly increased in the presence of HDAC inhibitors (P<0.01; Fig. S6C). While GFP− cells gave rise to GFP+ cells in the first passage, no increase in GFP+ cells was observed in the subsequent passages. In the presence of HDAC inhibitors, however, subsequent passages increased the percentage of GFP+ cells until it reaches the proportion in the unsorted population where it attains equilibrium (see Fig. 7C). We validated these results through single cell clonal analysis of sorted GFP− cells in the presence or absence of 1mM VA. In the first passage (P1), all the single cell clones from GFP− cells did not give rise to GFP+ cells in vehicle treated controls while four of the five clones generated high GFP+ clones with VA treatment (Fig 7D; S6D). Similar data was observed in the subsequent passage, P2. Single cell clones arising from GFP+ cells maintained their high GFP+ proportion in the presence or absence of VA treatment (Fig 7D; S6E).
Figure 7. HDAC inhibitors induce the β-catenin signaling pathway to increase CSC population.

(A&B) Western blot analysis showed upregulation of β-catenin in SUM159 ALDH− cells pretreated with 1mM VA, 1μM SAHA or vehicle for 7 days. (C) Percentage of GFP+ cells in SUM159 cells transfected with 7TGP, an eGFP expressing WNT activity reporter construct 26 and treated with 1mM VA, 1μM SAHA or vehicle for 7 days. Bar graph shows mean ± SEM of 3 biological replicates. Untransfected cells served as controls.
(D) WNT/beta-catenin reporter activity measured through GFP expression in single cell derived clones. GFP− or GFP+ single cells were FACS deposited into each well in 24-well culture plate with or without 1mM VA, expanded and GFP percentage evaluated in randomly selected five clones from each group (P1). The same clones were passaged subsequently to obtain P2.
(E) Western blot showing overexpressionn of TCF4 in SUM159 cells transfected with EdTP, a TCF4 dominant negative construct 26. (F) Flow cytometry analysis of ALDH activity indicates that SUM159 cells transfected with EdTP have reduced ALDH% and the expansion of the ALDH+ population was abolished in transfected cells treated with HDAC inhibitors. Bar graph shows the ALDH ratio to the control and is mean ± SEM of 3 biological replicates.
To functionally assess whether inhibition of β-catenin signaling in the presence of HDAC inhibitors affects the expansion of the CSC population, we transduced SUM159 cells with the TCF4-dominant negative construct, described by Nusse’s group as EdTP 26. We validated the overexpression of the TCF4 mutant in the SUM159 cells transduced with the dominant negative construct and the vector control using TCF4 antibody (Fig 7E). The increase in ALDH+ population that was previously seen with HDAC inhibitors was abolished when β-catenin is inhibited (Fig. 7F). These data indicate that HDAC inhibitors expand breast CSC numbers at least in part through the β-catenin signaling pathway.
DISCUSSION
The current cancer stem cell model posits that CSCs reside at the top of the hierarchy and differentiate into non-CSCs in a unidirectional manner. However, several recent reports have challenged this assumption and have shown that CSCs and non-CSCs can exhibit plasticity and may be interconvertible although the precise factors that regulate this equilibrium remain to be determined. These studies suggest that CSCs can arise spontaneously from more differentiated cell types but the frequency with which this occurs in clinical samples remains to be determined.
These findings represent a divergence from the unidirectional hierarchical model of CSCs and raise the possibility that approaches to solely target CSCs will not be sufficient as therapeutic elimination of CSCs may be followed by their regeneration from residual non-CSCs allowing tumor regrowth and clinical relapse. Although chromatin-modulating drugs, such as HDAC inhibitors, have been used to dedifferentiate/reprogram adult fibroblasts into induced pluripotent cells with stem cell-like characteristics 24, 37, little is known about the effect they have in reprogramming differentiated cancer cells into CSC-like cells. Here we demonstrated that treatment with VA and SAHA increased ALDH+ population and increased the tumor-initiating capacity of non-CSCs in limiting dilution outgrowth assays. Importantly, the expansion of ALDH+ population was also observed using fresh tumor cells from patients with metastatic breast cancer.
VA was previously shown to enhance proliferation and self-renewal of normal hematopoietic stem cells and expansion of leukemic progenitor cells 20, 21, 23. De Felice and co-workers investigated the effect of VA on CD34+ cells isolated from cord blood, mobilized peripheral blood and bone marrow and found that VA strongly enhanced the effect of Flt3L, thrombopoietin, stem cell factor and IL3 on the maintenance and expansion of primitive HSC population 21 The expansion was due to an increased self-renewal ability of HSCs. HDAC inhibition therefore has important biological effects on normal HSCs. It might be expected that CSCs may be similarly impacted and indeed, it has been shown that VA treatment enhanced the maintenance and clonogenic capacity of CD34+ AML progenitor cells 23. In line with this, we recently demonstrated that VA sensitized the adherent or differentiated primary and immortalized breast cancer cells to radiation in standard clonogenic assays but failed to radiosensitize stem/progenitor cells. In fact, it protected the cancer stem/progenitor cells during radiation treatment 25 indicating that VA has a differential effect on CSCs and non-CSC and that this effect may shift the equilibrium between CSCs, transient amplifying cells, and differentiated cells towards the CSC state. Supporting this notion, we have shown here that HDAC inhibitors stimulate the expansion of CSC-like cells, with VA having greater enhancement effect than SAHA.
The Wnt/β-catenin signaling has been shown to maintain pluripotency in embryonic stem cells 38 and reprogram somatic cells into pluripotent cells by transcription factors 39. It has also been reported to play an important role in the self-renewal and expansion of mammary stem cells and CSCs 13, 30, 36. Inhibitors of GSK3β, a negative regulator of Wnt signaling, not only were able to support the self-renewal and expansion of embryonic stem cells 38, 40 but also promoted the efficient conversion of partially reprogrammed cell lines into fully reprogrammed induced pluripotent stem cells 41. It is worth mentioning that HDAC inhibitors, particularly VA, have been reported to directly inhibit GSK3β activity 33–35 and activate the β-catenin signaling pathway. Supporting these observations, we found that they increase the expression of β-catenin and WNT reporter activity. Detailed mechanisms of how HDAC inhibitors regulate β-catenin and the CSC-like ALDH+ cell population has yet to be fully investigated.
The epithelial-mesenchymal-transition (EMT) is an essential developmental process that enables reprogramming of polarized epithelial cells towards a mesenchymal motile phenotype. During EMT, mesenchymal proteins such as N-Cadherin, Vimentin, Fibronectin as well as matrix degrading enzymes are induced. In contrast, epithelial junction proteins like e-cadherin are reduced 42. Previous studies have demonstrated that induction of EMT in transformed mammary epithelial cells creates populations that are highly enriched for CSC as evidenced by increased CD44+/CD24− expression, mammosphere formation or tumor seeding ability 31, 32 and showed attributes of mesenchymal phenotype including expression of vimentin, fibronectin and n-cadherin. These findings might suggest that EMT can de-differentiate cells into the CSC-like phenotype and points to the possible existence of plasticity between stem cells and their more differentiated derivatives. Recently, the WNT/ β-catenin signaling was demonstrated as one of the inducers of the EMT program 43. In our current study, we found higher expression of β-catenin and the mesenchymal proteins in sorted ALDH− cells treated with HDAC inhibitors consistent with the increased CSC properties of treated cells and how the WNT/ β-catenin modulates EMT in our culture model warrants further investigation.
Reprogramming or dedifferentiation studies in somatic cells have suggested some interesting connections between dedifferentiation and cancer. Yamanaka’s ground-breaking work has demonstrated that ectopic expression of a set of transcription factors, Oct4, Klf4, Sox2 and c-Myc can reset the epigenetic state of differentiated somatic cells to pluripotency 44, 45. Interestingly, these reprogramming factors have been implicated as oncogenes or have been linked to cellular transformation, suggesting that tumorigenesis and somatic cell reprogramming might indeed share common mechanisms of dedifferentiation (reviewed in 46). In this context, it’s remarkable to note that the well known tumor suppressor gene p53 connects tumorigenesis and reprogramming to pluripotency 47. Wild type p53 acts as a barrier to somatic cell reprogramming while silencing of p53 significantly increases the reprogramming efficiency of human somatic cells as well as the malignant potential of reprogrammed cells 48, 49. Interestingly, loss of p53 has been associated with increased CSC phenotype 50, 51. It would be of interest to examine whether HDAC inhibitors expand the CSC population by disturbing the p53 pathway or by chromatin modifications and global transcriptional changes. Furthermore, loss of p53 has been found to favor symmetric division in CSCs expanding the CSC pool and contributing to tumor growth 51 and our findings of a decrease in p53 expression in VA-treated cells (data not shown) is consistent with these findings and warrants further investigation on the role of HDAC inhibitors particularly VA in promoting symmetric division of stem cells.
Interpreting the above data in the framework of the CSC hypothesis implies that VA would worsen patient outcome by protecting breast CSCs. Interestingly, existing clinical data combining VA with systemic chemotherapy among patients with in situ disease suggests improved response with the addition of valproic acid. In a phase II clinical trial of VA and the breast cancer regimen FEC100 (5-fluorouracil, epirubicin, cyclophosphamide 7/8 breast cancer patients had stable disease (25%) or partial response (50%) in spite of numerous previous regimens 52. Understanding this apparent paradox may contribute to optimally incorporating the CSC hypothesis into cancer therapy or of equal importance, possibly disproving the CSC hypothesis. One possibility that as has been widely discussed 53 is the failing of response as an endpoint to reflect the biology of the CSCs and thus not reflect the chance of cure. It may be the case however, that driving rapidly expanding differentiating cells back towards a more quiescent CSC state may provide a meaningful clinical benefit for patients whose outcomes are dictated by the rapid expansion of metastatic disease. While the CSCs that develop appear to be resistant to several chemotherapeutics, sensitive differentiated cells are killed while resistant CSCs are held quiescent promoting CSC would not necessarily be harmful. Indeed, this strategy of reprogramming cells into CSC in combination with a targeted CSC agent represents a novel, potentially curative strategy to corral metastatic disease into a quiescent state less morbid state and then target signaling driving the CSC such as β-catenin.
CONCLUSIONS
In this study we provide evidence that HDAC inhibitors, currently active in ongoing breast cancer clinical trials, promote the expansion of the tumor initiating subpopulation through reprogramming of differentiated cancer cells into stem-like cells. Interestingly, this effect was mediated by the WNT/ β-catenin signaling pathway. To our knowledge, this is the first study to report the potential of clinically available therapeutic anti-cancer agents to mediate plasticity of cancer cells and has important clinical implications in the treatment of cancer. We propose that clinical studies using valproic acid in the adjuvant setting where an increase in CSCs are expected to increase the risk of eventual and potentially even late metastases be undertaken with caution and that translational studies incorporating assessment of CSCs and cell cycle in the metastatic setting are feasible and needed.
Supplementary Material
(A) A representative flow cytometry diagram showing the percentage of ALDH+ cells in unsorted SUM159 cells. (B&C) A representative flow cytometry diagram illustrating increased ALDH+ cells in ALDH− SUM159 cells following 7-day treatment with either 1mM VA or 1μM SAHA or vehicle. (D) A representative flow cytometry diagram (N=3) illustrating increased ALDH+ cells in unsorted SUM159 cells treated with HDAC inhibitor. Gating is set to DEAB-inhibitor control cells for each sample. (E) A representative diagram showing ALDH percentage in single cell derived clones from sorted ALDH− cells in the presence or absence of 1mM VA. ALDH− single cells were FACS deposited into each well in 24-well culture plate with or without 1mM VA, expanded and ALDH percentage evaluated in randomly selected five clones from vehicle or 1mM VA-treated group (P1). The same clones were passaged subsequently to obtain P2 (F).
(A) Mammospheres generated from HDAC-inhibitor pretreated ALDH− P0 SUM159 cells were larger in size compared to vehicle-treated controls. Photos of mammospheres were taken 7 days after seeding on a microscope at 10x magnification. (B) Primary mammosphere formation ability is significantly increased in ALDH− P0 MDA-231 cells exposed to HDAC inhibitor treatment and seeded in self renewal promoting suspension culture conditions.
ALDH− P0 cells pretreated for 7 days with 1mM VA or vehicle were injected (5 × 10⁵ cells) into the cleared mammary fat pad of SCID/Beige mice. Tumors from VA-treated cells appear faster compared to vehicle-treated control xenografts. Pictures were taken 68 days from day of injection.
ALDH percentage in P1 ALDH− cells pretreated with vehicle, VA, Erlotinib or a combination of VA and Erlotinib. Combination treatment increased the proportion of resistant stem-like cells. Gating is set to DEAB-inhibitor control cells. A representative flow cytometry data is shown. Similar data observed with 1μM SAHA (data not shown).
(A) ALDH− cells pretreated with HDAC inhibitors appear less proliferative and have a fibroblastic morphology. (B) Assessment of apoptosis in ALDH− and ALDH+ P1 and P2 SUM159 cells pretreated for 7 days with 1mM VA, 1μM SAHA or vehicle control. The induction of apoptosis was determined by flow cytometric analysis of Annexin V-FITC and PI-staining.
(A) Western blot analysis showed upregulation of β-catenin in SUM159 P2 ALDH+ cells pretreated with 1mM VA, 1μM SAHA or vehicle for 7 days. (B) β-catenin reporter activity in VA-treated cells vs. vehicle treated controls. About 5000 7TGP-expressing SUM159 cells were treated with 1mM VA or vehicle for 4 days and images were taken using time lapse video. (C) Sorted GFP− cells were treated with vehicle, 1mM VA or 1μM SAHA for 7 days (P0) to evaluate whether HDAC inhibitors can reprogram and/or stimulate β-catenin activity in non expressing GFP− cells. Subsequent passages (P1, P2) also showed increased reporter activity. A representative diagram is shown. (D, E) GFP− (D) or GFP+ (E) single cells were FACS deposited into each well in 24-well culture plate with or without 1mM VA, expanded and GFP percentage evaluated in randomly selected clones. Histogram of cells in passage 1(P1) is shown.
Acknowledgments
We thank Dr. J.M. Rosen for criticizing the manuscript and the personnel from the Cell Sorting Core Facility at MD Anderson Cancer Center for technical assistance. This work was supported by grants from the National Institute of Health R01CA138239-01; Susan G. Komen Breast Cancer Foundation Grant KG081287; The State of Texas Grant for Rare and Aggressive Cancers; The University of Texas M.D. Anderson Cancer Center Institutional Research Grant; The University of Texas Health Sciences Center KL2 RR024149. The funders had no role in study design, data collection and analysis, decision to publish, or preparation of the manuscript.
Footnotes
Conflict of Interest
The authors declare no conflict of interest.
Bisrat G. Debeb: Conception and design, Collection and/or assembly of data, Data analysis and interpretation, manuscript writing, Final approval of manuscript
Lara Lacerda: Collection and/or assembly of data, Data analysis and interpretation
Wei Xu: provision of study material
Richard Larson: Collection and/or assembly of data
Travis Solley: Collection and/or assembly of data
Rachel Atkinson: Data analysis and interpretation
Erik P. Sulman: Data analysis and interpretation
Naoto T Ueno: Data analysis and interpretation
Savitri Krishnamurthy: Data analysis and interpretation
James M Reuben: Data analysis and interpretation
Thomas A Buchholz: Data analysis and interpretation
Wendy A Woodward: Conception and design, Data analysis and interpretation, manuscript writing, Financial support, Final approval of manuscript
References
- 1.Al-Hajj M, Wicha MS, Benito-Hernandez A, et al. Prospective identification of tumorigenic breast cancer cells. Proc Natl Acad Sci U S A. 2003;100:3983–3988. doi: 10.1073/pnas.0530291100. [DOI] [PMC free article] [PubMed] [Google Scholar]
- 2.Ginestier C, Hur MH, Charafe-Jauffret E, et al. ALDH1 is a marker of normal and malignant human mammary stem cells and a predictor of poor clinical outcome. Cell Stem Cell. 2007;1:555–567. doi: 10.1016/j.stem.2007.08.014. [DOI] [PMC free article] [PubMed] [Google Scholar]
- 3.Dontu G, Abdallah WM, Foley JM, et al. In vitro propagation and transcriptional profiling of human mammary stem/progenitor cells. Genes Dev. 2003;17:1253–1270. doi: 10.1101/gad.1061803. [DOI] [PMC free article] [PubMed] [Google Scholar]
- 4.Balic M, Lin H, Young L, et al. Most early disseminated cancer cells detected in bone marrow of breast cancer patients have a putative breast cancer stem cell phenotype. Clin Cancer Res. 2006;12:5615–5621. doi: 10.1158/1078-0432.CCR-06-0169. [DOI] [PubMed] [Google Scholar]
- 5.Li F, Tiede B, Massague J, et al. Beyond tumorigenesis: cancer stem cells in metastasis. Cell Res. 2007;17:3–14. doi: 10.1038/sj.cr.7310118. [DOI] [PubMed] [Google Scholar]
- 6.Reuben JM, Lee BN, Gao H, et al. Primary breast cancer patients with high risk clinicopathologic features have high percentages of bone marrow epithelial cells with ALDH activity and CD44CD24lo cancer stem cell phenotype. Eur J Cancer. 2011;47:1527–1536. doi: 10.1016/j.ejca.2011.01.011. [DOI] [PMC free article] [PubMed] [Google Scholar]
- 7.Woodward WAGH, Cohen EN, Li L, Xu W, Debeb BG, Jimenez CA, Krishnamurthy S, Tucker SL, Hortobagyi G, Cristofanilli M, Buchholz T, Reuben J. Percentage of CD45−CD326+ CD44+CD24−/lo cells in pleural effusion fluid of patients with metastatic breast cancer predicts for overall survival. IOSJ. 2011;1:4–10. [Google Scholar]
- 8.Li X, Lewis MT, Huang J, et al. Intrinsic resistance of tumorigenic breast cancer cells to chemotherapy. J Natl Cancer Inst. 2008;100:672–679. doi: 10.1093/jnci/djn123. [DOI] [PubMed] [Google Scholar]
- 9.Atkinson RL, Zhang M, Diagaradjane P, et al. Thermal enhancement with optically activated gold nanoshells sensitizes breast cancer stem cells to radiation therapy. Sci Transl Med. 2010;2:55ra79. doi: 10.1126/scitranslmed.3001447. [DOI] [PMC free article] [PubMed] [Google Scholar]
- 10.Phillips TM, McBride WH, Pajonk F. The response of CD24(−/low)/CD44+ breast cancer-initiating cells to radiation. J Natl Cancer Inst. 2006;98:1777–1785. doi: 10.1093/jnci/djj495. [DOI] [PubMed] [Google Scholar]
- 11.Woodward WA, Chen MS, Behbod F, et al. WNT/beta-catenin mediates radiation resistance of mouse mammary progenitor cells. Proc Natl Acad Sci U S A. 2007;104:618–623. doi: 10.1073/pnas.0606599104. [DOI] [PMC free article] [PubMed] [Google Scholar]
- 12.Gupta PB, Onder TT, Jiang G, et al. Identification of selective inhibitors of cancer stem cells by high-throughput screening. Cell. 2009;138:645–659. doi: 10.1016/j.cell.2009.06.034. [DOI] [PMC free article] [PubMed] [Google Scholar]
- 13.Korkaya H, Paulson A, Charafe-Jauffret E, et al. Regulation of mammary stem/progenitor cells by PTEN/Akt/beta-catenin signaling. PLoS Biol. 2009;7:e1000121. doi: 10.1371/journal.pbio.1000121. [DOI] [PMC free article] [PubMed] [Google Scholar]
- 14.Zhang M, Atkinson RL, Rosen JM. Selective targeting of radiation-resistant tumor-initiating cells. Proc Natl Acad Sci U S A. 2010;107:3522–3527. doi: 10.1073/pnas.0910179107. [DOI] [PMC free article] [PubMed] [Google Scholar]
- 15.Ginestier C, Liu S, Diebel ME, et al. CXCR1 blockade selectively targets human breast cancer stem cells in vitro and in xenografts. J Clin Invest. 2010;120:485–497. doi: 10.1172/JCI39397. [DOI] [PMC free article] [PubMed] [Google Scholar]
- 16.Iliopoulos D, Hirsch HA, Wang G, et al. Inducible formation of breast cancer stem cells and their dynamic equilibrium with non-stem cancer cells via IL6 secretion. Proc Natl Acad Sci U S A. 2010;108:1397–1402. doi: 10.1073/pnas.1018898108. [DOI] [PMC free article] [PubMed] [Google Scholar]
- 17.Meyer MJ, Fleming JM, Ali MA, et al. Dynamic regulation of CD24 and the invasive, CD44posCD24neg phenotype in breast cancer cell lines. Breast Cancer Res. 2009;11:R82. doi: 10.1186/bcr2449. [DOI] [PMC free article] [PubMed] [Google Scholar]
- 18.Chaffer CL, Brueckmann I, Scheel C, et al. Normal and neoplastic nonstem cells can spontaneously convert to a stem-like state. Proc Natl Acad Sci U S A. 2011 doi: 10.1073/pnas.1102454108. [DOI] [PMC free article] [PubMed] [Google Scholar]
- 19.Lagadec C, Vlashi E, Della Donna L, et al. Radiation-induced reprogramming of breast cancer cells. Stem Cells. 2012;30:833–844. doi: 10.1002/stem.1058. [DOI] [PMC free article] [PubMed] [Google Scholar]
- 20.Bug G, Gul H, Schwarz K, et al. Valproic acid stimulates proliferation and self-renewal of hematopoietic stem cells. Cancer Res. 2005;65:2537–2541. doi: 10.1158/0008-5472.CAN-04-3011. [DOI] [PubMed] [Google Scholar]
- 21.De Felice L, Tatarelli C, Mascolo MG, et al. Histone deacetylase inhibitor valproic acid enhances the cytokine-induced expansion of human hematopoietic stem cells. Cancer Res. 2005;65:1505–1513. doi: 10.1158/0008-5472.CAN-04-3063. [DOI] [PubMed] [Google Scholar]
- 22.Young JC, Wu S, Hansteen G, et al. Inhibitors of histone deacetylases promote hematopoietic stem cell self-renewal. Cytotherapy. 2004;6:328–336. doi: 10.1080/14653240410004899. [DOI] [PubMed] [Google Scholar]
- 23.Bug G, Schwarz K, Schoch C, et al. Effect of histone deacetylase inhibitor valproic acid on progenitor cells of acute myeloid leukemia. Haematologica. 2007;92:542–545. doi: 10.3324/haematol.10758. [DOI] [PubMed] [Google Scholar]
- 24.Huangfu D, Maehr R, Guo W, et al. Induction of pluripotent stem cells by defined factors is greatly improved by small-molecule compounds. Nat Biotechnol. 2008;26:795–797. doi: 10.1038/nbt1418. [DOI] [PMC free article] [PubMed] [Google Scholar]
- 25.Debeb BG, Xu W, Mok H, et al. Differential radiosensitizing effect of valproic acid in differentiation versus self-renewal promoting culture conditions. Int J Radiat Oncol Biol Phys. 2010;76:889–895. doi: 10.1016/j.ijrobp.2009.09.052. [DOI] [PMC free article] [PubMed] [Google Scholar]
- 26.Fuerer C, Nusse R. Lentiviral vectors to probe and manipulate the Wnt signaling pathway. PLoS One. 2010;5:e9370. doi: 10.1371/journal.pone.0009370. [DOI] [PMC free article] [PubMed] [Google Scholar]
- 27.Hu Y, Smyth GK. ELDA: extreme limiting dilution analysis for comparing depleted and enriched populations in stem cell and other assays. J Immunol Methods. 2009;347:70–78. doi: 10.1016/j.jim.2009.06.008. [DOI] [PubMed] [Google Scholar]
- 28.Charafe-Jauffret E, Ginestier C, Iovino F, et al. Breast cancer cell lines contain functional cancer stem cells with metastatic capacity and a distinct molecular signature. Cancer Res. 2009;69:1302–1313. doi: 10.1158/0008-5472.CAN-08-2741. [DOI] [PMC free article] [PubMed] [Google Scholar]
- 29.Fillmore CM, Kuperwasser C. Human breast cancer cell lines contain stem-like cells that self-renew, give rise to phenotypically diverse progeny and survive chemotherapy. Breast Cancer Res. 2008;10:R25. doi: 10.1186/bcr1982. [DOI] [PMC free article] [PubMed] [Google Scholar]
- 30.Zhang M, Behbod F, Atkinson RL, et al. Identification of tumor-initiating cells in a p53-null mouse model of breast cancer. Cancer Res. 2008;68:4674–4682. doi: 10.1158/0008-5472.CAN-07-6353. [DOI] [PMC free article] [PubMed] [Google Scholar]
- 31.Mani SA, Guo W, Liao MJ, et al. The epithelial-mesenchymal transition generates cells with properties of stem cells. Cell. 2008;133:704–715. doi: 10.1016/j.cell.2008.03.027. [DOI] [PMC free article] [PubMed] [Google Scholar]
- 32.Morel AP, Lievre M, Thomas C, et al. Generation of breast cancer stem cells through epithelial-mesenchymal transition. PLoS One. 2008;3:e2888. doi: 10.1371/journal.pone.0002888. [DOI] [PMC free article] [PubMed] [Google Scholar]
- 33.Chen G, Huang LD, Jiang YM, et al. The mood-stabilizing agent valproate inhibits the activity of glycogen synthase kinase-3. J Neurochem. 1999;72:1327–1330. doi: 10.1046/j.1471-4159.2000.0721327.x. [DOI] [PubMed] [Google Scholar]
- 34.Leng Y, Liang MH, Ren M, et al. Synergistic neuroprotective effects of lithium and valproic acid or other histone deacetylase inhibitors in neurons: roles of glycogen synthase kinase-3 inhibition. J Neurosci. 2008;28:2576–2588. doi: 10.1523/JNEUROSCI.5467-07.2008. [DOI] [PMC free article] [PubMed] [Google Scholar]
- 35.Rowe MK, Wiest C, Chuang DM. GSK-3 is a viable potential target for therapeutic intervention in bipolar disorder. Neurosci Biobehav Rev. 2007;31:920–931. doi: 10.1016/j.neubiorev.2007.03.002. [DOI] [PMC free article] [PubMed] [Google Scholar]
- 36.Zeng YA, Nusse R. Wnt proteins are self-renewal factors for mammary stem cells and promote their long-term expansion in culture. Cell Stem Cell. 2010;6:568–577. doi: 10.1016/j.stem.2010.03.020. [DOI] [PMC free article] [PubMed] [Google Scholar]
- 37.Huangfu D, Osafune K, Maehr R, et al. Induction of pluripotent stem cells from primary human fibroblasts with only Oct4 and Sox2. Nat Biotechnol. 2008;26:1269–1275. doi: 10.1038/nbt.1502. [DOI] [PubMed] [Google Scholar]
- 38.Sato N, Meijer L, Skaltsounis L, et al. Maintenance of pluripotency in human and mouse embryonic stem cells through activation of Wnt signaling by a pharmacological GSK-3-specific inhibitor. Nat Med. 2004;10:55–63. doi: 10.1038/nm979. [DOI] [PubMed] [Google Scholar]
- 39.Marson A, Foreman R, Chevalier B, et al. Wnt signaling promotes reprogramming of somatic cells to pluripotency. Cell Stem Cell. 2008;3:132–135. doi: 10.1016/j.stem.2008.06.019. [DOI] [PMC free article] [PubMed] [Google Scholar]
- 40.Ying QL, Wray J, Nichols J, et al. The ground state of embryonic stem cell self-renewal. Nature. 2008;453:519–523. doi: 10.1038/nature06968. [DOI] [PMC free article] [PubMed] [Google Scholar]
- 41.Silva J, Barrandon O, Nichols J, et al. Promotion of reprogramming to ground state pluripotency by signal inhibition. PLoS Biol. 2008;6:e253. doi: 10.1371/journal.pbio.0060253. [DOI] [PMC free article] [PubMed] [Google Scholar]
- 42.May CD, Sphyris N, Evans KW, et al. Epithelial-mesenchymal transition and cancer stem cells: a dangerously dynamic duo in breast cancer progression. Breast Cancer Res. 2011;13:202. doi: 10.1186/bcr2789. [DOI] [PMC free article] [PubMed] [Google Scholar]
- 43.Scheel C, Eaton EN, Li SH, et al. Paracrine and autocrine signals induce and maintain mesenchymal and stem cell States in the breast. Cell. 2011;145:926–940. doi: 10.1016/j.cell.2011.04.029. [DOI] [PMC free article] [PubMed] [Google Scholar]
- 44.Takahashi K, Tanabe K, Ohnuki M, et al. Induction of pluripotent stem cells from adult human fibroblasts by defined factors. Cell. 2007;131:861–872. doi: 10.1016/j.cell.2007.11.019. [DOI] [PubMed] [Google Scholar]
- 45.Takahashi K, Yamanaka S. Induction of pluripotent stem cells from mouse embryonic and adult fibroblast cultures by defined factors. Cell. 2006;126:663–676. doi: 10.1016/j.cell.2006.07.024. [DOI] [PubMed] [Google Scholar]
- 46.Daley GQ. Common themes of dedifferentiation in somatic cell reprogramming and cancer. Cold Spring Harb Symp Quant Biol. 2008;73:171–174. doi: 10.1101/sqb.2008.73.041. [DOI] [PubMed] [Google Scholar]
- 47.Tapia N, Scholer HR. p53 connects tumorigenesis and reprogramming to pluripotency. J Exp Med. 2010;207:2045–2048. doi: 10.1084/jem.20101866. [DOI] [PMC free article] [PubMed] [Google Scholar]
- 48.Kawamura T, Suzuki J, Wang YV, et al. Linking the p53 tumour suppressor pathway to somatic cell reprogramming. Nature. 2009;460:1140–1144. doi: 10.1038/nature08311. [DOI] [PMC free article] [PubMed] [Google Scholar]
- 49.Sarig R, Rivlin N, Brosh R, et al. Mutant p53 facilitates somatic cell reprogramming and augments the malignant potential of reprogrammed cells. J Exp Med. 2010;207:2127–2140. doi: 10.1084/jem.20100797. [DOI] [PMC free article] [PubMed] [Google Scholar]
- 50.Chang CJ, Chao CH, Xia W, et al. p53 regulates epithelial-mesenchymal transition and stem cell properties through modulating miRNAs. Nat Cell Biol. 2011;13:317–323. doi: 10.1038/ncb2173. [DOI] [PMC free article] [PubMed] [Google Scholar]
- 51.Cicalese A, Bonizzi G, Pasi CE, et al. The tumor suppressor p53 regulates polarity of self-renewing divisions in mammary stem cells. Cell. 2009;138:1083–1095. doi: 10.1016/j.cell.2009.06.048. [DOI] [PubMed] [Google Scholar]
- 52.Munster P, Marchion D, Bicaku E, et al. Phase I trial of histone deacetylase inhibition by valproic acid followed by the topoisomerase II inhibitor epirubicin in advanced solid tumors: a clinical and translational study. J Clin Oncol. 2007;25:1979–1985. doi: 10.1200/JCO.2006.08.6165. [DOI] [PubMed] [Google Scholar]
- 53.Baumann M, Krause M, Hill R. Exploring the role of cancer stem cells in radioresistance. Nat Rev Cancer. 2008;8:545–554. doi: 10.1038/nrc2419. [DOI] [PubMed] [Google Scholar]
Associated Data
This section collects any data citations, data availability statements, or supplementary materials included in this article.
Supplementary Materials
(A) A representative flow cytometry diagram showing the percentage of ALDH+ cells in unsorted SUM159 cells. (B&C) A representative flow cytometry diagram illustrating increased ALDH+ cells in ALDH− SUM159 cells following 7-day treatment with either 1mM VA or 1μM SAHA or vehicle. (D) A representative flow cytometry diagram (N=3) illustrating increased ALDH+ cells in unsorted SUM159 cells treated with HDAC inhibitor. Gating is set to DEAB-inhibitor control cells for each sample. (E) A representative diagram showing ALDH percentage in single cell derived clones from sorted ALDH− cells in the presence or absence of 1mM VA. ALDH− single cells were FACS deposited into each well in 24-well culture plate with or without 1mM VA, expanded and ALDH percentage evaluated in randomly selected five clones from vehicle or 1mM VA-treated group (P1). The same clones were passaged subsequently to obtain P2 (F).
(A) Mammospheres generated from HDAC-inhibitor pretreated ALDH− P0 SUM159 cells were larger in size compared to vehicle-treated controls. Photos of mammospheres were taken 7 days after seeding on a microscope at 10x magnification. (B) Primary mammosphere formation ability is significantly increased in ALDH− P0 MDA-231 cells exposed to HDAC inhibitor treatment and seeded in self renewal promoting suspension culture conditions.
ALDH− P0 cells pretreated for 7 days with 1mM VA or vehicle were injected (5 × 10⁵ cells) into the cleared mammary fat pad of SCID/Beige mice. Tumors from VA-treated cells appear faster compared to vehicle-treated control xenografts. Pictures were taken 68 days from day of injection.
ALDH percentage in P1 ALDH− cells pretreated with vehicle, VA, Erlotinib or a combination of VA and Erlotinib. Combination treatment increased the proportion of resistant stem-like cells. Gating is set to DEAB-inhibitor control cells. A representative flow cytometry data is shown. Similar data observed with 1μM SAHA (data not shown).
(A) ALDH− cells pretreated with HDAC inhibitors appear less proliferative and have a fibroblastic morphology. (B) Assessment of apoptosis in ALDH− and ALDH+ P1 and P2 SUM159 cells pretreated for 7 days with 1mM VA, 1μM SAHA or vehicle control. The induction of apoptosis was determined by flow cytometric analysis of Annexin V-FITC and PI-staining.
(A) Western blot analysis showed upregulation of β-catenin in SUM159 P2 ALDH+ cells pretreated with 1mM VA, 1μM SAHA or vehicle for 7 days. (B) β-catenin reporter activity in VA-treated cells vs. vehicle treated controls. About 5000 7TGP-expressing SUM159 cells were treated with 1mM VA or vehicle for 4 days and images were taken using time lapse video. (C) Sorted GFP− cells were treated with vehicle, 1mM VA or 1μM SAHA for 7 days (P0) to evaluate whether HDAC inhibitors can reprogram and/or stimulate β-catenin activity in non expressing GFP− cells. Subsequent passages (P1, P2) also showed increased reporter activity. A representative diagram is shown. (D, E) GFP− (D) or GFP+ (E) single cells were FACS deposited into each well in 24-well culture plate with or without 1mM VA, expanded and GFP percentage evaluated in randomly selected clones. Histogram of cells in passage 1(P1) is shown.