

Abstract
Objective
Age is the single greatest risk factor for Alzheimer’s disease with the incidence doubling every 5 years after age 65. However, our understanding of the mechanistic relationship between increasing age and the risk for Alzheimer’s disease is currently limited. We therefore sought to determine the relationship between age, amyloidosis, and amyloid-beta kinetics in the central nervous system (CNS) of humans
Methods
Amyloid-beta kinetics were analyzed in 112 participants and compared to the ages of participants and the amount of amyloid deposition.
Results
We found a highly significant correlation between increasing age and slowed amyloid-beta turnover rates (2.5-fold longer half-life over five decades of age). In addition, we found independent effects on amyloid-beta42 kinetics specifically in participants with amyloid deposition. Amyloidosis was associated with a higher (>50%) irreversible loss of soluble amyloid-beta42 and a 10-fold higher amyloid-beta42 reversible exchange rate.
Interpretation
These findings reveal a mechanistic link between human aging and the risk of amyloidosis which may be due to a dramatic slowing of amyloid-beta turnover, increasing the likelihood of protein misfolding that leads to deposition. Alterations in amyloid-beta kinetics associated with aging and amyloidosis suggest opportunities for diagnostic and therapeutic strategies. More generally, this study provides an example of how changes in protein turnover kinetics can be used to detect physiologic and pathophysiologic changes and may be applicable to other proteinopathies.
INTRODUCTION
Alzheimer’s disease (AD) affects more than 30 million patients worldwide and is increasing in prevalence, largely due to the aging population.1 The risk of AD doubles every 5 years after the age of 652, 3 reaching a prevalence of 40% or more in people older than 85 years. Some factors have been shown to influence the age of onset, for example Apolipoprotein E (ApoE) genotype and autosomal dominant AD (ADAD) mutations, however these genetic risk factors also demonstrate characteristic age dependence 4, 5. The age related changes that link advancing age and AD risk have not been understood, however.
AD is pathologically characterized by amyloid-beta (Aβ) plaques and tau neurofibrillary tangles. Mutations in genes that produce Aβ have been shown to initiate AD in genetic studies of ADAD 6–9, and more recently a different mutation in the amyloid precursor protein (APP) gene has been shown to be a strongly protective factor 10. Aβ is a normal product of APP cleavage in the human central nervous system (CNS) 11. Aβ normally turns over rapidly in the human CNS with a half-life of approximately 9 hours,12 and Aβ turnover kinetics are altered in AD 13. The relationship between Aβ kinetics and age, the major risk factor of Alzheimer’s disease, has not been previously reported.
We hypothesized that age, amyloidosis, and ApoE genotype are associated with increased CNS Aβ production, decreased clearance, or both. To advance our understanding of the pathophysiologic processes that underlie age-associated alterations in Aβ kinetics and amyloidosis related to sporadic AD, we quantified and compared Aβ38, Aβ40, and Aβ42 stable isotope labeling kinetics (SILK)12. One hundred sporadic AD participants received a 9-hour infusion of [13C6]leucine to label newly synthesized proteins in vivo, and plasma and cerebrospinal fluid (CSF) were sampled for 36 hours 14. The in vivo incorporation of 13C6-leucine into CSF (soluble) Aβ38, Aβ40, and Aβ42 was quantified, and relationships between these Aβ isoform kinetics, concentrations, age, amyloid status (assessed by Positron Emission Tomography Pittsburgh compound B (PET PIB)15 and CSF Aβ42 concentration), cognitive function (Clinical Dementia Rating, CDR16), and ApoE genotype were investigated.
Subjects and Methods
These human studies took place at the Washington University School of Medicine in St. Louis and were approved by the Washington University Human Studies Committee and the General Clinical Research Center (GCRC) Advisory Committee. All participants completed informed written consent. One hundred sporadic AD participants were enrolled for these studies comprising 56 men (aged from 60.4 to 87.7) and 44 women (aged 63.8 to 85.2). Deposition of amyloid plaques was quantified in 62 subjects based on the mean cortical binding potential (MCBP) score of [11C]PIB-PET.15 PET PIB scans were performed within 3 years before or after the SILK tracer study date. Cognitive status using the Clinical Dementia Rating sum of boxes score (CDR-SB16) and ApoE genotyping17 was assessed in all subjects. Amyloid status was assigned based on PET PIB score, if available (amyloid positive if PET PIB MCBP score > 0.1814), or based on CSF Aβ42/40 concentration ratio if PET PIB score was not available (amyloid positive if Aβ42/40 concentration ratio < 0.12). Participant characteristics are presented in Table 1.
Table 1.
Subject Demographics
| Sporadic AD (n=100) | Younger controls14 (n=12) | |
|---|---|---|
|
|
||
| Age (y) | 73.3 ± 6.6 (60.4 to 87.7) | 48.0 ± 14.6 (29.2 to 72.6) |
| Weight (kg) | 77.1 ±15.6 (42.2 to 122.5) | 89.0±20.8 (61.7 to 127.0) |
| BMI (kg/m2) | 26.6 ± 4.8 (16.5 to 40.3) | 29.3±6.3 (23.1 to 45.2) |
| Sex | 56M/44F | 5M/7 F |
| ApoE4 status | 58 without ApoE4/42 with ApoE4 | 8 without ApoE4/4 with ApoE4 |
| ApoE4 genotypes | E23 = 10 | E23 = 2 |
| E24 = 2 | E33 = 6 | |
| E33 = 48 | E34 = 4 | |
| E34 = 33 | ||
| E44 = 7 | ||
| PET PIB status | 37 with PET PIB score ≤ 0.18 | 12 with PET PIB score ≤ 0.18 |
| 25 with PET PIB score > 0.18 | ||
| 38 with no PET PIB score | ||
| PET PIB(−) group | PET PIB score = 0.042 ± 0.046 (−0.038 to 0.152) | |
| PET PIB(+) group | PET PIB score = 0.645 ± 0.281 (0.259 to 1.241) | |
| CSF AB42/40 status: | 49 with ratio ≥ 0.12 | |
| 51 with ratio < 0.12 | ||
| Amyloid status* | 51 without plaques | 12 without plaques |
| 49 with plaques | ||
| CDR-SB status | 44 with CDR-SB=0 | 12 with CDR-SB = 0 |
| 56 with CDR-SB>0 | ||
Values shown are mean ± StdDev (range)
Amyloid status: based on PET PIB score is available (subjects have plaques if PET PIB score > 0.18); based on CSF status if PET PIB score not available (CSF AB42/40 ratio < 0.12)
Aβ SILK data of 12 younger amyloid negative subjects that were previously published14 were included only for the assessment of age effects. These subjects were non-carriers of presenilin mutations; 5 male/7 female; age 48.0 ± 14.6 (range 29.2–72.6 years); PET PIB MCBP score 0.026 ± 0.045 (range −0.026 to 0.120); all CDR= 0; ApoE genotypes: E23 (n=2), E33 (n=6), E34 (n=4).
Description of tracer protocol & sample collection
The procedure for stable isotope amino acid tracer administration and sample collection was previously described.12 Briefly, intravenous and intrathecal lumbar catheters were placed between 7:00 AM and 9:00 AM, and the collection of samples was started between 8:00 AM and 10:00 AM. After initial CSF and plasma baseline samples were collected, each participant was infused with a bolus of 3mg/kg L-[U-13C6] leucine for 10 minutes, followed by a constant infusion (2 mg/kg/h) for the remainder of the first 9 hours. Blood samples (12 mL) were obtained hourly for the first 16 h and every other hour thereafter. CSF samples (6 mL) were obtained hourly throughout each study. CSF and blood samples collected for 36 hours were frozen at −80°C immediately in 1 mL polypropylene tubes for subsequent determination of plasma leucine and CSF Aβ isoform peptide enrichment. The sample collection for one subject was truncated at 4 hours; this subject was excluded from the analysis.
Aβ SILK
All samples were processed and measured in a blinded fashion with data results and individual analysis completed before unblinding to participant’s disease state. The procedure for sample preparation, data acquisition and processing were previously described.18 Briefly, 1 mL of CSF from each hour of collection and media standards were thawed. Aβ was purified and processed for mass spectrometry by immunoprecipitation with a mid-domain binding antibody HJ5.1 (Aβ amino acids 13 to 28). The immunopurification mixture was comprised of 800 μL CSF, 20 μL of a solution containing uniformly 15N-labeled Aβ40 (10 ng), Aβ42 (1 ng), and Aβ38 (1.5 ng) as internal standard; 12.5 μL 100x protease inhibitor, 110 μL 5M guanidine hydrochloride in 50 mM Tris-HCl (pH 8.0), and 30 μL antibody-bead slurry (50% Phosphate Buffered Saline (PBS)). The purified Aβ was then digested with Lys-N (Metalloendopeptidase) and isotopic enrichment of Aβ c-terminal isoform specific peptides (Aβ29-38, Aβ29-40, and Aβ29-42) were measured using a nano-liquid chromatography (NanoLC-2D-Ultra system (Eksigent Technologies, CA USA)) coupled to a TSQ Vantage triple quadrupole mass spectrometer (ThermoScientific, San Jose USA) that was equipped with a column-heating nanospray source (Phoenix S&T, Chester PA USA). Xcalibur V2.1 was used to collect and quantify the mass spectrometry data for SILK. Aβ SILK tracer kinetics for 24 participants were previously reported13 using a different analytical method of immunoprecipitation with Aβ42 and Aβ40 specific antibodies and measuring only the Aβ mid-domain peptide. Samples for 100 subjects (including the prior 24 subjects) were analyzed utilizing the more specific and sensitive method18 in this study.
For determination of plasma 13C6-leucine enrichment, amino acids were recovered from plasma using cation exchange chromatography, converted to N-heptafluorobutyryl n-propyl ester derivatives, and 13C6-leucine enrichment (tracer:tracee ratio) was quantified by selected ion monitoring (m/z 349 and 355) using gas chromatography-negative chemical ionization-mass spectrometry (Agilent 6890N Gas Chromatograph and Agilent 5973N Mass Selective Detector (GC-MS); Agilent, Palo Alto, CA) as described.19
CSF concentrations
Absolute quantification of Aβ38, Aβ40, and Aβ42 isoform amounts in CSF was measured by isotope dilution mass spectrometry. One mL aliquots of CSF (t=0) from each of 100 participants were randomly split into two groups and processed the same way as the SILK protocol described above and analyzed as two consecutive assays. An artificial CSF (aCSF) was made comprised of serial dilutions of synthetic standards of Aβ38, Aβ40 and Aβ42 (rPeptide, Bogart, GA) into PBS with protease-free Bovine Serum Albumin (BSA) added as a carrier protein. The composition of aCSF was PBS (1X from Sigma Chemical), protease inhibitor (1X, PI complete from Roche), 2 mg/ml BSA (BSA, IgG-free, protease free from Jackson ImmunoResearch), plus 0.05% sodium azide (Sigma Chemical). The Aβ standard was diluted two-fold in serial fashion with ranges starting from 7.5 ng to 0.47 ng for Aβ38, 50 ng to 3.12 ng for Aβ40 and 5 ng to 0.31 ng for Aβ42. The generated calibration curve was spiked with 20 μL of a solution containing uniformly 15N-labeled Aβ38, Aβ40, and Aβ42 (rPeptide, Bogart, GA) as internal standard, consisting of 1.5 ng of Aβ38, 10 ng of Aβ40 and 1 ng of Aβ42. The resulting standard curves for the Aβ isoforms were used to calculate the concentration of Aβ isoforms in CSF. Liquid Chromatography-Mass Spectrometer (LC-MS)/Mass Spectrometer (MS) measurements were performed on Waters Xevo TQ-S triple quadrupole mass spectrometer (Waters Inc., Milford, MA) coupled to Waters nano-ACQUITY UPLC and equipped with Waters BEH130 nanoAcquity UPLC column (C18 particle, 1.7 μm, 100 μm × 100 mm) and Waters nano-ESI ionization source. Data was acquired and quantified using Waters MassLynx 4.1 software suite.
Kinetic analysis
The time and magnitude of the peak maximum was determined by fitting a 2nd order curve to enrichment vs. time over an 11-hr interval centered at the approximate peak maximum. The compartmental model previously developed and applied to ADAD participants was used to determine model-dependent parameters of Aβ turnover kinetics.14 Modeling was performed using the Population Kinetics (PopKinetics, version 1.0.1) companion application to the SAAM II modeling program (version 1.2.1, SAAM Institute, University of Washington, Seattle). PopKinetics performed an iterative two-stage approach to optimize kinetic parameters to individual participants as well as the population as a whole by including a term that represents the population mean and standard deviation for each adjustable parameter such that variability of the kinetic parameters across the population is minimized. Parameters of the compartmental model were adjusted to optimally fit the shape and magnitude of the enrichment time course, including the fractional turnover rate (FTR) for irreversible loss (affects the peak time, peak magnitude, and steepness of the rise and fall from the peak), an exchange process for Aβ42 (affects the shape of the back end of the curve, primarily when amyloidosis is evident), and a delay time (affects the time at which labeled peptides are detected at the lumbar sampling site).
The model consists of a plasma leucine pool, a subsystem for production of Aβ through APP and C99, turnover of Aβ, and transport of Aβ to CSF. Fluid transport through the CSF is depicted as a system of 3 compartments, which together with the APP and C99 compartment represent a total of 5 compartments that comprise a time delay that is common to all Aβ isoforms, which can be resolved from the turnover of Aβ.14 Aβ42 exchanges with another compartment, particularly when amyloid plaques are present, which alters the shape of the back end of the tracer time course and causes isotopic dilution of the peak enrichment for Aβ42. An exchange process for Aβ38 and Aβ40 was initially included in the model,14 but PopKinetics optimized this process to zero for all participants regardless of the presence of amyloid plaques so this process was removed from the model. Tracer to tracee ratios (TTR) obtained from the mass spectrometric analysis for plasma leucine, Aβ38, Aβ40 and Aβ42 were converted to mole fraction labeled for modeling analysis, as this measure of isotopic enrichment has been shown to be most appropriate for compartmental modeling of stable isotope tracer data.20
The principal parameters obtained from the kinetic analysis include: the FTR for the irreversible loss of each peptide, which is the sum of losses to CSF (kCSF) and other loss pathways (v38, v40, or v42); kex42; kdelay (turnover rate of each CSF delay compartment, which is also the turnover rate of APP [kC99] and the sum of all losses from C99); kAPP (production rate of APP); and the individual rate constants for Aβ peptide production from C99 (kAβ), kCSF40 was assumed to be 50% of FTRAβ40, with the same value applied to kCSF38 and kCSF42 since bulk fluid transport from the brain into CSF is expected to be equivalent for all peptides, and vC99 was assumed to be 50% of the total turnover rate of C99.14 Major conclusions of the study concerning the impact of amyloidosis and age on Aβ kinetics were not affected by these assumptions.
PopKinetics optimized 11 adjustable parameters against the measured enrichments and CSF concentrations for Aβ38, Aβ40 & Aβ42 for each participant: the FTR for each peptide; kex42; kdelay; kAPP; rate constants for production of Aβ38 and Aβ42 (kAβ38 and kAβ42; kAβ40 is determined based on these values and other constraints); and a scaling factor for each Aβ peptide. The scaling factor accounts for any isotopic dilution between plasma leucine and the precursor pool for APP synthesis and sources of analytical error that systematically affect the accuracy of isotopic enrichment measurements for a given set of samples.
Statistical Analysis
The amyloid status of 62 participants was defined by their PET PIB scores. Participants were classified as positive or negative using the published threshold (i.e., a PET PIB score of less or equal than 0.18 is defined as Amyloid negative while a PET PIB score of greater than 0.18 is defined as Amyloid positive14). In the absence of PET PIB score, the amyloid status of the remaining 28 participants was defined by the CSF Aβ42/40 ratio, using a cut-off of 0.12 based on a Receiver Operating Characteristics (ROC) curve analysis. The cut-off value was achieved by maximizing the sum of sensitivity and specificity. All analyses were conducted in SAS, version 9.3(SAS Institute). Statistical significance was defined by p<0.05.
Each kinetic parameter was further analyzed using the analysis of covariance (ANCOVA) models in which age was treated as a continuous covariate (centered at the mean) and amyloid status, clinical status (cognitively impaired or not), and ApoE4 were treated as classification predictors. All possible interactions across these variables were included in the model first. When the highest order of interaction was not significant, a reduced model was then fitted after removing the highest order of interaction. When there were no interactions between age and any other classification variables, the age-adjusted main as well as interactive effects of amyloid status, clinical status, and ApoE4 were then reported. All these analyses were implemented in PROC GLM/SAS. The 12 younger normal subjects previously reported14 were not included in this analysis.
RESULTS
Subject characteristics
Subject characteristics are shown in Table 1. SILK Aβ studies were performed in 100 subjects who ranged in age from 60 to 87 years (mean = 73.3 ± 6.6). Approximately half of the participants were characterized as having clinical evidence of AD (CDR-SB >0). Forty-two participants carried ApoE4 alleles (E24 = 2; E34 = 34; E44 = 6) and 58 subjects did not (E23 = 10; E33 = 48). To evaluate potential differences in age with amyloidosis, we compared the average age of amyloid positive versus amyloid negative groups, which were not significantly different. However, the average age of the group with cognitive impairment (CDR>0) was 3 years older than the group without impairment (CDR=0) (P=0.016). By linear regression across all 100 subjects, age was not significantly correlated with CDR-SB or the concentrations of CSF Aβ40 or Aβ42. Age was significantly positively correlated with PET PIB MCBP score, and there was a trend for a significant negative correlation between age and the Aβ42/Aβ40 concentration ratio (P=0.077), as expected since the risk of AD increases with age.
Age-associated slowing of Aβ38, Aβ40 and Aβ42 isoform half-lives
The SILK time course profiles of Aβ peptides were characterized by a 5 hour delay21 before isotopically labeled peptides appeared at the lumbar sampling site, a sigmoidal rise to a peak at ~15–25 hours, and a descending tail with significant enrichment still detectable at 36 hours (Fig 1A). The SILK time courses for all Aβ peptides peaked later and lower with increasing age (Fig 1A; Table 2), and were substantially earlier and higher for younger subjects (30–59 years, previously reported as normal younger controls14) compared to older subjects (60–87 years), indicating that turnover slowed with increasing age.
Figure 1. Aβ38, Aβ40 and Aβ42 turnover rates slow with increased age.
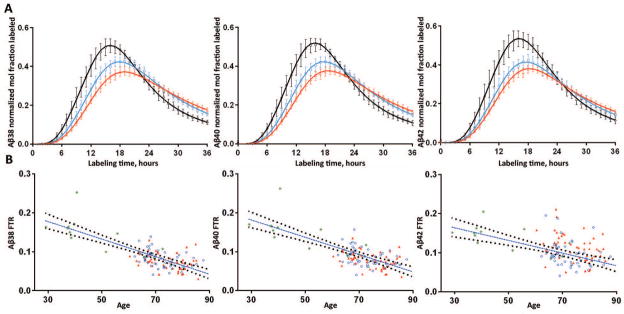
A. The SILK time course profiles of Aβ38 (left), Aβ40 (middle) and Aβ42 (right) from 51 amyloid negative subjects from the present sporadic AD cohort are summarized along with 12 amyloid negative subjects who were previously reported14. Results are averaged across 3 age groups spanning decade ranges: black = age 30’s–50’s, n= 9; blue = age 60’s, n=25; red = age 70’s–80’s, n=29. Error bars represent 95% confidence intervals. Solid lines represent the average model fits to the data for each age group.
B. The turnover rates of all Aβ isoforms are highly negatively correlated with increased age. Results from older amyloid negative (blue circles) and amyloid positive (red triangles) are shown with 12 younger amyloid negative participants (green asterisks). A linear fit with 95% CI are shown for the age vs. FTR of Aβ.
Table 2.
Associations between subject characteristics and Aβ kinetics with amyloidosis, cognitive impairment, apoE4, and age
| Age | Amyloid status | CDR status | apoE4 status | ||||||||
|---|---|---|---|---|---|---|---|---|---|---|---|
| Pearson correlation | One-way ANOVA | One-way ANOVA | One-way ANOVA | ||||||||
| R (n=100) |
P | Negative (n=51) |
Positive (n=49) |
P | CDR-SB = 0 (n=44) | CDR-SB > 0 (n=56) | P | Negative (n=58) |
Positive (n=42) |
P | |
|
| |||||||||||
| Subject characteristics: | |||||||||||
| AGE (years) | -- | -- | 72.3 ± 6.2 | 74.3 ± 6.9 | .13 | 71.5 ± 5.7 | 74.7 ± 7.0 | .016 | 73.3 ± 6.7 | 73.2 ± 6.6 | .96 |
| PET PIB MCBP score | 0.332 (n=62) | .008 | 0.042 ± 0.046 (n=37) | 0.645 ± 0.281 (n=25) | 7.0×10⁻¹⁹ | 0.113 ± 0.176 (n=39) | 0.578 ± 0.375 (n=23) | 1.0×10⁻⁸ | 0.152 ± 0.260 (n=41) | 0.546 ± 0.357 (n=21) | 6.1×10⁻⁶ |
| CDR-SB | 0.160 | .11 | 1.40 ± 3.02 | 4.01 ± 3.64 | 1.7×10⁻⁴ | 0.00 ± 0.00 | 4.79 ± 3.56 | 2.9×10⁻¹⁴ | 1.82 ± 3.02 | 3.87 ± 3.94 | .004 |
| [CSF Aβ40] (ng/mL) | 0.032 | .76 | 7.09 ± 2.03 | 7.03 ± 1.98 | .89 | 7.31 ± 1.81 | 6.86 ± 2.12 | .27 | 7.38 ± 2.01 | 6.62 ± 1.91 | .059 |
| [CSF Aβ42] (ng/mL) | −0.106 | .29 | 1.20 ± 0.42 | 0.66 ± 0.19 | 9.7×10⁻¹³ | 1.13 ± 0.40 | 0.78 ± 0.38 | 1.4×10⁻⁵ | 1.10 ± 0.44 | 0.70 ± 0.25 | 5.4×10⁻⁷ |
| Aβ42/Aβ40 concentration ratio | −0.178 | .077 | 0.170 ± 0.034 | 0.095 ± 0.018 | 2.6×10⁻²⁴ | 0.157 ± 0.044 | 0.114 ± 0.039 | 7.5×10⁻⁷ | 0.151 ± 0.045 | 0.108 ± 0.035 | 1.3×10⁻⁶ |
|
| |||||||||||
| Labeling curve morphology: | |||||||||||
| Aβ38 peak time (h) | 0.375 | 2.3×10⁻⁴ | 19.5 ± 1.5 | 20.1 ± 2.1 | .13 | 19.5 ± 1.8 | 20.0 ± 1.8 | .16 | 19.7 ± 1.8 | 19.8 ± 1.8 | .72 |
| Aβ40 peak time (h) | 0.331 | .001 | 19.3 ± 1.7 | 19.8 ± 2.1 | .18 | 19.2 ± 1.9 | 19.8 ± 1.9 | .18 | 19.5 ± 2.0 | 19.6 ± 1.9 | .82 |
| Aβ42 peak time (h) | 0.271 | .009 | 18.9 ± 1.9 | 18.4 ± 2.1 | .23 | 18.6 ± 1.9 | 18.6 ± 2.1 | .94 | 18.8 ± 1.9 | 18.4 ± 2.1 | .40 |
| Aβ42/Aβ40 peak time ratio | −0.075 | .48 | 0.979 ± 0.048 | 0.927 ± 0.048 | 1.7×10⁻⁶ | 0.969 ± 0.057 | 0.942 ± 0.049 | .020 | 0.965 ± 0.055 | 0.940 ± 0.050 | .032 |
| Normalized Aβ38 peak height | −0.415 | 3.9×10⁻⁵ | 0.403 ± 0.063 | 0.388 ± 0.053 | .22 | 0.405 ± 0.063 | 0.387 ± 0.054 | .16 | 0.391 ± 0.063 | 0.402 ± 0.054 | .41 |
| Normalized Aβ40 peak height | −0.381 | 1.8×10⁻⁴ | 0.401 ± 0.065 | 0.380 ± 0.052 | .085 | 0.402 ± 0.066 | 0.382 ± 0.053 | .11 | 0.392 ± 0.063 | 0.390 ± 0.055 | .92 |
| Normalized Aβ42 peak height | −0.314 | .002 | 0.403 ± 0.068 | 0.375 ± 0.060 | .044 | 0.403 ± 0.071 | 0.378 ± 0.058 | .074 | 0.389 ± 0.064 | 0.391 ± 0.069 | .90 |
| Aβ42/Aβ40 peak height ratio | 0.119 | .26 | 1.006 ± 0.080 | 0.992 ± 0.118 | .51 | 1.004 ± 0.088 | 0.995 ± 0.109 | .68 | 0.998 ± 0.093 | 1.002 ± 0.109 | .85 |
|
| |||||||||||
| Model-dependent kinetic parameters: | |||||||||||
| Aβ38 FTR (pools/h) | −0.390 | 6.1×10⁻⁵ | 0.081 ± 0.021 | 0.075 ± 0.021 | .22 | 0.083 ± 0.021 | 0.074 ± 0.020 | .023 | 0.077 ± 0.019 | 0.080 ± 0.024 | .44 |
| Aβ40 FTR (pools/h) | −0.388 | 6.6×10⁻⁵ | 0.086 ± 0.023 | 0.079 ± 0.021 | .096 | 0.088 ± 0.022 | 0.078 ± 0.021 | .015 | 0.081 ± 0.020 | 0.084 ± 0.025 | .62 |
| Aβ42 FTR (pools/h) | −0.264 | .008 | 0.094 ± 0.031 | 0.112 ± 0.035 | .011 | 0.104 ± 0.036 | 0.102 ± 0.032 | .83 | 0.096 ± 0.031 | 0.112 ± 0.036 | .025 |
| Aβ42/AB40 FTR ratio | 0.099 | .33 | 1.099 ± 0.209 | 1.418 ± 0.235 | 1.2×10⁻¹⁰ | 1.173 ± 0.283 | 1.320 ± 0.249 | .007 | 1.194 ± 0.299 | 1.340 ± 0.208 | .008 |
| kex42 (pools/h) | 0.039 | .70 | 0.006 ± 0.032 | 0.049 ± 0.054 | 5.8×10⁻⁶ | 0.021 ± 0.052 | 0.032 ± 0.047 | .25 | 0.016 ± 0.043 | 0.042 ± 0.054 | .010 |
Pearson correlation coefficients against Age and one-way ANOVA of selected outcomes against 3 fixed factors (amyloid status; CDR-SB status; and apoE4 status, the presence or absence of apoE4 allele) are shown. Results are shown for the 100 subjects who underwent SILK tracer kinetic studies, except that PET PIB analysis was only performed on 62 subjects. Grouped mean±SD values are shown for ANOVA results. Formatting of highlighted cells signifies two levels of significance: Bold (P<0.05), and Bold with scientific notation (P<0.001)
In order to estimate kinetics using all available data, a compartmental model was used to calculate the kinetic parameters from relative labeling curves. The steepness of the curve correlates with turnover rate and half-life. A compartmental model14 was used to determine the kinetic parameters of Aβ38, Aβ40, and Aβ42 turnover kinetics (see Methods and Fig 2). The model has three main parameters that are adjusted to fit the kinetic data: the fractional turnover rate (FTR), reversible exchange (kex), and delay (kdelay). Turnover of the soluble Aβ peptides is characterized by the FTR, representing the irreversible loss of soluble peptides. Reversible exchange (kex) of isotopically labeled Aβ42 with previously existing (i.e. unlabeled) Aβ42 was needed to fit the bi-exponential labeling decay curve in participants with amyloidosis. The delay rate constant (kdelay) accounts for the approximate nine hour delay between cessation of isotope labeled amino acid infusion and the peak labeling of Aβ in CSF. The delay rate constant might reflect the rate of fluid flow through CNS and is taken to be equivalent for all Aβ isoforms. The model provided an excellent fit to the Aβ isoform labeling time courses in all participants (Figs 1,3–4) with an average R2 = 0.991±0.007, 0.993±0.004 and 0.981±0.016 for Aβ38, Aβ40, and Aβ42, respectively.
Figure 2. Compartmental model of Aβ turnover kinetics.
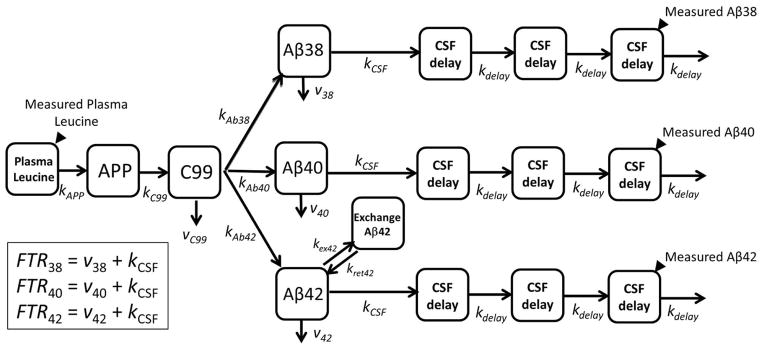
See Methods for description of model parameters.
Figure 3. Aβ42 kinetics are altered in brain amyloidosis.

A. SILK Aβ time course profiles of the isotopic enrichment of Aβ peptides normalized to plasma leucine for each participant of Aβ38, Aβ40, and Aβ42 show altered Aβ42 kinetics in the amyloid positive group (mean ±95% CI). Amyloid negative participants (PET PIB MCBP < 0.18 or CSF Aβ42/Aβ40 concentration ratio >= 0.12, n=51) shown on left, amyloid positive participants (n=49) shown on right. Solid lines represent the mean model fit to the data. Blue: Aβ38; Green: Aβ40; Red: Aβ42.
B. SILK labeled Aβ isoform ratios ≠1 demonstrate altered Aβ42 kinetics in the amyloid positive group (Blue: Aβ38/Aβ40 ratio; Red: Aβ42/Aβ40 ratio, mean ±95% CI). The amyloid negative group demonstrated similar kinetics of all three Aβ isoforms.
Figure 4. Tertile analysis reveals completely normal SILK Aβ42 kinetics in participants with the highest CSF Aβ42/40 ratio and SILK Aβ42 alterations present at intermediate CSF Aβ42/40.
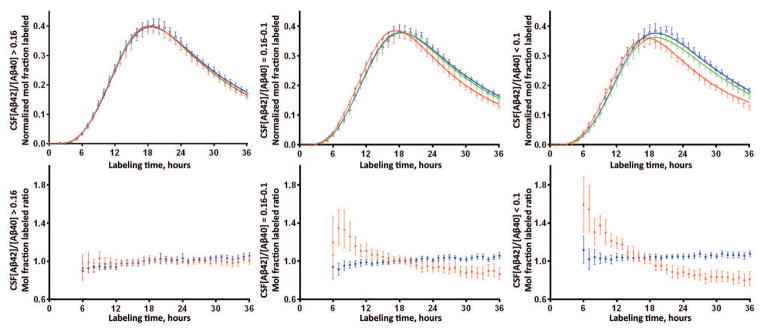
The top panel shows the mean and 95% confidence interval of the isotopic enrichment of Aβ peptides normalized to plasma leucine for each participant. Solid lines represent the mean model fit to the data. Blue: Aβ38; Green: Aβ40; Red: Aβ42. The bottom panel shows the mean (±95% CI) of the ratio of Aβ isoforms labeled demonstrating differences in kinetics between Aβ isoforms when ratios ≠ 1. Blue: Aβ38/Aβ40 ratio; Red: Aβ42/Aβ40 ratio. The left column of figures represents n=34 participants with CSF Aβ42/40 concentration ratio > 0.16; middle column is n=34 participants with concentration ratio between 0.10–0.16; right column is n=32 participants with concentration ratio <0.1.
The compartmental model provided an excellent fit to the entire SILK time course from every subject (Figs 1A, 3A, Fig 4A). The model FTR represents the fractional rate at which soluble Aβ peptides are irreversibly lost to all processes, e.g. transport to the CSF, transport across the blood brain barrier, in situ uptake or proteolysis, and deposition into plaques. The FTR slowed approximately 60% between the age range of 30 (0.184/h) to 80 (0.074/h) years (regression lines, Fig 1B), and was highly correlated with age for Aβ38 (r=−0.78, p<0.001), Aβ40 (r=−0.75, p<0.001) and Aβ42 (r=−0.57, p<0.001) (Fig 1B). Expressed as a half-life (= 0.693/FTR), this represents a 2.5-fold increase in half-life from 3.8 h to 9.4 h over 5 decades. This age-associated slowing of Aβ peptide turnover affects all Aβ isoforms in a similar fashion.
CNS Aβ42 kinetics are altered with amyloidosis
In order to understand the potential interaction between brain amyloidosis and soluble Aβ kinetics, Aβ38, Aβ40 and Aβ42 kinetics were quantified and compared between amyloid negative and positive participants matched for age (Fig 3, Table 2). The SILK time course for Aβ38, Aβ40 and Aβ42 were similar in amyloid negative participants. The SILK Aβ38 and Aβ40 time courses were similar in amyloid positive participants; however, Aβ42 labeling kinetics peaked significantly earlier than Aβ38 and Aβ40 in amyloid positive participants (Fig 3, Table 2).
To compare Aβ SILK time courses between amyloid positive and negative participants, we calculated Aβ isotopic enrichment ratios (Fig 3B). This revealed the Aβ38/Aβ40 isotope enrichment ratio was close to one throughout the time course in both amyloid negative and positive groups, indicating similar kinetics of Aβ38 and Aβ40 with regard to amyloid status. However, in the amyloid positive group the SILK Aβ42/Aβ40 ratio was greater than one during the rise to peak labeling and less than one after the peak (Fig 3B), consistent with our prior report of faster soluble Aβ42 turnover kinetics associated with amyloidosis in ADAD.14 This indicated a specific disturbance in soluble Aβ42 kinetics in the amyloid positive group only.
Aβ42 SILK alterations were evident in some amyloid negative participants, so Aβ SILK profiles were examined by tertiles of CSF Aβ42/Aβ40 concentration ratios (Fig 4). The anomalous Aβ42 SILK peak morphology for Aβ42 was completely absent in the 34 participants with CSF Aβ42/Aβ40 concentration ratios > 0.16, was evident with concentration ratios between 0.10–0.16, and most pronounced in participants with ratios < 0.1. These results indicate that processing of soluble Aβ isoforms is handled identically between Aβ38, Aβ40, and Aβ42 as part of normal physiology. However, Aβ42 kinetics are altered in the presence of and possibly before significant amyloidosis is detectable by PET PIB or CSF Aβ42/Aβ40 ratios.
The FTR of Aβ42 was significantly faster in amyloid positive compared to amyloid negative participants (0.112±0.035 vs. 0.094±0.031 pools/h, P = 0.011; Table 2). The kinetic anomaly of Aβ42 was more pronounced in amyloid positive participants when inter-subject variability was reduced by normalization to the FTR of Aβ40, as the Aβ42/Aβ40 FTR ratio was ~1.4 (P = 1.2×10⁻¹⁰ for amyloidosis status; Table 2).
An exchange process of Aβ42 was evident in amyloid positive participants (exchange rate constant 0.049±0.054 pools/h, approximately half the magnitude of Aβ42 FTR), but nearly absent in amyloid negative participants (0.006±0.032 pools/h, P < 10−5; Table 2). Thus, increased Aβ42 irreversible loss and exchange appear to be the major kinetic alterations associated with amyloid plaques.
Correlation of Aβ SILK parameters and measures of amyloidosis identified linear correlations of Aβ42/40 peak labeling time ratios and PET PIB MCBP (r=−0.47) and CSF Aβ42/40 concentration ratios, (r=0.63, Fig 5). FTR Aβ42/40 and Aβ42 exchange demonstrated a non-linear or state binary change relationship to amyloidosis (Fig 5), suggesting these measures detect the absence or presence of amyloidosis, and the Aβ42/40 peak labeling time ratios more accurately quantify the amount of fibrillar amyloid plaques.
Figure 5.

Correlation of Aβ SILK parameters and measures of amyloidosis identify linear correlations of Aβ42/40 peak time ratios and (A) PET PIB MCBP, r=−0.47, n=60 and (B) CSF Aβ42/40 concentration ratios, r=0.63, n=92. FTR Aβ42/40 (C (n=64), D (n=100)) and Aβ42 exchange (E (n=64), F (n=100)) demonstrate a non-linear or state change relationship to amyloidosis, suggesting these measures detect the presence of amyloidosis, but don’t accurately quantify the amount. Amyloid−/CDR− (green circles), Amyloid−/CDR+ (dark green triangles), Amyloid+/CDR− (red circles), Amyloid+/CDR+ (dark red triangles).
Interaction between amyloidosis and cognitive impairment for Aβ isoform kinetics
Although the FTR of Aβ38 and Aβ40 was not significantly different by one-way ANOVA of amyloid status (Table 2), there was a statistically significant interaction between amyloid status and cognitive impairment (Amyloid*CDR) for the FTR of all Aβ peptides by ANCOVA after adjusting for age (Table 3). The FTRs were significantly faster in Aβ42 (57% faster), and to a lesser extent for Aβ40 (17% faster) and Aβ38 (22% faster), in the cognitively normal and amyloid positive group compared to the cognitively normal, amyloid negative group, or the cognitively impaired participants regardless of amyloid status (Table 3). There was no interaction between cognitive status and amyloid status for Aβ42 exchange (kex42, Table 3).
Table 3.
Multivariate ANOVA analysis of amyloid status, age, and cognitive impairment on Aβ SILK parameters
| Parameters | Effect | Overall p-value | Mean (95% confidence limits) |
|---|---|---|---|
| Aβ42 FTR | Amyloid | 0.02 | Amyloid+ 0.124 (0.112–0.135) Amyloid− 0.101 (0.086–0.115) |
| CDR*Amyloid | 0.002 | CDR=0 Amyloid− 0.091(0.070–0.111) CDR=0 Amyloid+ 0.143(0.124–0.163) CDR>0 Amyloid− 0.110(0.093–0.128) CDR>0 Amyloid+ 0.104(0.093–0.115) |
|
| Age | 0.21 | - | |
| Aβ40 FTR | Amyloid | 0.62 | - |
| CDR*Amyloid | 0.007 | CDR=0 Amyloid − 0.082(0.068–0.096) CDR=0 Amyloid+ 0.096(0.083–0.109) CDR>0 Amyloid− 0.094(0.083–0.106) CDR>0 Amyloid + 0.074(0.067–0.081) |
|
| Age | 0.012 | - | |
| Aβ38 FTR | Amyloid | 0.97 | - |
| CDR*Amyloid | 0.007 | CDR=0 Amyloid− 0.075(0.062–0.088) CDR=0 Amyloid + 0.092(0.079–0.104) CDR>0 Amyloid− 0.088(0.077–0.099) CDR>0 Amyloid+ 0.071(0.064–0.078) |
|
| Age | 0.01 | - | |
| Aβ42/Aβ40 FTR ratio | Amyloid | <.0001 | Amyloid + 1.448(1.363–1.533) Amyloid− 1.145(1.036–1.254) |
| CDR*Amyloid | 0.47 | - | |
| Age | 0.16 | - | |
| kex42 | Amyloid | 0.001 | Amyloid+ 0.059(0.042–0.076) Amyloid− 0.006(−0.016–0.029) |
| CDR*Amyloid | 0.13 | - | |
| Age | 0.48 | - |
In order to evaluate this interaction, the active fibrillar amyloid deposition rate (calculated as the change in PET PIB MCBP score over time) was examined in participants as a function of CDR and amyloid status (initial PET PIB MCBP score; Fig 6). In participants who received initial and follow-up PET PIB scans, the change in PET PIB per year was greater in the cognitively normal, PET PIB+ group than the cognitively normal, PET PIB- group (0.049 ± 0.011 vs. 0.003 ± 0.025), and the change in PET PIB per year in the cognitively impaired, PET PIB+ group (−0.002 ± 0.064) was similar to the cognitively normal, PET PIB− group. Substantial increases in the rate of PET PIB increase were present in all cognitively normal, PET PIB+, but decreased after participants were cognitively impaired (Fig 6A). There was a positive correlation between FTR Aβ42 and the rate of PET PIB increase in PET PIB+ participants of R=0.75, p=0.002 (Fig 6B) and in both PET PIB+ and PET PIB− participants, R=0.56, p=0.0002 (Fig 6C). Thus, the increase in PET PIB per year (Fig 6) and the FTRs of Aβ (predominantly Aβ42, Table 3) are both elevated in cognitively normal participants with evidence of amyloidosis compared to other groups.
Figure 6. Fibrillar plaque growth is observed in cognitively normal participants, but plateaus with clinical dementia.

A, The annualized change in PET PIB MCBP is compared by baseline PET PIB and CDR (n=38). Delta PET PIB is the annualized change in PET PIB MCBP at times closest to the SILK study. Reference red dotted line represents conditional cutoff for amyloid groups (0.18). CDR−/PET PIB− (circles), CDR−/PET PIB+ (squares), CDR+/PET PIB− (diamond), CDR+/PET PIB+ (triangles). B, C, Correlations between the annualized change in fibrillar amyloid by PET PIB and FTR Aβ42 indicate that increasing fibrillar amyloid deposition is positively correlated with increased FTR Aβ42. In Amyloid positive (triangles) participants, R=0.75, p=0.002, n=14 and in both Amyloid positive and Amyloid negative (circles) participants, R=0.56, p=0.0002, n=38. The color shows CDR sum of the boxes (redder signifies more impaired clinical dementia on a scale from 0–6).
ApoE4 effects
We evaluated the effect of Apolipoprotein E4 (ApoE4) allele for Aβ kinetic alterations. The majority of participants with ApoE4 had clear evidence of amyloidosis: of the 42 participants with one or more ApoE4 alleles, 34 (81%) were characterized as amyloid positive; 33 (79%) had CSF Aβ42/Aβ40 concentration ratio <= 0.12; and 30 (71%) had cognitive impairment (CDR-SB > 0). PET PIB score was available in 21 ApoE4 carriers; 17 (81%) of these had PET PIB MCBP > 0.18. Thus, when one-way analysis of variance (ANOVA) was performed using ApoE4 status, the outcomes were generally consistent with the presence of amyloid plaques in participants carrying the ApoE4 allele (Table 2). No significant effects of ApoE4 on the exchange of Aβ42 or Aβ kinetic rates were observed by ANCOVA when amyloid status was included as a factor in the analysis. Thus, given the high association between ApoE4 and the presence of amyloid plaques, we could not determine ApoE4 effects independent of amyloid status in this study.
DISCUSSION
We report the first comprehensive analysis of Aβ isoform kinetics in humans by age and amyloidosis. To our knowledge, these findings are the first to link soluble Aβ kinetics with age, which is the single largest risk factor for AD.2, 22, 23 Aβ turnover rate was highly correlated with age and is an excellent biomarker for chronological age (Pearson correlation of 0.77, Fig 1).24 The remarkable 2.5-fold longer Aβ half-life (from 3.8 hours at 30 years to 9.4 hours at 80 years) over five decades may account for the increasing liability of amyloidosis associated with aging. For example, as Aβ clearance rate from the CNS decreases, Aβ may be more liable to aggregation or modification. Amyloidosis then greatly increases the risk of cognitive decline and AD.25–28 This finding may also explain why early onset (e.g. 30s to 50s) dominantly inherited AD also has a clear age-dependent onset.5 The mechanism for age-related slowing of Aβ turnover is uncertain, but may be related to structural changes in clearance,29 decreases in cellular or proteolytic degradation,30 or decreases in CSF or blood-brain-barrier31 transport. The age associated Aβ slowing of turnover rate may be a general effect of all brain proteins, with Aβ42 being highly aggregation prone, or may be specific to certain proteins, depending on the mechanism. Interestingly, slowing of whole body and muscle protein turnover rates by ~30–40% (1.4 to 1.7 fold decrease in rate) have been reported with increasing age32, 33, whereas Aβ slowing of turnover rate is by 60%, resulting in a 2.5-fold increase in half-life.
This study found clear and significant alterations in Aβ42 kinetics in the presence of amyloidosis. The soluble Aβ42 irreversible loss (FTR) is faster in the presence of amyloidosis, while an increased exchange process increases the time that Aβ42 is present in the CNS. These findings are similar to those seen in amyloid positive ADAD,14 suggesting that once amyloid deposition occurs, ADAD and sporadic AD have a common pathophysiology in amyloidosis and altered soluble Aβ42 kinetic rates. Two aspects of Aβ42 kinetics are altered in amyloidosis. First, there is increased irreversible loss of soluble Aβ42, perhaps due to irreversible aggregation in higher order Aβ structures such as oligomers or amyloid plaques. Second, there is a ten-fold increase in the exchange of newly synthesized soluble Aβ42 with one or more pools, which may represent higher-order aggregates such as oligomers or the surface of plaques. We have proposed a biological hypothesis to account for the current understanding of CNS Aβ biology in amyloidosis which fits with our Aβ kinetic measures (Fig 7). Future testing of this model can be addressed with animal model studies, longitudinal clinical observations, or interventional studies. For example, a drug which blocks new oligomer, protofibril or plaque formation would be expected to normalize the exchange and irreversible loss.
Figure 7. A biological model for increased Aβ42 exchange and increased irreversible loss.

Faster irreversible loss and exchange are present in amyloidosis (regardless of age, ApoE allele type or cognitive impairment), suggesting that amyloid plaques or associated higher-order Aβ structures (e.g. protofibrils or oligomers) underlie altered Aβ42 kinetics. The FTR may represent irreversible loss due to Aβ42 deposition on plaques, while Aβ42 exchange may represent interactions of newly generated soluble Aβ42 with higher order Aβ structures such as oligomeric forms and amyloid plaques.
We noted an interaction in the turnover rate of Aβ42 with amyloidosis and clinical symptoms. The change in insoluble amyloid by PET PIB also demonstrates a similar interaction (Fig 6). Taken together, these findings suggest that Aβ42 FTR is a measure of irreversible loss due to plaque deposition. Lesser effects and interactions were noted for Aβ40 and Aβ38 FTR, suggesting these isoforms are also affected to a lesser degree.
ApoE allele genotype was evaluated with respect to Aβ kinetics; however, ApoE4 was highly associated with amyloidosis so that independent comparisons could not be made. Studies of Aβ kinetics by ApoE genotype in younger participants are likely to inform about the potential impact of ApoE on Aβ metabolism before amyloidosis occurs and potentially an Aβ mechanism for ApoE4’s increased risk of AD.
The present kinetic analysis represents an improvement from the former approach to analyze Aβ SILK curves, which focused on the “production” (upslope) and “clearance” (downslope) phases of the time course. The FTR represents the turnover rate, which is directly related and correlates with prior calculations of the fractional clearance rate and fractional synthesis rate in a steady-state condition34. The FTR from the compartmental model revealed details about the system that could not be discerned using the fractional synthesis rate (upslope) or fractional clearance rate (downslope).
Our model can be used to estimate how long Aβ42 would need to accumulate to reach amounts of amyloidosis typical of AD. The model provides a clear and highly identifiable estimate of the increase in Aβ42 turnover in sporadic AD. Comparing the clinically normal amyloid positive group (FTR Aβ42=0.143 pool/h) to the clinically normal amyloid negative group (FTR Aβ42 =0.091 pool/h), we propose that this difference is due to active deposition into amyloid plaques (deposition of Aβ42 rate constant = 0.143 - 0.091 = 0.052 pool/h)34. Using literature values for the pool size of soluble Aβ42 (0.2–1 ng per gram of brain tissue), for an AD brain mass of 1100g35, the pool size is 220–1100 ng. The deposition rate constant multiplied by the pool size yields an approximate estimate of the rate of deposition of Aβ42 into plaques. Using a value from the median of this range (600 ng) yields a rate of deposition of Aβ42 into plaques of 600 ng * 0.052 pools/hour = 31.2 ng/h, or 273 μg/year. The amount of insoluble Aβ42 in AD brains is in the range of 0.1–20 μg per gram of brain tissue, or 0.5–60 mg per brain36–40. Using an intermediate value of 11 mg per brain, the simple calculation estimates that plaques build up over about 40 years. Recent results41 of PET PIB longitudinal accumulation rates suggest that approximately 40 years of amyloid accumulation occur in AD, while other estimates are 15–20 years.28, 42 This simple model does not account for potentially exponential growth in the early to middle phase of plaque growth, and does not account for insoluble amyloid degradation or the decreased degradation in AD, nor does it predict a plateau in plaque loads as seen in previous studies.28, 42 However, it does suggest that FTR Aβ42 estimates made over hours is of the correct order of magnitude for the estimated 15–20 years of amyloid growth reported in observational studies over years to decades.28, 42, 43
These findings provide a first link between aging, Aβ kinetics, and amyloidosis which will assist in the design of observational and interventional studies in AD. Future studies into the causes of slowed Aβ turnover rates associated with aging may lead to prevention strategies for amyloidosis. The concept that protein kinetics reveals changes in the physiology of aging and amyloid disorders may be applied to other disease states. Further, they provide a framework for studying protein kinetics and physiological changes in aging and disease states.
Acknowledgments
We thank the research participants for their contributions in this study. We thank Karen Browning, Rose Connors, Rachel Potter, Guolin (Alex) Wen for their assistance in supporting the study. The authors thank Eric Karran for helpful discussions. This study was funded by the following grants: NIH R01NS065667, K23AG030946, P50 AG05681, P01 AG03991, UL1 RR024992, P30 DK056341, P41 GM103422, and P30 DK020579, and the Adler Foundation and also supported by philanthropic gifts from Edwin and Barbara Shifrin and Jeff Roschman.
Footnotes
Potential Conflicts of Interest
Drs. Bateman, Holtzman and Patterson report personal fees for consulting outside the submitted work from C2N Diagnostics, which has licensed related patents from Washington University. The following authors are inventors on patents held by Washington University in which they are eligible for personal fees and/or fees to their laboratories: RJB, BWP, DLE, KGW, DMH. Mr. Ovod, Ms. Ma, Mr. Chott, Dr. Yarasheski, Mrs. Sigurdson, and Ms. Zhang have nothing to disclose.
Contributions
BWP and DLE performed mathematical modeling of turnover kinetics. KGM, LZ, TK and VO measured amyloid-beta isotopic enrichment and concentrations. RC and KY measured plasma leucine isotopic enrichment. SM and CX performed statistical analyses. RJB and WS were responsible for participant recruitment and clinical protocols, AG was responsible for genetic analysis, TB was responsible for imaging analysis and PET scans. JCM provided support for recruitment and clinical measures from the Knight Alzheimer’s Disease Research Center. DH was responsible for scientific input. As Principle Investigator, RJB was responsible for the conception of hypotheses, scientific and clinical design of study, funding and directing the study, and analysis of results. BWP, DLE and RJB were primarily responsible for writing the manuscript. All authors reviewed the manuscript.
References
- 1.Thies W, Bleiler L, Alzheimer’s A. 2013 Alzheimer’s disease facts and figures Alzheimer’s Association. Alzheimers & Dementia. 2013 Mar;9(2):208–45. doi: 10.1016/j.jalz.2013.02.003. [DOI] [PubMed] [Google Scholar]
- 2.Jorm AF, Jolley D. The incidence of dementia - A meta-analysis. Neurology. 1998 Sep;51(3):728–33. doi: 10.1212/wnl.51.3.728. [DOI] [PubMed] [Google Scholar]
- 3.Qiu C, Kivipelto M, von Strauss E. Epidemiology of Alzheimer’s disease: occurrence, determinants, and strategies toward intervention. Dialogues in clinical neuroscience. 2009;11(2):111–28. doi: 10.31887/DCNS.2009.11.2/cqiu. [DOI] [PMC free article] [PubMed] [Google Scholar]
- 4.Roses AD, Saunders AM. APOE is a major susceptibility gene for Alzheimer’s disease. Current opinion in biotechnology 1994. 1994 Dec;5(6):663–7. doi: 10.1016/0958-1669(94)90091-4. [DOI] [PubMed] [Google Scholar]
- 5.Ryman DC, Acosta-Baena N, Aisen PS, et al. Symptom onset in autosomal dominant Alzheimer disease: A systematic review and meta-analysis. Neurology. 2014;83(3):253–60. doi: 10.1212/WNL.0000000000000596. [DOI] [PMC free article] [PubMed] [Google Scholar]
- 6.Goate A, Chartierharlin MC, Mullan M, et al. Segregation of a Missense Mutation in the Amyloid Precursor Protein Gene with Familial Alzheimers-Disease. Nature. 1991 Feb 21;349(6311):704–6. doi: 10.1038/349704a0. [DOI] [PubMed] [Google Scholar]
- 7.Stgeorgehyslop P, Haines J, Rogaev E, et al. Genetic-Evidence for a Novel Familial Alzheimers-Disease Locus on Chromosome-14. Nature Genetics. 1992 Dec;2(4):330–4. doi: 10.1038/ng1292-330. [DOI] [PubMed] [Google Scholar]
- 8.Levylahad E, Wasco W, Poorkaj P, et al. Candidate Gene for the Chromosome-1 Familial Azheimers-Disease Locus. Science. 1995 Aug;269(5226):973–7. doi: 10.1126/science.7638622. [DOI] [PubMed] [Google Scholar]
- 9.Sherrington R, Rogaev EI, Liang Y, et al. Cloning of a Gene Bearing Missense Mutations in Early-Onset Familial Alzheimers-Disease. Nature. 1995 Jun 29;375(6534):754–60. doi: 10.1038/375754a0. [DOI] [PubMed] [Google Scholar]
- 10.Jonsson T, Atwal JK, Steinberg S, et al. A mutation in APP protects against Alzheimer’s disease and age-related cognitive decline. Nature. 2012 Aug 2;488(7409):96–9. doi: 10.1038/nature11283. [DOI] [PubMed] [Google Scholar]
- 11.Selkoe DJ. Physiological Production of the Beta-Amyloid Protein and the Mechanism of Alzheimers-Disease. Trends in Neurosciences. 1993 Oct;16(10):403–9. doi: 10.1016/0166-2236(93)90008-a. [DOI] [PubMed] [Google Scholar]
- 12.Bateman RJ, Munsell LY, Morris JC, Swarm R, Yarasheski KE, Holtzman DM. Human amyloid-beta synthesis and clearance rates as measured in cerebrospinal fluid in vivo. Nature medicine 2006. 2006 Jul;12(7):856–61. doi: 10.1038/nm1438. [DOI] [PMC free article] [PubMed] [Google Scholar]
- 13.Mawuenyega KG, Sigurdson W, Ovod V, et al. Decreased Clearance of CNS beta-Amyloid in Alzheimer’s Disease. Science. 2010 Dec 23;330(6012):1774. doi: 10.1126/science.1197623. [DOI] [PMC free article] [PubMed] [Google Scholar]
- 14.Potter R, Patterson BW, Elbert DL, et al. Increased in Vivo Amyloid-beta 42 Production, Exchange, and Loss in Presenilin Mutation Carriers. Science Translational Medicine. 2013 Jun 12;5(189) doi: 10.1126/scitranslmed.3005615. [DOI] [PMC free article] [PubMed] [Google Scholar]
- 15.Mintun MA, LaRossa GN, Sheline YI, et al. (11) PIB in a nondemented population - Potential antecedent marker of Alzheimer disease. Neurology. 2006 Aug 8;67(3):446–52. doi: 10.1212/01.wnl.0000228230.26044.a4. [DOI] [PubMed] [Google Scholar]
- 16.Morris JC. The Clinical Dementia Rating (CDR) - Current Version and Scoring Rules. Neurology. 1993 Nov;43(11):2412–4. doi: 10.1212/wnl.43.11.2412-a. [DOI] [PubMed] [Google Scholar]
- 17.Head D, Bugg JM, Goate AM, et al. Exercise engagement as a moderator of the effects of ApoE genotype on amyloid deposition. Archives of Neurology. 2012 May;69(5):636–43. doi: 10.1001/archneurol.2011.845. [DOI] [PMC free article] [PubMed] [Google Scholar]
- 18.Mawuenyega KG, Kasten T, Sigurdson W, Bateman RJ. Amyloid-beta isoform metabolism quantitation by stable isotope-labeled kinetics. Analytical Biochemistry. 2013 Sep 1;440(1):56–62. doi: 10.1016/j.ab.2013.04.031. [DOI] [PMC free article] [PubMed] [Google Scholar]
- 19.Reeds DN, Cade WT, Patterson BW, Powderly WG, Klein S, Yarasheski KE. Whole-body proteolysis rate is elevated in HIV-associated insulin resistance. Diabetes. 2006 Oct;55(10):2849–55. doi: 10.2337/db06-0255. [DOI] [PMC free article] [PubMed] [Google Scholar]
- 20.Ramakrishnan R. Studying apolipoprotein turnover with stable isotope tracers: correct analysis is by modeling enrichments. Journal of Lipid Research. 2006 Dec;47(12):2738–53. doi: 10.1194/jlr.M600302-JLR200. [DOI] [PMC free article] [PubMed] [Google Scholar]
- 21.Huang Y, Potter R, Sigurdson W, et al. Effects of Age and Amyloid Deposition on A beta Dynamics in the Human Central Nervous System. Archives of Neurology. 2012 Jan;69(1):51–8. doi: 10.1001/archneurol.2011.235. [DOI] [PMC free article] [PubMed] [Google Scholar]
- 22.Gao S, Hendrie HC, Hall KS. The relationships between age, sex, and the incidence of dementia and Alzheimer disease - A meta-analysis. Archives of General Psychiatry. 1998 Sep;55(9):809–15. doi: 10.1001/archpsyc.55.9.809. [DOI] [PubMed] [Google Scholar]
- 23.Barnes DE, Yaffe K. The projected effect of risk factor reduction on Alzheimer’s disease prevalence. Lancet Neurology. 2011 Sep;10(9):819–28. doi: 10.1016/S1474-4422(11)70072-2. [DOI] [PMC free article] [PubMed] [Google Scholar]
- 24.von Zglinicki T, Martin-Ruiz CM. Telomeres as biomarkers for ageing and age-related diseases. Current Molecular Medicine. 2005 Mar;5(2):197–203. doi: 10.2174/1566524053586545. [DOI] [PubMed] [Google Scholar]
- 25.Doraiswamy PM, Sperling RA, Coleman RE, et al. Amyloid-beta assessed by florbetapir F 18 PET and 18-month cognitive decline A multicenter study. Neurology. 2012 Oct;79(16):1636–44. doi: 10.1212/WNL.0b013e3182661f74. [DOI] [PMC free article] [PubMed] [Google Scholar]
- 26.Ewers M, Insel P, Jagust WJ, et al. CSF Biomarker and PIB-PET-Derived Beta-Amyloid Signature Predicts Metabolic, Gray Matter, and Cognitive Changes in Nondemented Subjects. Cerebral Cortex. 2012 Sep;22(9):1993–2004. doi: 10.1093/cercor/bhr271. [DOI] [PMC free article] [PubMed] [Google Scholar]
- 27.Lim YY, Maruff P, Pietrzak RH, et al. Effect of amyloid on memory and non-memory decline from preclinical to clinical Alzheimer’s disease. Brain. 2014 Jan;137:221–31. doi: 10.1093/brain/awt286. [DOI] [PubMed] [Google Scholar]
- 28.Bateman RJ, Xiong C, Benzinger TLS, et al. Clinical and Biomarker Changes in Dominantly Inherited Alzheimer’s Disease. New England Journal of Medicine. 2012 Aug 30;367(9):795–804. doi: 10.1056/NEJMoa1202753. [DOI] [PMC free article] [PubMed] [Google Scholar]
- 29.Kress BT, Iliff JJ, Xia M, et al. Impairment of Paravascular Clearance Pathways in the Aging Brain. Annals of Neurology. 2014 Dec;76(6):845–61. doi: 10.1002/ana.24271. [DOI] [PMC free article] [PubMed] [Google Scholar]
- 30.Hellstrom-Lindahl E, Ravid R, Nordberg A. Age-dependent decline of neprilysin in Alzheimer’s disease and normal brain: Inverse correlation with A beta levels. Neurobiology of Aging. 2008 Feb;29(2):210–21. doi: 10.1016/j.neurobiolaging.2006.10.010. [DOI] [PubMed] [Google Scholar]
- 31.Roberts KF, Elbert DL, Kasten TP, et al. Amyloid-beta Efflux from the Central Nervous System into the Plasma. Annals of Neurology. 2014 Dec;76(6):837–44. doi: 10.1002/ana.24270. [DOI] [PMC free article] [PubMed] [Google Scholar]
- 32.Uauy R, Winterer JC, Bilmazes C, et al. Changing pattern of whole-body protein-metabolism in aging humans. Journals of Gerontology. 1978;33(5):663–71. doi: 10.1093/geronj/33.5.663. [DOI] [PubMed] [Google Scholar]
- 33.Fu AZ, Nair SK. Age effect on fibrinogen and albumin synthesis in humans. American Journal of Physiology-Endocrinology and Metabolism. 1998 Dec;275(6):E1023–E30. doi: 10.1152/ajpendo.1998.275.6.E1023. [DOI] [PubMed] [Google Scholar]
- 34.Elbert DL, Patterson BW, Bateman RJ. Analysis of a compartmental model of amyloid beta production, irreversible loss and exchange in humans. Math Biosci. 2015 Mar;261:48–61. doi: 10.1016/j.mbs.2014.11.004. [DOI] [PMC free article] [PubMed] [Google Scholar]
- 35.Arnold SE, Hyman BT, Flory J, Damasio AR, Van Hoesen GW. The Topographical and Neuroanatomical Distribution of Neurofibrillary Tangles and Neuritic Plaques in the Cerebral Cortex of Patients with Alzheimer’s Disease. Cerebral Cortex. 1991 Jan;1(1):103–16. doi: 10.1093/cercor/1.1.103. [DOI] [PubMed] [Google Scholar]
- 36.Roher AE, Esh CL, Kokjohn TA, et al. Amyloid beta peptides in human plasma and tissues and their significance for Alzheimer’s disease. Alzheimers & Dementia. 2009 Jan;5(1):18–29. doi: 10.1016/j.jalz.2008.10.004. [DOI] [PMC free article] [PubMed] [Google Scholar]
- 37.Hellstrom-Lindahl E, Viitanen M, Marutle A. Comparison of A beta levels in the brain of familial and sporadic Alzheimer’s disease. Neurochemistry International. 2009 Sep;55(4):243–52. doi: 10.1016/j.neuint.2009.03.007. [DOI] [PMC free article] [PubMed] [Google Scholar]
- 38.Gravina SA, Ho LB, Eckman CB, et al. Amyloid-beta protein (A-Beta) in Alzheimers-disease brain - biochemical and immunocytochemical analysis with antibodies specific for forms ending at A-Beta-40 or A-Beta-42(43) Journal of Biological Chemistry. 1995 Mar 31;270(13):7013–6. doi: 10.1074/jbc.270.13.7013. [DOI] [PubMed] [Google Scholar]
- 39.Naslund J, Haroutunian V, Mohs R, et al. Correlation between elevated levels of amyloid beta-peptide in the brain and cognitive decline. Jama-Journal of the American Medical Association. 2000 Mar 22;283(12):1571–7. doi: 10.1001/jama.283.12.1571. [DOI] [PubMed] [Google Scholar]
- 40.Lewis H, Beher D, Cookson N, et al. Quantification of Alzheimer pathology in ageing and dementia: age-related accumulation of amyloid-beta(42) peptide in vascular dementia. Neuropathology and Applied Neurobiology. 2006 Apr;32(2):103–18. doi: 10.1111/j.1365-2990.2006.00696.x. [DOI] [PubMed] [Google Scholar]
- 41.Masters C. How to Change and Monitor the Rates of Aβ Amyloid Accumulation and Cognitive Decline in Alzheimer’s Disease. Copenhagen, Denmark: Alzheimer’s Association International Conference; 2014. [Google Scholar]
- 42.Jack CR, Jr, Knopman DS, Jagust WJ, et al. Tracking pathophysiological processes in Alzheimer’s disease: an updated hypothetical model of dynamic biomarkers. Lancet Neurology. 2013 Feb;12(2):207–16. doi: 10.1016/S1474-4422(12)70291-0. [DOI] [PMC free article] [PubMed] [Google Scholar]
- 43.Rowe CC, Ellis KA, Rimajova M, et al. Amyloid imaging results from the Australian Imaging, Biomarkers and Lifestyle (AIBL) study of aging. Neurobiology of Aging. 2010 Aug;31(8):1275–83. doi: 10.1016/j.neurobiolaging.2010.04.007. [DOI] [PubMed] [Google Scholar]