

Abstract
As the early stage of Alzheimer's disease (AD), mild cognitive impairment (MCI) has high chance to convert to AD. Effective prediction of such conversion from MCI to AD is of great importance for early diagnosis of AD and also for evaluating AD risk pre-symptomatically. Unlike most previous methods that used only the samples from a target domain to train a classifier, in this paper, we propose a novel multimodal manifold-regularized transfer learning (M2TL) method that jointly utilizes samples from another domain (e.g., AD vs. normal controls (NC)) as well as unlabeled samples to boost the performance of the MCI conversion prediction. Specifically, the proposed M2TL method includes two key components. The first one is a kernel-based maximum mean discrepancy criterion, which helps eliminate the potential negative effect induced by the distributional difference between the auxiliary domain (i.e., AD and NC) and the target domain (i.e., MCI converters (MCI-C) and MCI non-converters (MCI-NC)). The second one is a semi-supervised multimodal manifold-regularized least squares classification method, where the target-domain samples, the auxiliary-domain samples, and the unlabeled samples can be jointly used for training our classifier. Furthermore, with the integration of a group sparsity constraint into our objective function, the proposed M2TL has a capability of selecting the informative samples to build a robust classifier. Experimental results on the Alzheimer's Disease Neuroimaging Initiative (ADNI) database validate the effectiveness of the proposed method by significantly improving the classification accuracy of 80.1 % for MCI conversion prediction, and also outperforming the state-of-the-art methods.
Keywords: Mild cognitive impairment conversion, Manifold regularization, Transfer learning, Semi-supervised learning, Multimodal classification, Sample selection
Introduction
Alzheimer's disease (AD) is the most common cause of dementia in people aged 65 or older, and the incidence rate of AD is doubling every 5 years (Hurd et al. 2013). From a clinical perspective, it is of great importance to diagnose the early stage of AD, mild cognitive impairment (MCI), for timely therapy or possible delay thanks to the pharmacological advances. In this regard, the prediction of whether an MCI subject will progress to AD (MCI converter, MCI-C) or not (MCI non-converter, MCI-NC) within a few years is particularly important.
Early studies mainly focused on brain atrophy measurements from magnetic resonance imaging (MRI) scans (Chao et al. 2010; Chetelat et al. 2005b; deToledo-Morrell et al. 2004; Fan et al. 2008; Li et al. 2012; Misra et al. 2009; Risacher et al. 2009; Wang et al. 2011b), and used off-the-shelf machine learning tools to discriminate MCI-C from MCI-NC. However, those methods were short of high performance for clinical use. Meanwhile, other studies considered functional changes in the brain by using the fluorodeoxyglucose positron emission tomography (FDG-PET) (Chetelat et al. 2005a; Drzezga et al. 2003; Fellgiebel et al. 2007; Mosconi et al. 2004). In addition, cerebrospinal fluid (CSF) levels of Aβ42, total-tau (t-tau), and phosphor-tau (p-tau) have also been considered as biomarkers for diagnosis and tracking MCI progression (Bouwman et al. 2007; Davatzikos et al. 2011; Lehmann et al. 2012; Vemuri et al. 2009a, b). Recently, there are efforts for fusing multimodal information for diagnosis, which helps improve performance compared to the method using the single-modal biomarkers as demonstrated in (Davatzikos et al. 2011; Jie et al. 2015; Westman et al. 2012; Zhang et al. 2012a, b). The rationale for fusing the multimodal information is that different modalities convey different properties, each of which can provide complementary information in discriminating MCI-C from MCI-NC.
From a machine learning point of view, the number of samples available to build a generalized model for the MCI-C prediction is in general overwhelmed by feature dimensionality. In other words, the number of training samples (including both MCI-C and MCI-NC subjects) is usually very limited, while the feature dimensionality is much higher. This so-called small-sample-size problem has been one of the main challenges in neuroimaging data analysis. To this end, several advanced machine learning methods have been proposed to reduce the feature dimensionality. For example, Zhang et al. used a multi-task learning method to select informative features for joint regression and classification tasks by using multi-modality data (i.e., MRI, FDG-PET, and CSF), and achieved an accuracy of 73.9 % on the dataset of 43 MCI-C and 48 MCI-NC subjects (Zhang et al. 2012b). Cho et al. adopted a manifold harmonic transform method by using the cortical thickness data and reported a sensitivity of 63 % and a specificity of 76 % on the dataset of 72 MCI-C and 131 MCI-NC subjects (Cho et al. 2012). Duchesne et al. used the morphological factor method based on MRI data and presented an accuracy of 72.3 % on the dataset of 20 MCI-C and 29 MCI-NC subjects (Duchesne and Mouiha 2011). Unlike the approaches of reducing feature dimensionality for addressing the small-sample-size problem, several groups have applied a semi-supervised learning (SSL) method by increasing the number of training samples with unlabeled samples, which are often much easier to obtain (Cheng et al. 2013a; Filipovych et al. 2011a, b; Zhang and Shen 2011).
To the best of our knowledge, most of the previous methods assumed that the training and the testing samples lied in the same feature space and also shared the same distribution. Therefore, they only used target-related samples to build a classifier, where samples not directly related to the target domain cannot be used. Meanwhile, recent studies have shown that the task of identifying MCI-C from MCI-NC is related to the task of discriminating AD and normal control (NC) (Filipovych et al. 2011a). Although they may follow different data distributions, the knowledge learned from AD and NC classification can be transferred to the MCI-C and MCI-NC classification task, which may further improve the performance of MCI conversion prediction. In the machine learning community, the use of this kind of knowledge transfer to build a generalized model is called transfer learning (Duan et al. 2012; Kuzborskij and Orabona 2013; Pan and Yang 2010; Yang et al. 2007, 2013). Hereafter, we call the domain of our interest the target domain (i.e., MCI-C and MCI-NC), while the other domain is an auxiliary domain (i.e., AD and NC). Recently, transfer learning techniques have been successfully introduced into medical imaging analysis (Cheng et al. 2012, 2013b). For example, a domain transfer Support Vector Machine (SVM) was proposed for MCI conversion prediction, which achieved enhanced classification performance with the help of samples from an auxiliary domain (i.e., AD and NC) (Cheng et al. 2012).
In this paper, we propose a `multimodal manifold-regularized transfer learning' method, in which we effectively combine the methods of SSL and transfer learning for MCI conversion prediction. With regard to the distributional discrepancy between a target domain (i.e., MCI-C and MCI-NC) and an auxiliary domain (i.e., AD and NC), we use a kernel-based maximum mean discrepancy criterion. We also design a cross-domain Laplacian matrix to reflect the relations among samples of the target domain, samples of the auxiliary domain, and also the unlabeled samples. Finally, by using a group sparsity constraint in our objective function, the proposed method allows us to select samples informative to predict the target class labels. We validate the efficacy of our proposed method by conducting experiments on the publicly available ADNI dataset and compare our method with the state-of-the-art methods.
Materials
ADNI database
The data used in the preparation of this paper were obtained from the Alzheimer's Disease Neuroimaging Initiative (ADNI) database (http://adni.loni.usc.edu/). ADNI researchers collect, validate and utilize data such as MRI and PET images, genetics, cognitive tests, CSF, and blood biomarkers as predictors for Alzheimer's disease. Data from the North American ADNI's study participants, including Alzheimer's disease patients, mild cognitive impairment subjects and elderly controls, are available in this database. The ADNI was launched in 2003 by the National Institute on Aging (NIA), the National Institute of Biomedical Imaging and Bioengineering (NIBIB), the Food and Drug Administration (FDA), private pharmaceutical companies, and non-profit organizations, as a $60 million, 5-year public-private partnership. The primary goal of ADNI has been to test whether the serial MRI, PET, other biological markers, and clinical and neuropsychological assessments can be combined to measure the progression of MCI and early AD. Determination of sensitive and specific markers of very early AD progression is intended to aid researchers and clinicians to develop new treatments and monitor their effectiveness, as well as lessen the time and cost of clinical trials.
The ADNI is the result of efforts of many co-investigators from a broad range of academic institutions and private corporations, and subjects have been recruited from over 50 sites across the U.S. and Canada. The initial goal of ADNI was to recruit 800 adults, aged 55 to 90, to participate in the research approximately 200 cognitively normal older individuals to be followed for 3 years, 400 people with MCI to be followed for 3 years, and 200 people with early AD to be followed for 2 years (see www.adni-info.org for up-to-date information). The research protocol was approved by each local institutional review board, and the written informed consent was obtained from each participant.
Subjects
The ADNI general eligibility criteria are described at www.adni-info.org. Briefly, subjects are between 55 and 90 years of age, and have a study partner able to provide an independent evaluation of functioning. Specific psychoactive medications were excluded. General inclusion/exclusion criteria are as follows: 1) healthy subjects: MMSE scores between 24 and 30, a Clinical Dementia Rating (CDR) of 0, non-depressed, non-MCI, and non-demented; 2) MCI subjects: MMSE scores between 24 and 30, a memory complaint, having objective memory loss measured by education adjusted scores on Wechsler Memory Scale Logical Memory II, a CDR of 0.5, absence of significant levels of impairment in other cognitive domains, essentially preserved activities of daily living, and an absence of dementia; and 3) Mild AD: MMSE scores between 20 and 26, CDR of 0.5 or 1.0, and meets the National Institute of Neurological and Communicative Disorders and Stroke and the Alzheimer's Disease and Related Disorders Association (NINCDS/ADRDA) criteria for probable AD.
MRI, PET, and CSF acquisition
A detailed description of the ADNI data acquisition of MRI, PET, and CSF can be found in (Zhang et al. 2011). Specifically, the structural MR scans were acquired from 1.5T scanners. We downloaded raw Digital Imaging and Communications in Medicine (DICOM) MRI scans from the public ADNI website (www.loni.ucla.edu/ADNI), reviewed for quality, and corrected spatial distortion caused by gradient nonlinearity and B1 field inhomogeneity. The PET images were acquired 30–60 min post-injection, averaged, spatially aligned, interpolated to a standard voxel size, intensity normalized, and smoothed to a common resolution of 8 mm full width at half maximum. The CSF data were collected in the morning after an overnight fast using a 20- or 24-gauge spinal needle, frozen within 1 h of collection, and transported on dry ice to the ADNI Biomarker Core laboratory at the University of Pennsylvania Medical Center. In this study, we used Aβ42, t-tau, and p-tau as CSF features.
Image pre-processing and feature extraction
All MRI and PET images were pre-processed by first performing an anterior commissure-posterior commissure (AC-PC) correction using the MIPAV software (CIT 2012). The AC-PC corrected images were resampled to 256×256×256, and the N3 algorithm (Sled et al. 1998) was used to correct intensity inhomogeneity. For the MRI images, a skull stripping method (Wang et al. 2011a) was performed, and the skull stripping results were manually reviewed to ensure clean skull and dura removal. The cerebellum was removed by first registering the skull stripped image to a manually-labeled cerebellum template, and then removing all voxels within the labeled cerebellum mask. FAST in FSL (Zhang et al. 2001) was then used to segment the human brain into three different tissues: grey matter (GM), white matter (WM), and cerebro-spinal fluid (CSF). We used HAMMER (Shen and Davatzikos 2002) for registration. After registration, the subject-labeled image was generated based on the Jacob template (Kabani et al. 1998) that dissects a brain into 93 manually labeled ROIs. Then, for each of 93 ROIs, we computed the GM tissue volume in an ROI as a feature. For the PET images, we used a rigid transformation to align them onto their respective MRT1 image of the same subject, and then computed the average intensity of each ROI as a feature. In total, for each subject, we extracted 189 features including 93 MRI features, 93 PET features, and 3 CSF features.
Proposed method
In this section, we describe our method to classify between MCI-C and MCI-NC. After depicting a general overview of our framework, we formulate a multimodal manifold- regularized transfer learning (M2TL) method and provide an optimization algorithm to solve our objective function. Then, we explain our classification scheme with a sample selection procedure by using the proposed M2TL method.
Overview
In Fig. 1, we illustrate the proposed framework for MCI conversion prediction based on our M2TL method. Specifically, our framework consists of three main components, i.e., (1) image pre-processing, (2) M2TL-based sample selection, and (3) M2TL-based classification. As shown in Fig. 1, we first pre-process all MRI and PET images, and extract features from each modality as described in the Image pre-processing and feature extraction section. Then, we select informative samples for building a generalized model via the proposed M2TL method. We finally make a decision using both the sample weights and the modality weights trained in our M2TL method.
Fig. 1.
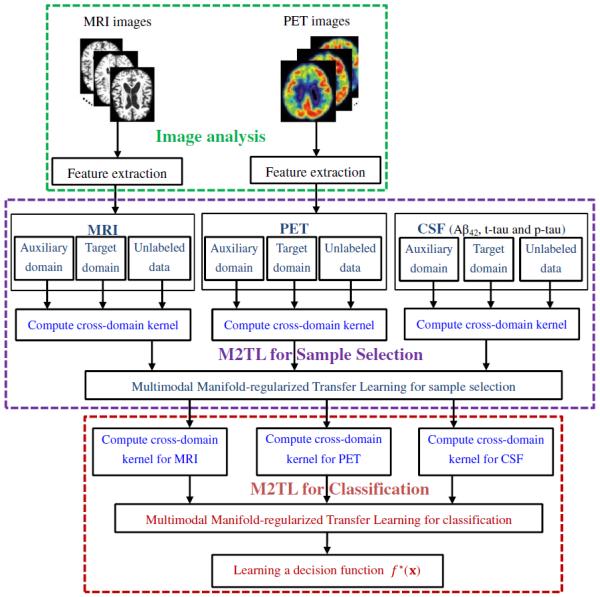
The system diagram of our framework for MCI conversion prediction using the proposed multimodal manifold-regularized transfer learning (M2TL) method
Multimodal manifold-regularized transfer learning (M2TL)
Unlike the previous methods that only considered samples of the target domain in model training, in this work, we use samples of different domains as well as unlabeled samples to build a generalized model. Furthermore, we use multimodal samples. Hereafter, we denote M as the number of different modalities with an index m∈{1,…,M} throughout the whole paper. Assume that we have NA samples with class labels in the auxiliary domain (i.e., AD and NC), denoted as , where is the a-th sample and is its corresponding class label (e.g., AD as +1 and NC as −1). Also, assume that we have labeled samples of the target domain, denoted as , where is the l-th sample and is the corresponding class label (e.g., MCI-C as +1 and MCI-NC as −1). Similarly, we have unlabeled samples of the target domain, denoted as . We use to represent the total number of samples in the target domain, i.e., . Also, is the total number of all samples.
In this work, we use a traditional regularized least square method (Belkin et al. 2006) to design our model for classification, and use all the available data from the auxiliary domain as well as the target domain to build a more generalized model. However, there may be some noise and irrelevant samples in the auxiliary domain as well as in the target domain, especially for the case of using multimodal biomarkers. To remove the noise and irrelevant samples from different modalities consistently, we introduce an L1/L2-norm based regularizer on weight matrix (i.e., W2,1), which can simultaneously remove a common subset of samples relevant to all modalities (Zhang et al. 2012b). In addition, by simultaneously performing sample selection for multimodal data, it is very helpful to suppress noise in the individual modalities. Accordingly, the base model can be written as follows:
| (1) |
Where Y is the label vector and , J is a diagonal matrix with the first diagonal entries to be 1 and the remaining diagonal entries to be 0, λm is a modality weighting factor, W = [w1,w2,…wM] ∈ RN × M denotes a weight matrix whose i-th row wi is the vector of coefficients associated with the i-th training sample across different modalities, and μ>0 is a sparsity control parameter. The symbol ' denotes the transpose of a matrix. It is worth noting that a `group sparsity' regularization in Eq. (1) is used for joint selection or un-selection of samples across different modalities based on the L1/L2-norm, i.e., . As for the selection of Y and J, according to the weight matrix W whose elements in some rows are all zeros, we just select those corresponding samples and their labels (Y and J) with non-zero weights. In Eq. (1), Km is a compound cross-domain kernel matrix over Am and Tm. In the following, we will introduce how to compute this cross-domain kernel matrix Km for implementing the knowledge fusion from both auxiliary and target domains (including labeled and unlabeled samples).
Here, the instance-transfer approach (Dai et al. 2007) is used to link the auxiliary domain data to the target domain data. To be specific, we first define the kernel matrices from the auxiliary domain and the target domain as and , respectively. Here, and are samples in the auxiliary and target domains, respectively, NA and NT are the numbers of samples in the auxiliary and target domains, respectively. Then, we define the cross-domain kernel matrices from the auxiliary domain to the target domain, and also from the target domain to the auxiliary domain as , and respectively. Finally, the cross-domain kernel matrix Km can be computed as: , which can be seen as the similarity between pairwise samples in the cross-domain for the m-th modality. In our study, the linear kernel function is used.
Note that the base model in Eq. (1) treats the samples from the auxiliary domain (i.e., AD and NC) and the unlabeled samples equally as the labeled samples from the target domain (i.e., MC-C and MC-NC) with no consideration of their own distributions. However, due to the potential distributional discrepancy between domains, i.e., the target domain (MCI-C and MCI-NC) and the auxiliary domain (AD and NC), the base model would not successfully combine them in learning. To this end, we utilize a maximum mean discrepancy (MMD) criterion (Borgwardt et al. 2006; Duan et al. 2012), which was originally designed to measure whether two sets of data are from the same or different probability distributions. Specifically, we use a kernel-based MMD criterion formulated as follows:
| (2) |
where , tr(·) denotes a trace of a matrix, and the symbol' denotes the transpose of a matrix.
Regarding to the SSL method that utilizes the unlabeled samples to train a classifier, we define a compound cross-domain Laplacian matrix on the m-th modality as follows:
| (3) |
where and are the Laplacian matrices over the auxiliary domain and the target domain, respectively. Here, and are the similarity matrices for the samples of the auxiliary domain and the samples of the target domain, respectively, and and are the diagonal matrices with elements and respectively. In conjunction with the compound cross-domain kernel matrix Km and the weight coefficient vector wm, we define a manifold regularization function (Belkin et al. 2006) as follows:
| (4) |
By integrating a kernel-based MMD criterion in Eq. (2) and a manifold regularization function in Eq. (4) into the base model in Eq. (1), we define our objective function as follows:
| (5) |
where γ>0 is a regularization control parameter. We call our method a `multimodal manifold-regularized transfer learning method' (M2TL). In Eq. (5), the first term tr(KmS) is the kernel-based MMD criterion, which can help eliminate the potential negative effect introduced by the distributional difference between the auxiliary domain and the target domain. The manifold regularization term R(Λm,Km,wm)=(Kmwm)′Λm(Kmwm) can capture the geometry of the probability distribution between the labeled and unlabeled data via the compound cross-domain Laplacian matrix Λm. By minimizing Eq. (5), we can learn a converged W among multi-domains, labeled and unlabeled data, and multimodal data. It is worth noting that, because of using `group sparsity', the elements of some rows in the common weight matrix W will be all zeros. For sample selection, we just keep those samples with non-zero weights.
To solve the optimization problem of Eq. (5), we employ an accelerated gradient descent (AGD) method (Chen et al. 2009). To be specific, we decompose the objective function of Eq. (5) into two parts of a smooth term G(W) and a non-smooth term H(W) as follows:
| (6) |
| (7) |
We then define the generalized gradient update rule as follows:
| (8) |
where ▽G(Wt) denotes the gradient of G(W) at the point Wt at the t-th iteration, h is a step size, 〈W–Wt, ▽G(Wt)〉= tr((W–Wt)′▽G(Wt)) is the matrix inner product, and ∥ ∥Fdenotes a Frobenius norm. According to (Chen et al. 2009), the generalized gradient update rule of Eq. (8) can be further decomposed into N separate sub-problems with a gradient mapping update approach. We summarize the details of AGD algorithm in Algorithm 1.
|
| |
| Algorithm 1. AGD algorithm for M2TL in Eq. (5) | |
| 1. | Initialization: h0 > 0,η > 1, W0, , h = h0 and α0 = 1. |
| 2. | for t=0,1,2,… until convergence of Wt do: |
| 3. | Set h=ht |
| 4. | while , h = ηh |
| 5. | Set ht+1=h and compute |
| Wt+1 = argminwQht+1 (), , βt+1 = Wt+1–Wt and | |
| end-while | |
| 6. | end-for |
|
| |
Sample selection and classification
It is noteworthy that, due to the use of the group sparsity constraint in Eq. (5), after optimization, some row vectors in the optimized weight matrix W have their l2-norm being close to or equal to zero. This implies that the corresponding samples are less informative for classification. This favorable property allows us to use the proposed M2TL method for sample selection in a data-driven manner, and when making a decision we can only use those selected samples.
We finally build our classifier by performing the proposed M2TL on the selected samples. After learning the optimal weight matrix , given a test sample , we can then make a decision with the following multi-kernel SVM function f*(x):
| (9) |
where is the testing sample's kernel vector on the m-th modality (between the testing sample xm and the i-th selected training sample in the cross-domain).
Results
In this section, we first describe the experimental settings in our experiments and then evaluate the effectiveness of the proposed M2TL method on the ADNI dataset, by comparing with other methods in the literature. In addition, we also use the M2TL method to select the informative unlabeled samples before classification, and then evaluate the classification performance of M2TL with respect to the use of a different number of samples from the auxiliary domain and a different number of unlabeled samples, respectively.
Experimental settings
We used the samples of 202 subjects (51 AD, 43 MCI-C, 56 MCI-NC, and 52 NC), for whom the baseline MRI, PET, and CSF data were all available. Also, for each of the three modalities, we included another set of unlabeled samples from 153 randomly selected subjects. We regarded the samples of 43 MCI-C and 56 MCI-NC subjects as the target domain data and also those of 51 AD and 52 NC subjects as the auxiliary domain data. It is worth noting that, for all 99 MCI subjects (43 MCI-C + 56 MCI-NC), during the 24-month follow-up period, 43 MCI subjects converted to AD and 56 remained stable.
To evaluate the performances of the proposed method as well as the competing methods, we used a 10-fold cross-validation strategy by partitioning the target domain data into training and testing subsets. In particular, 99 MCI samples in our target domain were partitioned into 10 subsets (each subset with a roughly equal size), and then one subset was successively selected as the testing samples and all the remaining subsets were used for training. To avoid the possible bias occurring during sample partitioning, we repeated this process 10 times. We reported the performances in terms of area under the receiver operating characteristic curve (AUC), accuracy (ACC), sensitivity (SEN), and specificity (SPE).
We compared the proposed method with a standard SVM, domain transfer SVM (DTSVM) (Cheng et al. 2012), and manifold-regularized Laplacian SVM (LapSVM) (Belkin et al. 2006). The main difference among these methods lies in how much information they use in learning from the available samples:
SVM: labeled samples from the target domain;
DTSVM: labeled samples from both the target and the auxiliary domains;
LapSVM: both labeled and unlabeled samples from the target domain.
The standard SVM method was implemented using the LIBSVM toolbox (Chang and Lin 2001) with a linear kernel and a default value for the parameter C (i.e., C=1). We used a linear kernel for a Laplacian matrix in both M2TL and LapSVM methods. The optimal model parameters of γ and μ in our M2TL method were chosen from the range of {0.001, 0.01,0.03,0.06,0.09,0.1,0.2,0.4,0.6,0.8} by a nested 10-fold cross-validation on the training data.
In the experiments, both single-modal and multimodal features were used to evaluate the proposed method as well as other methods. A multi-kernel combination technique (Zhang et al. 2011) was adopted for multi-modality fusion. To be specific, the combination weights for multi-kernels were learned within a nested cross-validation via a grid search in the range of 0 and 1 at a step size of 0.1. The optimal parameter λm in the proposed M2TL method was determined in the same manner. Before training models, we normalized features by following (Zhang et al. 2011).
Comparison between M2TL and other methods
Here, we first compare the proposed M2TL method without sample selection with the competing methods, with results reported in Table 1. Note that Table 1 shows the averaged results of the 10-fold cross-validation performed on 10 independent experiments. We also presented the ROC curves achieved by different methods in Fig. 2. From Table 1 and Fig. 2, we can see that the proposed M2TL method achieved better performance than DTSVM, LapSVM, and SVM in terms of both accuracy and sensitivity. At the same time, in most cases, the proposed M2TL method outperformed the competing methods in terms of specificity and AUC. Specifically, by using multimodal data, M2TL achieved a classification accuracy of 77.8 %, which significantly outperformed DTSVM (69.4 %), LapSVM (69.1 %), and SVM (63.8). At the same time, by using single modality, the proposed M2TL method usually achieved better performances than DTSVM, LapSVM, and SVM. These results validate the efficacy of our M2TL method, which uses both labeled and unlabeled samples from the auxiliary domain (i.e., AD and NC) and the target domain (i.e., MCI-C and MCI-NC) in MCI conversion prediction.
Table 1.
Comparison of performances of M2TL, DTSVM, LapSVM, and SVM for MCI-C/MCI-NC classification using different types of modalities
| Modality | Method | ACC (%) | SEN (%) | SPE (%) | AUC |
|---|---|---|---|---|---|
| Multimodal (MRI+CSF+PET) | M2TL | 77.8 | 83.9 | 69.8 | 0.814 |
| DTSVM | 69.4 | 64.3 | 73.5 | 0.736 | |
| LapSVM | 69.1 | 74.3 | 62.1 | 0.751 | |
| SVM | 63.8 | 58.8 | 67.7 | 0.683 | |
| MRI | M2TL | 72.1 | 75.1 | 68.2 | 0.768 |
| DTSVM | 63.3 | 59.8 | 66.0 | 0.700 | |
| LapSVM | 65.9 | 69.6 | 61.0 | 0.686 | |
| SVM | 53.9 | 47.6 | 57.7 | 0.554 | |
| CSF | M2TL | 66.7 | 74.6 | 60.5 | 0.668 |
| DTSVM | 66.2 | 60.3 | 70.8 | 0.701 | |
| LapSVM | 62.1 | 66.2 | 56.8 | 0.660 | |
| SVM | 60.8 | 55.2 | 65.0 | 0.647 | |
| PET | M2TL | 68.1 | 71.5 | 63.7 | 0.734 |
| DTSVM | 67.0 | 59.6 | 12.1 | 0.732 | |
| LapSVM | 61.6 | 65.7 | 56.1 | 0.661 | |
| SVM | 58.0 | 52.1 | 62.5 | 0.612 |
ACC Accuracy, SEN Sensitivity, SPE Specificity
Fig. 2.
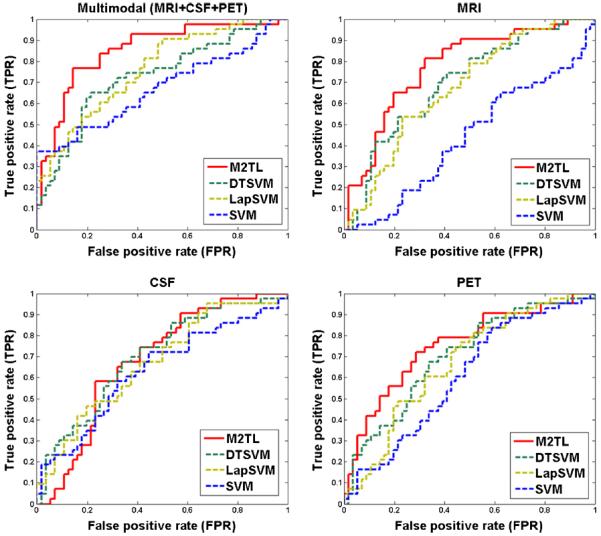
Comparison of the ROC curves of the proposed M2TL method and the competing methods (DTSVM, LapSVM, and SVM) for MCI-C/MCI-NC classification using multi-modality and single-modality, respectively
Comparison between M2TL with sample selection and other methods
To investigate the influence of the proposed sample selection method, we also compare the proposed method without sample selection (M2TL) and with sample selection (M2TL+SS) to LapSVM with Sample Selection (LapSVM+SS), and also DTSVM with Sample Selection (DTSVM+SS). Specifically, for the methods of LapSVM+SS and DTSVM+SS, we first applied our M2TL method for sample selection and then trained the respective LapSVM and DTSVM on the selected samples. It is worth noting that, because labeled samples from the auxiliary and the target domains are more informative than unlabeled samples, we applied the sample selection strategy only for unlabeled samples. The experimental results are shown in Table 2.
Table 2.
Comparison of performances of M2TL+SS, M2TL, LapSVM+SS, and DTSVM+SS, for MCI-C/MCI-NC classification using different types of modalities
| Modality | Method | ACC (%) | SEN (%) | SPE (%) | AUC |
|---|---|---|---|---|---|
| Multimodal (MRI+CSF+PET) | M2TL+SS | 80.1 | 85.3 | 73.3 | 0.852 |
| M2TL | 77.8 | 83.9 | 69.8 | 0.814 | |
| LapSVM+SS | 71.6 | 81.3 | 58.9 | 0.751 | |
| DTSVM+SS | 71.3 | 84.0 | 61.4 | 0.755 | |
| MRI | M2TL+SS | 72.3 | 75.3 | 68.4 | 0.768 |
| M2TL | 72.1 | 75.1 | 68.2 | 0.768 | |
| LapSVM+SS | 66.0 | 69.7 | 61.2 | 0.684 | |
| DTSVM+SS | 65.6 | 66.2 | 65.3 | 0.686 | |
| CSF | M2TL+SS | 67.8 | 75.2 | 62.9 | 0.670 |
| M2TL | 66.7 | 74.6 | 60.5 | 0.668 | |
| LapSVM+SS | 63.3 | 67.5 | 57.9 | 0.664 | |
| DTSVM+SS | 67.0 | 74.0 | 61.5 | 0.705 | |
| PET | M2TL+SS | 71.4 | 74.5 | 67.5 | 0.800 |
| M2TL | 68.1 | 71.5 | 63.7 | 0.734 | |
| LapSVM+SS | 66.3 | 70.0 | 61.6 | 0.701 | |
| DTSVM+SS | 68.1 | 72.9 | 60.8 | 0.726 |
ACC Accuracy, SEN Sensitivity, SPE Specificity
From Table 2, we can see that M2TL+SS with multimodal data achieved a classification accuracy of 80.1 %, which is significantly better than M2TL (77.8 %), LapSVM+SS (71.6 %), and DTSVM+SS (71.3 %). With single modality, especially with PET, M2TL+SS still achieved better performance than M2TL, LapSVM+SS, and DTSVM+SS. Recalling the experimental results reported in Table 1, we could say that the proposed M2TL-based sample selection method has the effect of promoting the performance of MCI conversion prediction. These results validate the efficacy of the proposed M2TL-based sample selection.
Furthermore, we investigated the influence of the number samples from the auxiliary domain for M2TL+SS and M2TL by comparing to other transfer learning methods, i.e., DTSVM and DTSVM+SS. We randomly chose samples from the auxiliary domain and then reported the average accuracies in Fig. 3, from which we can see that the proposed M2TL+SS and M2TL consistently outperformed DTSVM+SS and DTSVM. In addition, with the increase of the number of samples from the auxiliary domain, the classification accuracy rises monotonically for M2TL+SS, M2TL, and DTSVM.
Fig. 3.
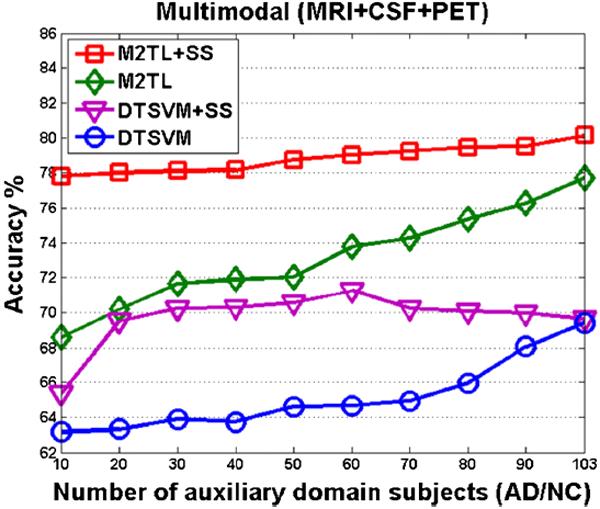
The changes of accuracies of M2TL+SS, M2TL, DTSVM+SS and DTSVM with respect to the used number of samples from the auxiliary domain
Finally, we investigated the influence of the number of unlabeled samples for the proposed M2TL+SS and M2TL methods, in comparison to two SSL methods (i.e., LapSVM+SS and LapSVM). The average accuracies achieved by these four different methods are reported in Fig. 4. Specifically, for M2TL and LapSVM methods, we randomly chose unlabeled samples and then performed M2TL and LapSVM for classification, respectively. On the other hand, for M2TL+SS and LapSVM+SS methods, we first conducted sample selection using M2TL to select samples from unlabeled samples and then performed M2TL and LapSVM for classification, respectively.
Fig. 4.
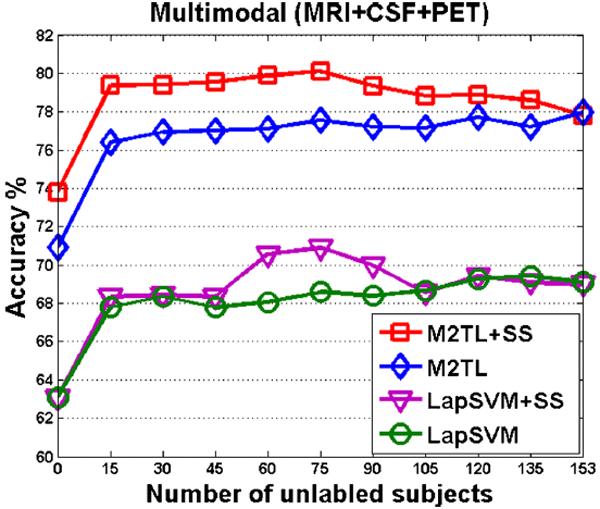
The changes of accuracies of M2TL+SS, M2TL, LapSVM+SS, and LapSVM with respect to the used number of unlabeled samples
As we can see from Fig. 4, regardless of the number of unlabeled samples, the proposed M2TL+SS and M2TL methods outperformed LapSVM+SS and LapSVM in terms of classification accuracy. As the used number of unlabelled subjects changes from 0 to 15, there are obvious improvements in accuracy by using four methods, which explicitly demonstrates that using unlabelled samples can improve classification performance. In addition, Fig. 4 shows that the classification accuracies of M2TL and LapSVM methods (based on random sample selection) rise gradually with the increase of the number of unlabelled samples. On the other hand, for M2TL+SS and LapSVM+SS methods, their corresponding performances are first improved as the number of unlabelled samples increases, and then dropped when too many (e.g., over 75) unlabelled subjects are used. This implies that our proposed M2TL method for sample selection can effectively select informative unlabelled samples and also avoid noisy or irrelevant samples for the underlying classification task.
Discussion
In this paper, we proposed a multimodal manifold-regularized transfer learning method to identify MCI-C and MCI-NC, in which we further used the samples of AD and NC and the unlabeled samples jointly. We evaluated the performance of our method on 202 labeled and 153 unlabeled baseline samples from ADNI database. The experimental results showed that the proposed method consistently and substantially improved the performance of MCI conversion prediction with a maximum accuracy of 80.1 %.
Use of all available samples in learning
In the field of neuroimaging-based brain disease diagnosis, there have been studies presenting relations among tasks of identifying different stages of disease, e.g., AD vs. NC and MCI-C vs. MCI-NC. Motivated by these studies, in this paper, we proposed a method that could use samples from different domains by means of transfer learning. Specifically, we adopted the AD/NC as an auxiliary domain to help the task of discriminating MCI-C from MCI-NC. From a machine learning point of view, transfer learning aims to apply the knowledge learned from one or more auxiliary domains to a target domain. However, due to the potential difference in distributions of auxiliary domains and the target domain, it is challenging to efficiently use such knowledge in learning. To handle the distributional discrepancy between domains, we used an MMD criterion to measure the similarity or dissimilarity between two sets of samples from different domains.
While it is difficult to get more labeled samples, it is relatively easy to obtain more unlabeled samples in general. In our previous work (Cheng et al. 2012), we used labeled auxiliary-domain samples to foster the generalization of a classifier in a target domain. In this work, we extended it to use unlabeled samples for further performance improvement. To be precise, we proposed a multimodal manifold-regularized transfer learning (M2TL) method for automatic selection of informative samples and also automatic rejection of uninformative samples to make a decision.
As a naïve way for transfer learning, we can apply the model trained on AD and NC to the task of MCI conversion prediction directly (Da et al. 2014; Eskildsen et al. 2013; Filipovych et al. 2011a; Young et al. 2013). We call this kind of method as a direct transfer learning (DTL), or direct semi-supervised transfer learning (DSSTL). In DTL, samples of AD and NC are treated as training data, while samples of MCI-C and MCI-NC are used for testing data; In DSSTL, samples of AD and NC are used as labeled data, while samples of MCI-C and MCI-NC are regarded as unlabeled data. Then, the model is trained based on both labeled and unlabeled data. Finally, samples of MCI-C and MCI-NC are treated as testing data to evaluate the performance of each learned model. In our additional experiment, we compared the proposed M2TL method with DTL and DSSTL using multimodal data (i.e., MRI+CSF+PET). The DTL method achieved a classification accuracy of 66.7 % and AUC of 0.702, and the DSSTL method achieved a classification accuracy of 70.9 % and AUC of 0.766. These results are much worse than those of the proposed M2TL method that produced the maximum classification accuracy of 80.1 % and AUC of 0.852. We believe that these results validated the advantage of the proposed M2TL method over other transfer learning methods.
Besides modalities used in this paper, i.e., MRI, PET, and CSF, there also exist other modalities (e.g., Diffusion Tensor Imaging (DTI) and Resting-state functional Magnetic Resonance Imaging (RS-fMRI)) which can be used for AD/MCI classification (Jie et al. 2014; Supekar et al. 2008; Wang et al. 2007; Wee et al. 2012, 2014; Zhu et al. 2014). It will be interesting to further investigate the incorporation of these modalities into our proposed M2TL model, which will be one of our future works.
M2TL model for sample selection
According to (Wang et al. 2011b), the sparse weight matrix can not only consistently select the informative samples from different modalities, but also indicate the contributions of different modalities and subjects in the prediction. Accordingly, we specifically count the number of non-zero elements from each column weight vector of W. Since we used a 10-fold cross-validation strategy in the experiments, we should count the frequency of each subject selected across all folds and all runs (i.e., a total of 100 times for 10-fold cross-validation with 10 independent runs) on the training set. Then, those subjects with frequency of 100 (i.e., always selected in all folds and all runs) are regarded as stable subjects.
For M2TL+SS, we obtained the number and percentage of stable subjects for different domains on the training set as follows: Auxiliary (90/103=87.38 %), Labeled target (69/90=76.67 %), and Unlabeled target (75/153=49.02 %). It shows that the most selected stable subjects are from the auxiliary domain, followed by the target domain. This observation is reasonable since AD and NC subjects are more separable than MCI-C and MCI-NC subjects, and thus the former is more important than the latter for robust classification.
In addition, we compute the sum of absolute values of each column weight vector, and find that the MRI modality is more important than the PET modality, and also the PET modality is more important than the CSF modality, i.e., wMRI>wPET>wCSF, which is consistent with results in Tables 1 and 2. In our current study, we only report results of excluding subjects (by sample selection methods), and the experimental results show that excluding certain subjects can further improve the classification performance (e.g., as shown in Tables 1 and 2). But we did not report results of excluding any modality since our previous works (Cheng et al. 2013a; Zhang et al. 2011) show that using more modalities often leads to better performance.
Effect of feature selection
To investigate the influence of feature selection on the performances of the proposed methods, we further performed a set of experiments by using an extra feature selection step, i.e., based on t-test statistics (Zhang et al. 2011), before sample selection and classification. Fig. 5 shows the classification accuracies achieved by our M2TL+SS and M2TL methods with the t-test based feature selection, with respect to the different number of selected features. As can be seen from Fig. 5, feature selection can help further improve the classification accuracy compared with the original methods using all features (without feature selection). We expect that the use of more advanced feature selection methods in the future could further improve the performance of our M2TL model.
Fig. 5.
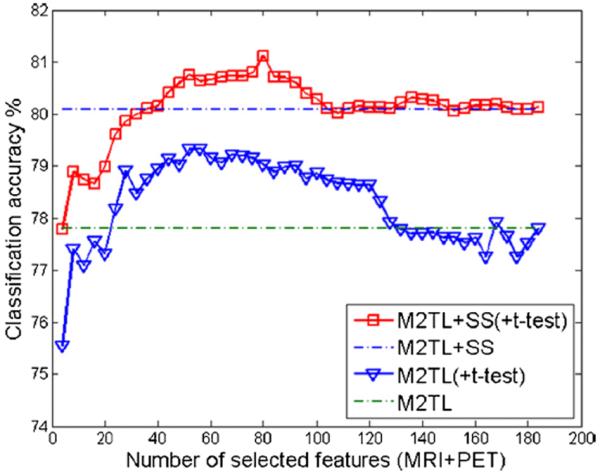
Classification accuracies of M2TL+SS and M2TL methods using a feature selection based on t-test statistics (namely M2TL+SS(+t-test) and M2TL(+t-test)), with respect to the different number of selected features for the multimodal case. Here, `MRI+PET' denotes the selected MRI and PET features. For comparison, the classification accuracies of M2TL+SS and M2TL methods without feature selection are also provided by the two dash lines
In the current study, we adopt a linear kernel to compute the kernel matrix, because it has been shown effective for multimodal classification of AD and MCI in our previous works (Zhang et al. 2011, 2012b). In future work, we will investigate using other kernel functions (e.g., Gaussian kernel) for computing a kernel matrix, which may provide more precise similarity measurement of the cross-domain kernel matrix.
Comparison with the state-of-the-art methods
Recently, many groups have focused on predicting the conversion of MCI to AD, i.e., identifying MCI-C and MCI-NC subjects (Cho et al. 2012; Coupé et al. 2012; Cuingnet et al. 2011; Davatzikos et al. 2011; Duchesne and Mouiha 2011; Eskildsen et al. 2013; Hinrichs et al. 2011; Lehmann et al. 2012; Leung et al. 2010; Misra et al. 2009; Wee et al. 2013; Westman et al. 2012; Young et al. 2013; Zhang et al. 2012a, b). In Table 3, we compare the performances of the proposed M2TL method with those of the state-of-the-art methods in terms of accuracy, sensitivity, specificity, and AUC, although some metrics are not available for certain studies. It should be noted that different modalities and different numbers of samples were used for different studies. Nevertheless, we would like to emphasize that, in most of performance measurements, our proposed method achieved better performance than the state-of-the-art methods in MCI conversion prediction.
Table 3.
Comparison with the state-of-the-art methods for MCI conversion prediction
| Method | Modalities | #Subjects | Performances |
|||
|---|---|---|---|---|---|---|
| ACC (%) | SEN (%) | SPE (%) | AUC | |||
| Duchesne and Mouiha 2011 | MRI | 20 MCI-C, 29 MCI-NC | 72.3 % | 75 % | 62 % | 0.794 |
| Hinrichs et al. 2011 | MRI, FDG-PET, CSF, APOE | 119 MCI | N/A | N/A | N/A | 0.7911 |
| Davatzikos et al. 2011 | MRI, CSF | 69 MCI-C, 170 MCI-NC | 61.7 % | 95 % | 38 % | 0.734 |
| Zhang et al. 2012a | MRI, FDG-PET, CSF | 38 MCI-C, 50 MCI-NC | 78.4 % | 79 % | 78 % | 0.768 |
| Coupé et al. 2012c | MRI | 167 MCI-C, 238 MCI-NC | 71 % | 70 % | 72 % | N/A |
| Wee et al. 2013 | MRI | 89 MCI-C, 111 MCI-NC | 75.05 % | N/A | N/A | 0.8426 |
| Westman et al. 2012 | MRI, CSF | 81 MCI-C, 81 MCI-NC | 68.5 % | 74.1 % | 63 % | 0.76 |
| Zhang et al. 2012b | MRI, FDG-PET, CSF | 43 MCI-C, 48 MCI-NC | 73.9 % | 68.6 % | 73.6 % | 0.797 |
| Cho et al. 2012 | MRI | 72 MCI-C, 131 MCI-NC | 71 % | 63 % | 76 % | N/A |
| Eskildsen et al. 2013 | MRI | 161 MCI-C, 227 MCI-NC | 75.4 % | 70.5 % | 77.6 % | 0.82 |
| Young et al. 2013 | MRI, FDG-PET, CSF, APOE | 47 MCI-C, 96 MCI-NC | 74.1 % | 78.7 % | 65.6 % | 0.795 |
| Proposed method | MRI, FDG-PET, CSF | 43 MCI-C, 56 MCI-NC | 80.1 % | 85.3 % | 73.3 % | 0.852 |
Limitations
The proposed method is based on multimodal data (e.g., MRI, PET, and CSF) and thus requires each subject to have the complete dataset. Such a requirement prevents the proposed method from utilizing a huge amount of available samples with incomplete data, i.e., missing of one or two modalities. For example, in the ADNI database, many subjects have incomplete data due to unavailability of certain modalities. Hence, only a small number of subjects with complete data were used in our study. It will be our future research work to extend our method to deal samples with incomplete data for further performance improvement.
In addition, in our current study, the proposed M2TL model mainly focused on sample selection and classification rather than feature selection. Therefore, our proposed M2TL model is not able to directly identify the relevant biomarkers (i.e., features). In the future work, we will also extend our M2TL model to include a feature selection step for multimodal biomarkers selection.
Conclusions
In this paper, we proposed a novel method for jointly exploiting data from the auxiliary domain (i.e., AD and NC) and unlabeled data to enhance performance in distinguishing MCI-C from MCI-NC. By integrating the kernel-based MMD criterion and also a manifold regularization function into the sparse least squares classification model, we formulated a multimodal manifold-regularized transfer learning method (M2TL) for MCI conversion prediction. Also, with the further introduction of group sparsity regularization into the objective function, the proposed method can automatically select informative samples for classification. In the experiments, we compared the proposed method with those related methods in the literature, and presented its efficacy by achieving the maximum classification accuracy of 80.1 % and AUC of 0.852.
Acknowledgments
Data collection and sharing for this project was funded by the Alzheimer's Disease Neuroimaging Initiative (ADNI) (National Institutes of Health Grant U01 AG024904). ADNI is funded by the National Institute on Aging, the National Institute of Biomedical Imaging and Bioengineering, and through generous contributions from the following: Abbott, AstraZeneca AB, Bayer Schering Pharma AG, Bristol-Myers Squibb, Eisai Global Clinical Development, Elan Corporation, Genentech, GE Healthcare, GlaxoSmithKline, Innogenetics, Johnson and Johnson, Eli Lilly and Co., Medpace, Inc., Merck and Co., Inc., Novartis AG, Pfizer Inc, F. Hoffman-La Roche, Schering-Plough, Synarc, Inc., as well as non-profit partners the Alzheimer's Association and Alzheimer's Drug Discovery Foundation, with participation from the U.S. Food and Drug Administration. Private sector contributions to ADNI are facilitated by the Foundation for the National Institutes of Health (www.fnih.org). The grantee organization is the Northern California Institute for Research and Education, and the study is coordinated by the Alzheimer's Disease Cooperative Study at the University of California, San Diego. ADNI data are disseminated by the Laboratory for Neuron Imaging at the University of California, Los Angeles. This work was supported by the National Natural Science Foundation of China (Nos. 61422204, 61473149, 61473190, 1401271, 81471733), the Jiangsu Natural Science Foundation for Distinguished Young Scholar (No. BK20130034), the Specialized Research Fund for the Doctoral Program of Higher Education (No. 20123218110009), the NUAA Fundamental Research Funds (No. NE2013105), and also by the NIH grant (EB006733, EB008374, EB009634, MH100217, AG041721, AG042599).
Footnotes
Data used in preparation of this article were obtained from the Alzheimer's Disease Neuroimaging Initiative (ADNI) database (http://adni.loni.usc.edu/). As such, the investigators within the ADNI contributed to the design and implementation of ADNI and/or provided data but did not participate in analysis or writing of this report. A complete listing of ADNI investigators can be found at: http://adni.loni.usc.edu/wp-content/uploads/how_to_apply/ADNI_Acknowledgement_List.pdf.
Conflict of Interest Matthew Bo Cheng, Mingxia Liu, Heung-Il Suk, Dinggang Shen, and Daoqiang Zhang declare that they have no conflicts of interest.
Informed Consent All procedures followed were in accordance with the ethical standards of the responsible committee on human experimentation (institutional and national) and with the Helsinki Declaration of 1975, and the applicable revisions at the time of the investigation. Informed consent was obtained from all patients for being included in the study.
References
- Belkin M, Niyogi P, Sindhwani V. Manifold regularization: a geometric framework for learning from labeled and unlabeled examples. Journal of Machine Learning Research. 2006;7:2399–2434. [Google Scholar]
- Borgwardt KM, Gretton A, Rasch MJ, Kriegel HP, Scholkopf B, Smola AJ. Integrating structured biological data by kernel maximum mean discrepancy. Bioinformatics. 2006;22:49–57. doi: 10.1093/bioinformatics/btl242. [DOI] [PubMed] [Google Scholar]
- Bouwman FH, Schoonenboom SNM, van der Flier WM, van Elk EJ, Kok A, Barkhof F, Blankenstein MA, Scheltens P. CSF biomarkers and medial temporal lobe atrophy predict dementia in mild cognitive impairment. Neurobiology of Aging. 2007;28:1070–1074. doi: 10.1016/j.neurobiolaging.2006.05.006. [DOI] [PubMed] [Google Scholar]
- Chang CC, Lin CJ. LIBSVM: A library for support vector machines. 2001. [Google Scholar]
- Chao LL, Buckley ST, Kornak J, Schuff N, Madison C, Yaffe K, Miller BL, Kramer JH, Weiner MW. ASL perfusion MRI predicts cognitive decline and conversion from MCI to dementia. Alzheimer Disease and Associated Disorders. 2010;24:19–27. doi: 10.1097/WAD.0b013e3181b4f736. [DOI] [PMC free article] [PubMed] [Google Scholar]
- Chen X, Pan W, Kwok JT, Carbonell JG. Accelerated gradient method for multi-task sparse learning problem. Proceeding of Ninth IEEE International Conference on Data Mining and Knowledge Discovery.2009. pp. 746–751. [Google Scholar]
- Cheng B, Zhang D, Shen D. Domain transfer learning for MCI conversion prediction. Proceeding of International Conference on Medical Image Computing and Computer-Assisted Intervention-MICCAI. 2012;7510:82–90. doi: 10.1007/978-3-642-33415-3_11. [DOI] [PMC free article] [PubMed] [Google Scholar]
- Cheng B, Zhang D, Chen S, Kaufer DI, Shen D. Semi-supervised multimodal relevance vector regression improves cognitive performance estimation from imaging and biological biomarkers. Neuroinformatics. 2013a;11:339–353. doi: 10.1007/s12021-013-9180-7. [DOI] [PMC free article] [PubMed] [Google Scholar]
- Cheng B, Zhang D, Jie B, Shen D. Sparse multimodal manifold-regularized transfer learning for MCI conversion prediction. Lecture Notes in Computer Science. 2013b;8184:251–259. [Google Scholar]
- Chetelat G, Eustache F, Viader F, De la Sayette V, Pelerin A, Mezenge F, Hannequin D, Dupuy B, aron JC, Desgranges B. FDG-PET measurement is more accurate than neuropsychological assessments to predict global cognitive deterioration in patients with mild cognitive impairment. Neurocase. 2005a;11:14–25. doi: 10.1080/13554790490896938. [DOI] [PubMed] [Google Scholar]
- Chetelat G, Landeau B, Eustache F, Mezenge F, Viader F, de la Sayette V, Desgranges B, Baron JC. Using voxel-based morphometry to map the structural changes associated with rapid conversion in MCI: a longitudinal MRI study. NeuroImage. 2005b;27:934–946. doi: 10.1016/j.neuroimage.2005.05.015. [DOI] [PubMed] [Google Scholar]
- Cho Y, Seong JK, Jeong Y, Shin SY, A.D.N.I. Individual subject classification for Alzheimer's disease based on incremental learning using a spatial frequency representation of cortical thickness data. NeuroImage. 2012;59:2217–2230. doi: 10.1016/j.neuroimage.2011.09.085. [DOI] [PMC free article] [PubMed] [Google Scholar]
- CIT Medical Image Processing, Analysis and Visualization (MIPAV) 2012 http://mipav.cit.nih.gov/clickwrap.php.
- Coupé P, Eskildsen SF, Manjón JV, Fonov VS, Pruessner JC, Allard M, Collins DL. Scoring by nonlocal image patch estimator for early detection of Alzheimer's disease. NeuroImage: Clinical. 2012;1:141–152. doi: 10.1016/j.nicl.2012.10.002. [DOI] [PMC free article] [PubMed] [Google Scholar]
- Cuingnet R, Gerardin E, Tessieras J, Auzias G, Lehericy S, Habert MO, Chupin M, Benali H, Colliot O. Automatic classification of patients with Alzheimer's disease from structural MRI: a comparison of ten methods using the ADNI database. NeuroImage. 2011;56:766–781. doi: 10.1016/j.neuroimage.2010.06.013. [DOI] [PubMed] [Google Scholar]
- Da X, Toledo JB, Zee J, Wolk DA, Xie SX, Ou Y, Shacklett A, Parmpi P, Shaw L, Trojanowski JQ, Davatzikos C. Integration and relative value of biomarkers for prediction of MCI to AD progression: spatial patterns of brain atrophy, cognitive scores, APOE genotype and CSF biomarkers. NeuroImage: Clinical. 2014;4:164–173. doi: 10.1016/j.nicl.2013.11.010. [DOI] [PMC free article] [PubMed] [Google Scholar]
- Dai W, Yang Q, Xue G, Yu Y. Boosting for transfer learning. Proceedings of the 24th international conference on Machine learning.2007. pp. 193–200. [Google Scholar]
- Davatzikos C, Bhatt P, Shaw LM, Batmanghelich KN, Trojanowski JQ. Prediction of MCI to AD conversion, via MRI, CSF biomarkers, and pattern classification. Neurobiology of Aging. 2011;32:2322.e2319–2322.e2327. doi: 10.1016/j.neurobiolaging.2010.05.023. [DOI] [PMC free article] [PubMed] [Google Scholar]
- deToledo-Morrell L, Stoub TR, Bulgakova M, Wilson RS, Bennett DA, Leurgans S, Wuu J, Turner DA. MRI-derived entorhinal volume is a good predictor of conversion from MCI to AD. Neurobiology of Aging. 2004;25:1197–1203. doi: 10.1016/j.neurobiolaging.2003.12.007. [DOI] [PubMed] [Google Scholar]
- Drzezga A, Lautenschlager N, Siebner H, Riemenschneider M, Willoch F, Minoshima S, Schwaiger M, Kurz A. Cerebral metabolic changes accompanying conversion of mild cognitive impairment into Alzheimer's disease: a PET follow-up study. European Journal of Nuclear Medicine and Molecular Imaging. 2003;30:1104–1113. doi: 10.1007/s00259-003-1194-1. [DOI] [PubMed] [Google Scholar]
- Duan LX, Tsang IW, Xu D. Domain transfer multiple kernel learning. IEEE Transactions on Pattern Analysis and Machine Intelligence. 2012;34:465–479. doi: 10.1109/TPAMI.2011.114. [DOI] [PubMed] [Google Scholar]
- Duchesne S, Mouiha A. Morphological factor estimation via high-dimensional reduction: prediction of MCI conversion to probable AD. International Journal of Alzheimer's Disease. 2011;2011:914085. doi: 10.4061/2011/914085. [DOI] [PMC free article] [PubMed] [Google Scholar]
- Eskildsen SF, Coupé P, García-Lorenzo D, Fonov V, Pruessner JC, Collins DL. Prediction of Alzheimer's disease in subjects with mild cognitive impairment from the ADNI cohort using patterns of cortical thinning. NeuroImage. 2013;65:511–521. doi: 10.1016/j.neuroimage.2012.09.058. [DOI] [PMC free article] [PubMed] [Google Scholar]
- Fan Y, Gur RE, Gur RC, Wu X, Shen D, Calkins ME, Davatzikos C. Unaffected family members and schizophrenia patients share brain structure patterns: a high-dimensional pattern classification study. Biological psychiatry. 2008;63(1):118–124. doi: 10.1016/j.biopsych.2007.03.015. [DOI] [PMC free article] [PubMed] [Google Scholar]
- Fellgiebel A, Scheurich A, Bartenstein P, Muller MJ. FDG-PET and CSF phospho-tau for prediction of cognitive decline in mild cognitive impairment. Psychiatry Research: Neuroimaging. 2007;155:167–171. doi: 10.1016/j.pscychresns.2006.12.002. [DOI] [PubMed] [Google Scholar]
- Filipovych R, Davatzikos C, A.D.N.I. Semi-supervised pattern classification of medical images: application to mild cognitive impairment (MCI) NeuroImage. 2011a;55:1109–1119. doi: 10.1016/j.neuroimage.2010.12.066. [DOI] [PMC free article] [PubMed] [Google Scholar]
- Filipovych R, Resnick SM, Davatzikos C. Semi-supervised cluster analysis of imaging data. NeuroImage. 2011b;54:2185–2197. doi: 10.1016/j.neuroimage.2010.09.074. [DOI] [PMC free article] [PubMed] [Google Scholar]
- Hinrichs C, Singh V, Xu GF, Johnson SC, A.D.N.I. Predictive markers for AD in a multi-modality framework: an analysis of MCI progression in the ADNI population. NeuroImage. 2011;55:574–589. doi: 10.1016/j.neuroimage.2010.10.081. [DOI] [PMC free article] [PubMed] [Google Scholar]
- Hurd MD, Martorell P, Delavande A, Mullen KJ, Langa KM. Monetary costs of dementia in the United States. The New England Journal of Medicine. 2013;368:1326–1334. doi: 10.1056/NEJMsa1204629. [DOI] [PMC free article] [PubMed] [Google Scholar]
- Jie B, Zhang D, Cheng B, Shen D. Manifold regularized multitask feature learning for multimodality disease classification. Human Brain Mapping. 2015;36(2):489–507. doi: 10.1002/hbm.22642. [DOI] [PMC free article] [PubMed] [Google Scholar]
- Jie B, Zhang D, Wee CY, Shen D. Topological graph kernel on multiple thresholded functional connectivity networks for mild cognitive impairment classification. Human Brain Mapping. 2014;35(7):2876–2897. doi: 10.1002/hbm.22353. [DOI] [PMC free article] [PubMed] [Google Scholar]
- Kabani N, MacDonald D, Holmes CJ, Evans A. A 3D atlas of the human brain. NeuroImage. 1998;7:S717. [Google Scholar]
- Kuzborskij I, Orabona F. Stability and hypothesis transfer learning. Proceedings of the 30th International Conference on Machine Learning.2013. [Google Scholar]
- Lehmann M, Koedam EL, Barnes J, Bartlett JW, Barkhof F, Wattjes MP, Schott JM, Scheltens P, Fox NC. Visual ratings of atrophy in MCI: prediction of conversion and relationship with CSF biomarkers. Neurobiology of Aging. 2012;34:73–82. doi: 10.1016/j.neurobiolaging.2012.03.010. [DOI] [PubMed] [Google Scholar]
- Leung KK, Shen K-K, Barnes J, Ridgway GR, Clarkson MJ, Fripp J, Salvado O, Meriaudeau F, Fox NC, Bourgeat P, Ourselin S. Increasing power to predict mild cognitive impairment conversion to Alzheimer's disease using hippocampal atrophy rate and statistical shape models. Proceeding of International Conference on Medical Image Computing and Computer-Assisted Intervention. 2010;13:125–132. doi: 10.1007/978-3-642-15745-5_16. [DOI] [PubMed] [Google Scholar]
- Li Y, Wang Y, Wu G, Shi F, Zhou L, Lin W, Shen D, A. D. N. I. Discriminant analysis of longitudinal cortical thickness changes in Alzheimer's disease using dynamic and network features. Neurobiology of Aging. 2012;33(2):427.e15–30. doi: 10.1016/j.neurobiolaging.2010.11.008. [DOI] [PMC free article] [PubMed] [Google Scholar]
- Misra C, Fan Y, Davatzikos C. Baseline and longitudinal patterns of brain atrophy in MCI patients, and their use in prediction of short-term conversion to AD: results from ADNI. NeuroImage. 2009;44:1415–1422. doi: 10.1016/j.neuroimage.2008.10.031. [DOI] [PMC free article] [PubMed] [Google Scholar]
- Mosconi L, Perani D, Sorbi S, Herholz K, Nacmias B, Holthoff V, Salmon E, Baron JC, De Cristofaro MT, Padovani A, Borroni B, Franceschi M, Bracco L, Pupi A. MCI conversion to dementia and the APOE genotype: a prediction study with FDG-PET. Neurology. 2004;63:2332–2340. doi: 10.1212/01.wnl.0000147469.18313.3b. [DOI] [PubMed] [Google Scholar]
- Pan SJ, Yang QA. A survey on transfer learning. IEEE Transactions on Knowledge and Data Engineering. 2010;22:1345–1359. [Google Scholar]
- Risacher SL, Saykin AJ, West JD, Shen L, Firpi HA, McDonald BC. Baseline MRI predictors of conversion from MCI to probable AD in the ADNI cohort. Current Alzheimer Research. 2009;6:347–361. doi: 10.2174/156720509788929273. [DOI] [PMC free article] [PubMed] [Google Scholar]
- Shen D, Davatzikos C. HAMMER: hierarchical attribute matching mechanism for elastic registration. IEEE Transactions on Medical Imaging. 2002;21:1421–1439. doi: 10.1109/TMI.2002.803111. [DOI] [PubMed] [Google Scholar]
- Sled JG, Zijdenbos AP, Evans AC. A nonparametric method for automatic correction of intensity nonuniformity in MRI data. IEEE Transactions on Medical Imaging. 1998;17:87–97. doi: 10.1109/42.668698. [DOI] [PubMed] [Google Scholar]
- Supekar K, Menon V, Rubin D, Musen M, Greicius MD. Network analysis of intrinsic functional brain connectivity in Alzheimer's disease. PLoS Computational Biology. 2008;4:e1000100. doi: 10.1371/journal.pcbi.1000100. [DOI] [PMC free article] [PubMed] [Google Scholar]
- Vemuri P, Wiste HJ, Weigand SD, Shaw LM, Trojanowski JQ, Weiner MW, Knopman DS, Petersen RC, Jack CR, A.D.N.I. MRI and CSF biomarkers in normal, MCI, and AD subjects diagnostic discrimination and cognitive correlations. Neurology. 2009a;73:287–293. doi: 10.1212/WNL.0b013e3181af79e5. [DOI] [PMC free article] [PubMed] [Google Scholar]
- Vemuri P, Wiste HJ, Weigand SD, Shaw LM, Trojanowski JQ, Weiner MW, Knopman DS, Petersen RC, Jack CR, Initia ADN. MRI and CSF biomarkers in normal, MCI, and AD subjects predicting future clinical change. Neurology. 2009b;73:294–301. doi: 10.1212/WNL.0b013e3181af79fb. [DOI] [PMC free article] [PubMed] [Google Scholar]
- Wang K, Liang M, Wang L, Tian L, Zhang X, Li K, Jiang T. Altered functional connectivity in early Alzheimer's disease: a resting-state fMRI study. Human Brain Mapping. 2007;28:967–978. doi: 10.1002/hbm.20324. [DOI] [PMC free article] [PubMed] [Google Scholar]
- Wang Y, Nie J, Yap P-T, Shi F, Guo L, Shen D. Robust deformable-surface-based skull-stripping for large-scale studies. In: Fichtinger G, Martel A, Peters T, editors. Medical image computing and computer-assisted intervention. Springer Berlin / Heidelberg; Toronto: 2011a. pp. 635–642. [DOI] [PubMed] [Google Scholar]
- Wang H, Nie F, Huang H, Risacher S, Saykin AJ, Shen L, A.D.N.I. Identifying AD-sensitive and cognition-relevant imaging biomarkers via joint classification and regression. Medical Image Computing and Computer-Assisted Intervention-MICCAI. 2011b;14:115–123. doi: 10.1007/978-3-642-23626-6_15. [DOI] [PMC free article] [PubMed] [Google Scholar]
- Wee CY, Yap PT, Zhang D, Denny K, Browndykec JN, Potterd GG, Welsh-Bohmerc KA, Wang L, Shen D. Identification of MCI individuals using structural and functional connectivity networks. NeuroImage. 2012;59:2045–2056. doi: 10.1016/j.neuroimage.2011.10.015. [DOI] [PMC free article] [PubMed] [Google Scholar]
- Wee CY, Yap PT, Shen DG, ADNI Prediction of Alzheimer's disease and mild cognitive impairment using cortical morphological patterns. Human Brain Mapping. 2013;34:3411–3425. doi: 10.1002/hbm.22156. [DOI] [PMC free article] [PubMed] [Google Scholar]
- Wee CY, Yap PT, Zhang D, Wang L, Shen D. Group-constrained sparse fMRI connectivity modeling for mild cognitive impairment identification. Brain Structure and Function. 2014;219:641–656. doi: 10.1007/s00429-013-0524-8. [DOI] [PMC free article] [PubMed] [Google Scholar]
- Westman E, Muehlboeck JS, Simmons A. Combining MRI and CSF measures for classification of Alzheimer's disease and prediction of mild cognitive impairment conversion. NeuroImage. 2012;62:229–238. doi: 10.1016/j.neuroimage.2012.04.056. [DOI] [PubMed] [Google Scholar]
- Yang J, Yan R, Hauptmann AG. Cross-domain video concept detection using adaptive SVMs. Proceedings of the 15th international conference on Multimedia.2007. pp. 188–197. [Google Scholar]
- Yang L, Hanneke S, Carbonell J. A theory of transfer learning with applications to active learning. Machine Learning. 2013;90:161–189. [Google Scholar]
- Young J, Modat M, Cardoso MJ, Mendelson A, Cash D, Ourselin S. Accurate multimodal probabilistic prediction of conversion to Alzheimer's disease in patients with mild cognitive impairment. NeuroImage: Clinical. 2013;2:735–745. doi: 10.1016/j.nicl.2013.05.004. [DOI] [PMC free article] [PubMed] [Google Scholar]
- Zhang D, Shen D. Semi-supervised multimodal classification of Alzheimer's disease. Proceeding of IEEE International Symposium on Biomedical Imaging.2011. pp. 1628–1631. [Google Scholar]
- Zhang Y, Brady M, Smith S. Segmentation of brain MR images through a hidden Markov random field model and the expectation maximization algorithm. IEEE Transactions on Medical Imaging. 2001;20:45–57. doi: 10.1109/42.906424. [DOI] [PubMed] [Google Scholar]
- Zhang D, Wang Y, Zhou L, Yuan H, Shen D, A.D.N.I. Multimodal classification of Alzheimer's disease and mild cognitive impairment. NeuroImage. 2011;55:856–867. doi: 10.1016/j.neuroimage.2011.01.008. [DOI] [PMC free article] [PubMed] [Google Scholar]
- Zhang D, Shen D, A.D.N.I. Predicting future clinical changes of MCI patients using longitudinal and multimodal biomarkers. PLoS One. 2012a;3:e33182. doi: 10.1371/journal.pone.0033182. [DOI] [PMC free article] [PubMed] [Google Scholar]
- Zhang D, Shen D, A.D.N.I. Multi-modal multi-task learning for joint prediction of multiple regression and classification variables in Alzheimer's disease. NeuroImage. 2012b;59:895–907. doi: 10.1016/j.neuroimage.2011.09.069. [DOI] [PMC free article] [PubMed] [Google Scholar]
- Zhu D, Li K, Terry DP, Puente AN, Wang L, Shen D, Miller LS, Liu T. Connectome-scale assessments of structural and functional connectivity in MCI. Human Brain Mapping. 2014;35:2911–2923. doi: 10.1002/hbm.22373. [DOI] [PMC free article] [PubMed] [Google Scholar]