

Abstract
Repetitive exposure to a chemical agent can induce an immune reaction in inherently susceptible individuals that leads to skin sensitization. Although many chemicals have been reported as skin sensitizers, there have been very few rigorously validated QSAR models with defined applicability domains (AD) that were developed using a large group of chemically diverse compounds. In this study, we have aimed to compile, curate, and integrate the largest publicly available dataset related to chemically-induced skin sensitization, use this data to generate rigorously validated and QSAR models for skin sensitization, and employ these models as a virtual screening tool for identifying putative sensitizers among environmental chemicals. We followed best practices for model building and validation implemented with our predictive QSAR workflow using random forest modeling technique in combination with SiRMS and Dragon descriptors. The Correct Classification Rate (CCR) for QSAR models discriminating sensitizers from non-sensitizers were 71–88% when evaluated on several external validation sets, within a broad AD, with positive (for sensitizers) and negative (for non-sensitizers) predicted rates of 85% and 79% respectively. When compared to the skin sensitization module included in the OECD QSAR toolbox as well as to the skin sensitization model in publicly available VEGA software, our models showed a significantly higher prediction accuracy for the same sets of external compounds as evaluated by Positive Predicted Rate, Negative Predicted Rate, and CCR. These models were applied to identify putative chemical hazards in the ScoreCard database of possible skin or sense organ toxicants as primary candidates for experimental validation.
Keywords: Skin sensitization, QSAR, virtual screening, skin toxicants
INTRODUCTION
Humans are exposed to a variety of natural and synthetic substances that have never been tested in any toxicity assay. Information regarding the risks posed to human health and the environment for all these chemicals is limited and often inadequate, even among high production volume chemicals (Chuprina et al., 2010; Egeghy et al., 2012; Muir and Howard, 2006). Many chemical hazards cause their adverse effects through skin contact; the associated phenomena include skin sensitization, skin penetration, and skin irritation (Dickel et al., 2002; Grandjean et al., 1988; Kimber et al., 2011). Each of these phenomena has been studied largely independently even though there may be functional links between them (Lepoittevin, 2011; Magnusson et al., 2004; Strid and Strobel, 2005).
The sequence of biological responses starting from the molecular initiating events and leading to in vivo adverse outcome(s) is represented by an adverse outcome pathway (AOP) (Ankley et al., 2010; Knudsen and Kleinstreuer, 2011; OECD, 2012; Watanabe et al., 2011). Protein haptenation, the molecular initiating event for skin sensitization, results in a delayed-type hypersensitivity called allergic contact dermatitis (ACD) (Aeby et al., 2010; Hennino et al., 2005). ACD is a common occupational and environmental health issue (Keegel et al., 2009; Kimber et al., 2002), and its AOP consists of two phases, i.e., skin sensitization and elicitation of the immune response. The first phase, skin sensitization, is initiated by the contact and penetration of the chemical through the skin (Karlberg et al., 2008). During their passage through the skin layers, chemicals can be subjected to different bio-transformations that may change their allergenic potential (OECD, 2012). Several haptens (i.e., small molecules that can elicit an immune response only when attached to a large carrier such as a protein) are known to bear lipophilic moieties and have low molecular weight (usually < 500 Dalton), allowing them to easily cross the stratum corneum barrier (Bos and Meinardi, 2000). They can also possess electrophilic moieties that can covalently bind the nucleophilic residues of cutaneous proteins to form stable conjugates, characterizing the molecular initiating event, which seems to be the major structure-dependent determinant of skin sensitization potential (Roberts and Aptula, 2008). These conjugates, also called hapten-protein complexes, are processed by dendritic (Langerhan) cells that subsequently mature and migrate to lymph nodes (OECD, 2012; Saint-Mezard et al., 2004). Those processed complexes are presented to naive T-cells resulting in the proliferation of hapten-specific T-cells that emigrate from the lymph nodes and enter the blood through the thoracic duct (Hennino et al., 2005). The second phase, elicitation, occurs after a subsequent contact with the same hapten. Haptens diffuse into the skin and form the hapten-protein complexes, which are taken up by skin cells. The circulating hapten-specific T-cells are activated by the keratinocytes, fibroblasts, and dendritic cells in the dermis and the epidermis, ultimately triggering the inflammatory process responsible for lesions (Hennino et al., 2005; OECD, 2012; Saint-Mezard et al., 2004).
Common in vivo tests for skin sensitization include the occluded patch test (Buehler, 1965), the guinea pig maximization test (Magnusson and Kligman, 1969), and the murine local lymph node assay (LLNA) (Basketter et al., 2002); the latter is regarded as the preferred test for evaluating skin sensitization (OECD, 2010). A modification of the LLNA, the reduced LLNA (rLLNA), which decreases the number of animals used for testing by 40%, was recently validated (ICCVAM, 2009). Despite some successful reductions in animal usage, these tests are still costly and have low throughput. In 2013, the European Union banned in vivo testing of cosmetic and toiletry ingredients , which leads for an urgent development of alternative methods to evaluate safety and efficacy of new chemicals (Adler et al., 2011). So far, there is no in vitro method for evaluating skin sensitization (Johansson and Lindstedt, 2014).
Meanwhile, in silico computational methods are emerging as a practical solution for the evaluation of substances lacking experimental data (Raunio, 2011). However, modeling chemical toxicity is very challenging due to the high complexity of the underlying biological mechanisms and experimental variability (Gleeson et al., 2012). Although many previous skin sensitization models described in the literature (Table S1) appear to be well-fitted and robust, critical analysis of these studies reveals important problems. In our observation, most of the published QSAR models do not comply with the statistical procedures, statistical criteria, and recommendations for external validation that constitute common best practices (Golbraikh and Tropsha, 2002; Tropsha, 2010) and thus these models are not compliant with the OECD guidance on QSAR model development and validation (OECD, 2004). More specifically, the main drawbacks of the majority of published models are: (i) models’ predictivity was not properly assessed and/or tested on external compounds; (ii) models did not have applicability domain (AD) estimations; (iii) no proof of passing the Y-randomization test (almost all the models from Table S1) was presented; and (iv) the use of unbalanced datasets has resulted in the generation of models biased towards the most populated class of compounds. As a consequence, despite the large number of previous QSAR studies, only one model (Nandy et al., 2014) can actually be employed to reliably predict skin sensitization potential of new chemicals. However it is not publicly available and only 67 compounds were used in the modeling set.
The major drawbacks of previous QSAR studies of skin sensitization compromise the practical use of prior methods and models for reliably assessing chemical-induced skin sensitization. For instance, the dataset studied by (Cronin and Basketter, 1994) contained many activity cliffs (Maggiora, 2006), i.e., structurally similar compounds with the same scaffolds (phenols and acetates in this case) that had drastically different properties; this explains why phenols and acetates were predicted so poorly.
The feasibility of building models for fragrance allergens using classification and ranking approaches was investigated in several studies (Hostýnek and Magee, 1997; Magee et al., 1994). In these papers, the authors also tried to relate the permeability of fragrances with their skin sensitization potency. In another study (Devillers, 2000), the author attempted to compare the prediction power of artificial neural networks and linear discriminant analysis but selected a test set that contained only 7% of the overall number of compounds, which is not large enough for proper validation. The TOPS-MODE (Topological Substructural Molecular Descriptors) approach used by (Estrada et al., 2003) demonstrated relatively good predictive performance but the reported accuracy is likely to be overly optimistic because of the very small size of the two external validation sets (15 and 6 compounds, respectively). Similarly, a model developed in another study (Miller et al., 2005) appeared to be highly accurate; however, a detailed analysis revealed that 20 compounds were designated as outliers and removed from the modeling set because of their poor fit between experimental and predicted values, most likely resulting in an artificially overestimated predictive performance of the model.
One study described an external validation procedure that was carried out on Tissue Metabolism Simulator for Skin Sensitization (TIMES-SS) (Roberts et al., 2007b). The authors experimentally tested 40 chemicals in the LLNA assay and then compared the results with computationally-derived predictions made by TIMES-SS. Despite the high specificity (ca. 87.5%), the sensitivity of the model was poor (ca. 56%). Another study (Golla et al., 2009) presented a QSAR model developed using a dataset compiled by the Federal Institute for Health Protection of Consumers and Veterinary Medicine (Schlede et al., 2003). The dataset was collected from clinical and experimental data on humans as well as animal tests. The authors divided the investigat compounds into three groups: (i) significant contact allergen; (ii) solid-based indication for conta allergenic effect; and (iii) insignificant contact allergen. This classification system was unclear an ambiguous, making the modeling efforts described by the authors (Golla et al., 2009) less practic for future use and more difficult to compare with those from other studies.
Given the frequency of dermal exposure to diverse chemicals and the lack of reliable silico models to predict skin sensitization potential for new chemicals, the main objectives of th study were to: (i) compile, curate, and integrate skin sensitization data from various literatu sources; (ii) develop and rigorously validate predictive and robust QSAR models for sk sensitization; (iii) compare these models with the Skin Sensitization modules in OECD QSA Toolbox and VEGA as a benchmarking; and (iv) apply developed models to the Scoreca chemical library for identifying potential skin or sense organ toxicants. In a companion study (Pa II), we have developed similar QSAR models of skin permeability and elucidated the relationsh between skin permeability and skin sensitization (Alves et al., 2014).
MATERIALS AND METHODS
The workflow developed in this work is illustrated in Figure 1.
Figure 1.

General workflow developed in this work.
Datasets
Skin sensitization dataset (dataset A)
The dataset used in this study was retrieved from the ICCVAM (Interagency Coordinating Committee on the Validation of Alternative Methods) report on the rLLNA (ICCVAM, 2009). The binary skin sensitization potential (sensitizer vs. non-sensitizer) based on the LLNA data obtained by ICCVAM from the literature was reported for 471 records (every record refers to a chemical compound but because of the presence of duplicates, several records could describe the same compound). Before merging these data from different studies made by independent laboratories in one single dataset, we have checked the literature and found that the inter-laboratory variance of LLNA test was low, in agreement with an earlier analysis (ICCVAM and NICEATM, 1999; Scholes et al., 1992). Data discrepancy could have been introduced also by different vehicles used in LLNA assay to achieve optimal solubility and skin penetration of examined compounds (see Table S2). We have found in the literature (Anderson et al., 2011) that although there was some variation in EC3 values caused by different vehicles, the influence of a vehicle was too low to change the hazard classification (sensitizer vs. non-sensitizer) of a given chemical. Thus, we decided to integrate the data obtained with different vehicles in the same dataset. We analyzed the binary skin sensitization potential for duplicate records from our dataset to confirm its low variability. Since the sources of potential divergence were unclear, we did not separate the data by laboratory and vehicle. This analysis showed good concordance between all data: only three compounds had different annotations. Searching for additional reports for these three compounds, we found evidence that ethyl acrylate (Dearman et al., 2007) and hexyl cinnamic aldehyde (Dearman et al., 2001) were in fact sensitizers. Thus, only linalool alcohol was excluded from the dataset. Overall, 387 unique compounds (260 sensitizers and 127 non-sensitizers) were considered for further modeling process. To avoid QSAR models with biased predictivity, the dataset was balanced prior to modeling to equalize the number of sensitizers and non-sensitizers. Specifically, we used the smaller group of non-sensitizers as probes to search for the most structurally similar sensitizers and thereby chose the first half of the sensitizer group (64 compounds). The remaining half (63 compounds) were chosen from the rest of the initial sensitizer class randomly to maximize the chemical space coverage. This similarity-based selection procedure was carried out by the MDA (Methods of Data Analysis) module of the HiT QSAR software (Kuz’min et al., 2008) in two stages: (i) generate the matrix of Euclidean distances in the chemical space between all the pairs of compounds; and then (ii) choose 64 sensitizers with the smallest Euclidean distance to the nearest non-sensitizer. Such procedures allowed us to create the most challenging training set with structurally similar sensitizers and non-sensitizers, in order to achieve the most rigorous model capable of separating these two classes from each other, as well as to include a fraction of more diverse sensitizers for providing larger model coverage of the chemical space. The final dataset (dataset A) consisted of 254 compounds (127 sensitizers and 127 non-sensitizers). The remaining 133 sensitizers were placed to the external validation set (dataset B).
External validation set (dataset B)
Recently, a Bayesian Network Integrated Testing Strategy was developed to estimate skin sensitization potency by combining in silico and in vitro data related to skin penetration, peptide reactivity, and dendritic cell activation (Jaworska et al., 2011). The authors compiled LLNA data from published literature (Gerberick et al., 2005; Kern et al., 2010) and previously unpublished data from several laboratories. We retrieved 152 unique chemical compounds (dataset B) from this source (Jaworska et al., 2011). Then we examined the overlap between this collection (Jaworska et al., 2011) and our skin sensitization dataset A (see previous section). We identified 129 compounds that were present in both datasets A and B and had only two divergent skin sensitization annotations (i.e., sodium lauryl sulfate and tartaric acid), demonstrating the strong consistency for this retrieved data. The remaining 23 compounds from dataset B that were absent in our modeling set (dataset A) were thus chosen for additional external validation along with 133 sensitizers from ICCVAM report (ICCVAM, 2009).
Scorecard dataset (dataset C)
Scorecard is a website sponsored by GoodGuide, Inc., which is devoted to pollution-related problems and toxic chemicals (Scorecard, 2011). The Scorecard team compiled data from several sources, e.g., EPA (http://www.epa.gov/) and HAZMAP (http://hazmap.nlm.nih.gov), and flagged 867 compounds suspected for being skin or sense organ toxicants. These chemicals are suspected of causing any of the following effects: olfactory impairment, hearing loss, eye irritation, vision impairment, contact or allergic dermatitis, photosensitization, and chloracne. After removing duplicates, inorganic salts, and organometallic compounds, 571 unique chemical compounds (dataset C) were remaining. The last time this section was updated with references from 2004 (http://scorecard.goodguide.com/health-effects/references.tcl?short_hazard_name=skin), but since all of this compounds do not have sensitization data, we decided to screen this dataset.
Data curation
Chemical structures were retrieved either from PubChem or ChemSpider databases using Chemical Abstracts Service (CAS) registry numbers and chemical names. Chemicals were removed if their structures could not be found. Each dataset was carefully curated (Fourches et al., 2010). Briefly, counterions were removed, whereas specific chemotypes such as aromatic and nitro groups were normalized using the ChemAxon Standardizer (v.5.3, ChemAxon, Budapest, Hungary, http://www.chemaxon.com). Inorganic salts, organometallic compounds, polymers, and mixtures were also removed. The presence of duplicates, i.e., identical compounds reported several times in the same dataset, is known to lead to over-optimistic estimations of the predictivity for developed QSAR models. However, the analysis of such records also gives an estimate of the dataset quality: if activity data for the same compound are consistent, the overall data quality is high; if there is a large deviation in experimental values between different records of the same compound, the quality is low. Thus, after structural standardization, the duplicates were identified using ISIDA Duplicates (Varnek et al., 2008) and HiT QSAR (Kuz’min et al., 2008) software and carefully analyzed. If the experimental properties associated with two duplicated structures were identical, then one compound was deleted. However, if their experimental properties were significantly different, we deleted both records from the dataset.
Cheminformatics approaches
Hierarchical Cluster Analysis
The clustering of a chemical dataset consists of merging compounds into distinct clusters of chemically similar molecules [see publications (Downs and Barnard, 2003; Mercier, 2003) for the review of the most popular clustering approaches used in computational chemistry]. In this study, we have employed the Sequential Agglomerative Hierarchical Non-overlapping (SAHN) method implemented in the ISIDA/Cluster program (http://infochim.u-strasbg.fr) (Varnek et al., 2007). Briefly, each compound represents one cluster at the start. Then, the m compounds are merged iteratively into clusters using their pairwise Euclidean distances stored in a squared (m * m) symmetric distance matrix. The two closest objects (molecules or clusters) are iteratively identified and merged to form a new cluster, the distance matrix being updated with the re-computed distances separating the newly formed cluster and the others, according to the user-specified type of linkage (complete linkage in this study). The process is repeated until one cluster remains. The parent-child relationships between clusters result in a hierarchical data representation, or dendrogram. In particular, we used ISIDA/Cluster to obtain the heat map (see Results section) of the proximity matrix.
Dragon Descriptors
The following types of descriptors were generated using Dragon software (v.5.5, Talete SRL, Milan, Italy): 0D constitutional (atom and group counts), 1D functional groups, 1D atom-centered fragments, 2D topological descriptors, 2D walk and path counts, 2D autocorrelations, 2D connectivity indices, 2D information indices, 2D topological charge indices, 2D eigenvalue-based indices, 2D topological descriptors, 2D edge-adjacency indices, 2D Burden eigenvalues, 2D binary fingerprints, 2D frequency fingerprints, and molecular properties. The detailed discussion for these descriptors can be found elsewhere (Todeschini and Consonni, 2000).
SiRMS Descriptors
2D Simplex Representation of Molecular Structure (SiRMS) descriptors (Muratov et al., 2010) (number of tetratomic fragments with fixed composition and topological structure) were generated by the HiT QSAR software (Kuz’min et al., 2008). At the 2D level, the connectivity of atoms in a simplex, atom type, and bond nature (single, double, triple, or aromatic) have been considered. SiRMS descriptors account not only for the atom type, but also for other atomic characteristics that may impact biological activity of molecules, e.g., partial charge, lipophilicity, refraction, and atom ability for being a donor/acceptor in hydrogen-bond formation (H-bond). For atom characteristics with continuous values (charge, lipophilicity, and refraction) the division of the entire value range into definite discrete groups has been carried out. The atoms have been divided into four groups corresponding to their (i) partial charge A≤-0.05<B≤0<C≤0.05<D, (ii) lipophilicity A≤-0.5<B≤0<C≤0.5<D, and (iii) refraction A≤1.5<B≤3<C≤8<D. For H-bond characteristic, the atoms have been divided into three groups: A (acceptor of hydrogen in H-bond), D (donor of hydrogen in H-bond), and I (indifferent atom). The usage of sundry variants of differentiation of simplex vertexes (atoms) represents the principal feature of the SiRMS approach (Kuz’min et al., 2007). Detailed description of HiT QSAR and SiRMS can be found elsewhere (Kuz’min et al., 2008; Muratov et al., 2010).
QSAR modeling
The QSAR modeling workflow used in this study includes three major steps (Tropsha and Golbraikh, 2007; Tropsha, 2010): (i) data curation/preparation/analysis (selection of compounds and descriptors), (ii) model building, and (iii) model validation/selection. Here we followed a 5-fold external cross-validation procedure: the full set of compounds with known experimental activity is randomly divided into five subsets of equal size; then one of these subsets (20% of all compounds) is set aside as external validation set and the remaining four sets together form the modeling set (80% of the full set). This procedure is repeated five times allowing each of the five subsets to be used as external validation set. Models are built using the modeling set only, and it is important to emphasize that the external set compounds are never employed either to build and/or select the models. Each modeling set is divided into many internal training and test sets; then models are built using compounds of each training set and applied to test set compounds to assess their properties. The statistical metrics used in this work are described in Supplementary Materials.
Best models are identified and selected according to acceptable threshold values of Correct Classification Rate (CCR, computed as the average of sensitivity and specificity of the model) for the internal test sets (called out-of-bag set in Random Forest, vide infra). Then, selected models are applied to the external set compounds to predict their experimental properties. This procedure is repeated five times to ensure that every compound is present once in the corresponding external test set. Since the accuracy of each model is estimated for compounds in the external test sets only, which were never used to derive, bias, or select models, this protocol ensures an objective estimation of the true external predictivity of the models. In addition, 1,000 rounds of Y-randomization were performed for each dataset to assure that the high accuracy of the models built with real data was not due to chance correlations.
Random Forest
Random Forest models were constructed according to the original RF algorithm (Breiman, 2001) using the CF software version 2.12 (Polishchuk et al., 2009). RF is an ensemble of single decision trees. Outputs of all trees are aggregated to obtain one final prediction. Each tree is grown as follows: (i) a bootstrap sample is produced from the whole set of N compounds to form a training set for the current tree. Compounds that are not in the training set of the current tree are placed in the out-of-bag (OOB) set (size of ~ N/3); (ii) the best split by CART algorithm (Breiman et al., 1984) among the m randomly selected descriptors from the entire pool in each node is chosen; (iii) each tree is then grown to the largest possible extent; there is no pruning. The predicted classification values are defined by majority voting for one of the classes. Thus, each tree predicts values for only those compounds that are not included in the training set of that tree (for OOB set only). Since RF possesses its own reliable statistical characteristics (based on OOB set prediction) which could be used for validation and model selection, no cross-validation was performed (Breiman, 2001). Thus, the final model is chosen by the lowest error for prediction of the OOB set. The local (tree) applicability domain approach (Artemenko et al., 2011) was used for all RF models developed in this study.
OECD QSAR Toolbox
The Organization for Economic Co-operation and Development (OECD) (http://www.oecd.org/) has funded a software development project called QSAR Toolbox to facilitate practical application of QSAR approaches in regulatory contexts by governments and industry and to improve their regulatory acceptance. The QSAR Toolbox was designed to incorporate a variety of information on chemicals from multiple sources and to group these chemicals based on their molecular structures, features, and relevant biological/toxicological effects. Skin sensitization is one of the endpoints included in the OECD Toolbox. Although the Toolbox is mainly intended to be used by government agencies, industry, etc., for assessing the potential hazards of chemicals, it is possible to retrieve the skin sensitization to retrieve categorical predictions (sensitizer or non-sensitizer) for new compounds for new compounds using the implemented AOP as described in the tutorial (OECD, 2014). Thus, we compared the performance of our models with the Skin Sensitization module of the QSAR Toolbox.
The software was downloaded from the OECD website (http://www.qsartoolbox.org/download.html) and it was implemented according to the instructions taken from user’s manual (OECD, 2014). Briefly, the structure of the target compound is derived from its SMILES string and the compound is profiled for protein binding (protein binding by OECD, protein binding potency, and protein binding alerts for skin sensitization by OASIS v1.2). Auto-oxidation products and skin metabolites are generated if no protein binding alert for the target compound. In vivo skin sensitization data are searched using the “Skin Sensitization” and “Skin sensitization ECETOC” databases. If the compound has LLNA data, then the outcome is annotated and the procedure discontinued for this compound. If there are no data, the category definition module is used to search for analogs. The data for EC3 (LLNA assay) is filled by read-across.
Since our models predict (r)LLNA results, they were compared with the outcome of the LLNA node of QSAR Toolbox. To make a fair comparison between our models and the Toolbox, we excluded 234 compounds that were present in both skin sensitization datasets A and B and QSAR Toolbox database (with LLNA data). Then, we applied the Toolbox to the 171 unique compounds from dataset A and B and compared the Toolbox predictions with those made by our QSAR models when these compounds were in corresponding external validation sets.
VEGA
VEGA is standalone software based on JAVA technology that implements several in silico models for toxicological endpoints. According to the skin sensitization model guideline of VEGA, the software implements a binary model based on eight descriptors and using adaptive fuzzy partition. More information about the models can be found elsewhere (Chaudhry et al., 2010; VEGA, 2014). VEGA Non-Iterative Client (VEGANIC) v1.0.8 was downloaded from http://www.vega-qsar.eu/. The SDF file with all the 387 structures from dataset A was imported to VEGANIC, skin sensitization model selected, and the structures predicted. The predictions from the report were compared with the prediction of our models. Structures present on VEGANIC database were excluded from comparison.
RESULTS
Cluster analysis
The heat-map representing the distance matrix and summarizing the cluster analysis of skin sensitization datasets A and B is shown in Figure 2. We identified two large clusters (annotated as d and e in Figure 2) of similar compounds in the lower right corner of the heat-map. All other identified clusters are much smaller (typically including 3–10 compounds). The analysis of skin sensitization potential for the chemicals within small clusters of highly similar structures revealed the consistency of the activity annotations (see the Discussion part) and allowed us to find 30 suspicious compounds, i.e., those that had different activity annotations from the rest of the cluster members.
Figure 2.

Cluster analysis of compounds included in the skin sensitization datasets A and B: dendrogram and heat map of the distance matrix colored according to structural similarity (blue/violet = similar; yellow/red = dissimilar).
We began by confirming the activity annotations for the suspicious compounds in the ICCVAM reports, and subsequently searched for additional published evidence that could confirm or refute their activity. The data for our skin sensitization models (datasets A and B) were collected from the ICCVAM report on the rLLNA (ICCVAM, 2009) and from the study of Jaworska et al. (2011), which compiled LLNA and rLLNA test results from different sources. Our literature search revealed that there is a lack of data on the potential risk of compounds that cause skin sensitization, and the references found during our literature search (Gerberick et al., 2005; Kern et al., 2010) were largely cited in the ICCVAM report. We found additional skin sensitization data for only eight out of the 30 suspicious compounds (bromohexane and bromononane (Basketter et al., 1992; Siegel et al., 2009), chlorobenzene (ECHA, 2010a), 3,4-dihydrocoumarin (Gerberick et al., 2004), ethylenediamine (ECHA, 2010b), 2-methoxy-4-methylphenol (Gerberick et al., 2009), octanoic acid (Johansson et al., 2011), and oxalic acid (ECHA, 2010c). All annotations for these compounds were confirmed in the literature, except for the oxalic acid, which was annotated as a sensitizer in the Dataset A but appeared to be non-sensitizer; the corresponding label was corrected in our database. Concluding this section, we shall note that the majority of these suspicious compounds represent interesting cases of activity cliffs, i.e., compounds that are highly structurally similar to their close structural analogs, but possess very different activity (Maggiora, 2006).
QSAR modeling
The statistical characteristics of the developed QSAR models are summarized in Table 1. Plot of ROC curves are available in Supplementary Materials (Figure S1). Two types of RF models (with SiRMS or Dragon descriptors) were developed with high CCR = 0.71–0.76. The use of AD resulted in the increase of CCR (by 9–12%) but the decrease of coverage (by 42–48%). Because two types of models were built, a consensus prediction was generated by averaging the predicted value for each compound from individual models, which therefore could be equal to 0, 0.5, or 1. All predictions equal to 0.5 were considered inconclusive and were discarded. In total, we have developed three consensus models with various AD considerations (Table 1): (i) Model 5 was an average of predictions made by models 1 and 3 (Dragon and SiRMS, within AD of either model); (ii) Model 6 was an average of predictions made by models 2 and 4 (Dragon and SiRMS, both without AD); (iii) Model 7 was an average of predictions made by models 1 and 3 (Dragon and SiRMS, within AD of both models). The statistics summary given in Table 1 shows that the use of the AD increases the CCR for both SiRMS (from 0.71 to 0.83) and Dragon (from 0.76 to 0.85) models, as well as for consensus model 5 (from 0.79 to 0.82), but also results in a decreased coverage (from 0.82 to 0.79), i.e., reduced number of compounds in the external dataset considered to be covered by the model. The consensus model 5 presented CCR slightly lower with models 1 and 3 (from 0.83/0.85 to 0.82), but the coverage increased much, revealing the benefit of consensus modeling (from 0.58/0.52 to 0.70). The model with the highest prediction power (model 7, CCR = 0.88) had the most conservative AD estimation but only 39% coverage.
Table 1.
Statistical characteristics of QSAR models for skin sensitization assessed by 5-fold external validation
| Sensitivity | PPV | Specificity | NPV | CCR | AUC | Coverage | |
|---|---|---|---|---|---|---|---|
| Model 1 - SiRMS | 0.83 | 0.85 | 0.83 | 0.81 | 0.83 | 0.83 | 0.58 |
| Model 2 - SiRMS no AD* | 0.69 | 0.72 | 0.73 | 0.70 | 0.71 | 0.71 | 1.00 |
| Model 3 - Dragon | 0.84 | 0.88 | 0.87 | 0.80 | 0.85 | 0.84 | 0.52 |
| Model 4 - Dragon no AD* | 0.70 | 0.79 | 0.81 | 0.73 | 0.76 | 0.76 | 1.00 |
| Model 5 - Consensus | 0.79 | 0.85 | 0.85 | 0.79 | 0.82 | 0.82 | 0.70 |
| Model 6 - Consensus no AD* | 0.74 | 0.82 | 0.83 | 0.75 | 0.79 | 0.79 | 0.82 |
| Model 7 - Consensus Rigor | 0.91 | 0.90 | 0.85 | 0.88 | 0.88 | 0.88 | 0.39 |
Applicability domain has not been considered for this model.
Models developed for dataset A were applied to predict annotations for compounds included in dataset B (the external validation dataset), and the metrics of their prediction accuracy are summarized in Table 2. Consensus model 5 was able to correctly identify sensitizers with sensitivity of 0.65 (coverage of 50%), while the sensitivity of the consensus rigor (model 7) was the highest (0.86) albeit for the smallest fraction of compounds in Dataset B within the AD for model 7 (limited coverage of 24%). We included formal values for specificity and CCR in Table 2 but in all fairness, because Dataset B included a very small number of non-sensitizers those values should not be viewed as significant. However, one should appreciate the relatively high sensitivity values given the challenge (by design) to predict accurately sensitizers selected from the original ICCVAM datasets for their similarity to non-sensitizers.
Table 2.
Metrics of prediction accuracy of QSAR models for skin sensitization when applied to the external validation set (152 sensitizers and 5 non-sensitizers).
| Sensitivity | True Positives |
Specificity | True Negatives |
CCR | Coverage | |
|---|---|---|---|---|---|---|
| Model 1- SiRMS | 0.66 | 43 | 1.00 | 1 | 0.83 | 0.42 |
| Model 2 – SiRMS no AD* | 0.51 | 78 | 1.00 | 5 | 0.76 | 1.00 |
| Model 3 - Dragon | 0.69 | 36 | 0.50 | 1 | 0.60 | 0.34 |
| Model 4 - Dragon no AD* | 0.47 | 72 | 0.60 | 3 | 0.54 | 1.00 |
| Model 5 - Consensus | 0.65 | 51 | 1.00 | 1 | 0.83 | 0.50 |
| Model 6 - Consensus no AD* | 0.49 | 59 | 1.00 | 3 | 0.75 | 0.78 |
| Model 7 - Consensus Rigor | 0.73 | 27 | 1.00 | 1 | 0.86 | 0.24 |
Applicability domain has not been considered in this model.
We also analyzed the relative importance of the descriptors incorporated in the selected models. For SiRMS descriptors the electrostatic factors were the most important (50%); they were followed by atom individuality (28%) and hydrophobicity (16%). Number of donors of hydrogen bonds and dispersion forces contribute 2% each. For the Dragon set, augmented atom codes (ACC) and topological polar surface area using N,O polar contributions (TPSA_NO) had 9% and 7% of contribution. Average connectivity index chi-5 (X5A) had a contribution of 5% and Broto-Moreau autocorrelation of a topological structure - lag 4 (ATS4m) and average valance connectivity index chi-5 (X5Av) had a contribution of 3%. All the other descriptors contributed 2% or less.
Comparison of QSAR vs.OECD QSAR Toolbox sensitization predictions
To accomplish a fair comparison between our models and the OECD QSAR Toolbox, we searched for the overlap between datasets A and B and the skin sensitization database used to develop the OECD skin sensitization module. We found 234 compounds present in both databases and excluded them from the comparison. It is important to note that 221 out of the 234 compounds had identical skin sensitization annotations in both databases, resulting in high concordance of 94.4%. Thus, we screened a set of 171 unique compounds from dataset A and B that were absent in the QSAR Toolbox database for the relevant prediction of EC3 and compared the results with the predictions from our QSAR models when these compounds were in external test sets (allowing a fair comparison between the two approaches). In total, 81 compounds were not predicted by QSAR Toolbox (10 compounds), by model 5 (61 compounds) or by both approaches (10 compounds), and thus were excluded from consideration to ensure that both approaches were compared using the same external compounds. The prediction of QSAR Toolbox was not made when there were no sufficient data of analogs to make the prediction or the “unreliable” message was received because the log Kow for the target chemical was outside the range of analogs. Compounds not processed by model 5 were those out of the AD. In total, 90 compounds including 38 sensitizers and 52 non-sensitizers were used for comparing the performance of the two models.
The results show (Table 4) that QSAR Toolbox slightly outperformed our model 5 in sensitivity (53% vs. 50%, respectively), which was very low for both models, but the Toolbox failed to predict non-sensitizers correctly, which is indicated by a large number of false positives as estimated by the low Positive Predictive Value (PPV; cf. Table 4). The complete list of predictions is available in the Supplemental Materials. Our model 5 predicted all but four non-sensitizers correctly affording a classification specificity of 98% (compared to 38% obtained by the Toolbox). Overall the CCR of our approach was higher than that of the OECD software (74% vs. 46%).
Table 4.
Comparison the performance of QSAR models with that of skin sensitization module of the OECD QSAR Toolbox.
| Sensitivity | PPV | Specificity | NPV | CCR | |
|---|---|---|---|---|---|
| Model 5 - Consensus | 0.50 | 0.94 | 0.98 | 0.75 | 0.74 |
| QSAR Toolbox | 0.53 | 0.38 | 0.38 | 0.53 | 0.46 |
Comparison of QSAR vs.VEGA sensitization predictions
The comparison of the developed QSAR models with VEGA was performed following the same approach as in the previous section. We found 158 (~96% concordance of skin sensitization annotations) compounds present in both databases and excluded them from the comparison. We also excluded compounds with low reliability (analogue of AD estimation) from VEGA. In total 186 compounds were not predicted by VEGA (85 compounds), by model 5 (38 compounds) or by both approaches (63 compounds), and were excluded to ensure that both approaches were compared using the same external compounds. The statistical characteristics for predicting the remaining 61 compounds (45 sensitizers and 16 non-sensitizers) are shown in Table 5. The complete list of predictions is available in the Supplemental Materials. The results shown in Table 5 suggest that VEGA outperformed our models in terms of sensitivity (93% vs. 84%), but model 5 had significantly higher specificity (75% vs 25%) and better Positive and Negative Predictive Values (90% vs 78% and 78–57% respectively) than Vega.
Table 5.
Comparison of the performance of QSAR models with that of skin sensitization module of VEGA.
| Sensitivity | PPV | Specificity | NPV | CCR | |
|---|---|---|---|---|---|
| Model 5 - Consensus | 0.84 | 0.90 | 0.75 | 0.63 | 0.80 |
| VEGA | 0.93 | 0.78 | 0.25 | 0.57 | 0.59 |
NB. Applicability domain was not considered for model 5
DISCUSSION
Cluster analysis
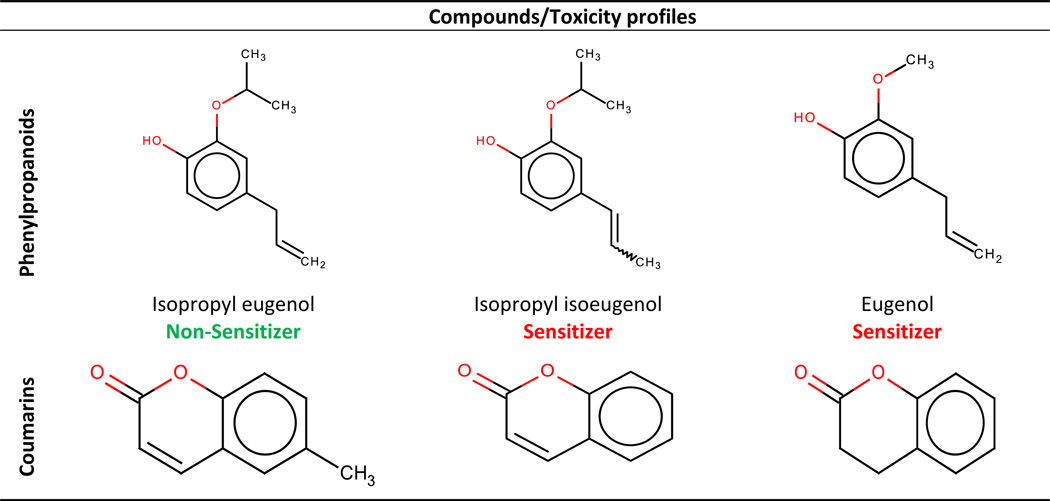
In this section we present the detailed analysis of clusters of structurally similar chemicals. Cluster a in Figure 2 contains 26 compounds, mostly phenylpropanoids. The latter were annotated as sensitizers except for isopropyl eugenol. The only difference between this compound and its closest structural neighbor, isopropyl isoeugenol, is the position of the double bond in the propyl moiety attached to the benzene ring. The second nearest neighbor, eugenol, has an oxymethyl group instead of the oxyisopropyl substituent in position 1 of the benzene ring (see Table 6). Thus, isopropyl eugenol is the perfect example of an activity cliff and, as expected, this compound was mispredicted by our models. Several cases where slight changes in chemical moieties make considerable changes in the activity/toxicity of compounds are well-known. For example, non-toxic caffeine and hepatotoxic theophylline differ by a methyl group only (Low et al., 2011).
Table 6.
Examples of "suspicious" compounds in dataset A identified by cluster analysis.
 |
 |
Another cluster was formed by dicarboxylic acids (see cluster c in Figure 2). All of them were non-sensitizers, except for oxalic acid (also mispredicted by our models). Additional information regarding oxalic acid revealed that this compound is, in fact, a non-sensitizer (ECHA, 2010c), which explains why it was mispredicted by our models.
All of bromoalkanes (clusters d and e on Figure 2) were annotated as sensitizers except bromononane. We suspected that bromononane could be mis-annotated, so we searched for published evidence that would support this hypothesis. An early study evaluated the sensitization potential of bromoalkanes and showed that bromobutane and bromohexane were non-sensitizers, and that from bromononane to bromohexadecane the sensitization potencial is increased with the length of the carbon chain, and for molecules with a longer alkyl chain the potential starts to decrease (Basketter et al., 1992). A more recent study evaluating physicochemical properties and solubility of bromoalkanes found that the case of bromoalkanes is particularly complicated because, in addition to lipid solubility, multiple factors including vehicle, solvation, and retention on the skin surface, contribute to the apparent potency of 1-bromoalkanes in the LLNA (Siegel et al., 2009). The same authors also found that logP has no direct influence on bromoalkanes and that results of LLNA for this class of compounds can be affected by the compound volatility. In other words, lack of potency or any observable stimulation in the LLNA by several of the semivolatile bromoalkanes (C6-C11) is most likely due to a loss from volatility (from the skin surface and back out of the stratum corneum) competing with absorption/distribution into the epidermis and bromoalkane haptenation. In another study (Li et al., 2005), the authors also faced the problem with skin sensitization potential of bromoalkanes, e.g., bromononane was mispredicted in all their models because of some uncertainties with its actual activity. We concur with observation reported by (Li et al., 2005; Siegel et al., 2009) that bromoalkanes represent an interesting and difficult case and we can confidently hypothesize that the aforementioned divergence between bromohexane and bromononane may be an artifact of evaluating these compounds using LLNA. Within the iodoalkanes, both iodohexane (6C) and iodooctadecane (18C) were non-sensitizers, whereas iodononane (9C), iododecane (10C), iodotetradecane (14C), and iodohexadecane (16C) were annotated as sensitizers. At first glance, it seems that the very long chain of iodooctadecane can explain the decrease of the permeability through the skin (or the binding affinity to skin proteins). If this theory were correct, bromodocosane (22 carbons) would be a non-sensitizer since the length of the chain is bigger than for iodooctadecane (18 carbons) and bromine has similar electronic features with iodine. However, bromodocosane is annotated as a sensitizer in our database. Even though they have not shown sensitization responses at the highest test concentrations (Roberts et al., 2007a), iodohexane and iodooctadecane may be sensitizers that were not detected due to their loss because of volatility. Lacking experimental evidence of sensitization, we preferred to keep them as non-sensitizers. The inconsistency within the same chemical cluster led us to conclude that modeling of haloalkanes is challenging due to the presence of activity cliffs and/or experimental difficulties. As a consequence, some of these compounds are likely to be mispredicted by our models.
Although 3,4-dihydrocoumarin was annotated as a sensitizer, two similar compounds – coumarin and 6-methylcoumarin – were marked as non-sensitizers (see Table 6 and cluster a in Figure 2). The only difference between the 3,4-dihydrocoumarin and coumarin is the absence of the double bond between carbon atoms 3 and 4. It has been suggested that 3,4-dihydrocoumarin is a prohapten, i.e., it requires a biotransformation to initiate its ability to react with nucleophilic amino acids such as cysteine in skin proteins and consequently cause skin sensitization (Gerberick et al., 2004). We also found additional evidences (Roberts et al., 2007a) that the difference in the sensitization potency of 3,4-dihydrocoumarin vs. coumarin and 6-methylcoumarin could be explained by the reactivity of these compounds: the 3,4-dihydrocoumarin heterocyclic ring is partially rigid and it reacts more readily as an acylating agent. Thus, 3,4-dihydrocoumarin represents a classical example of an activity cliff and it is not surprising that this compound is mispredicted by our models.
When we analyzed the variable importance, we noted that electrostatic SiRMS descriptors were very important (50% contribution). We believe the significance of this type of descriptors is related with protein binding, since compounds need to bind to residues of nucleophilic amino acids such as cysteine and lysine to cause skin sensitization (Lepoittevin, 2011). TPSA also had high importance, which is consistent with the cell permeability for skin sensitization. A more profound analysis relating skin sensitization and permeability is made on the second part of this work (Alves et al., 2014).
Comparison with the OECD QSAR Toolbox
The OECD QSAR Toolbox v3.2 incorporates an AOP protocol for assessing skin sensitization. This protocol provides the user with the experimental data or allows prediction for the following endpoints: protein binding alerts; in chemico peptide depletion assay DPRA (Cys); in chemico peptide depletion assay DPRA (Lys); in chemico glutathione depletion assay GSH (RC50); in chemico Adduct formation assay LC-MS; in vitro keratinocyte ARE (EC1.5, EC2, EC3), in vitro dendritic cell activity assay h-CLAT; in vitro dendritic cell activity assay MUSST; in vivo organ response (LLNA); and in vivo organ response (GPMT). Each node of this AOP provides the user with the experimental data or offers a possibility for predicting its property. Although this information could be useful for the user, the software does not provide a final verdict (sensitizer or non-sensitizer), leaving the decision to the user. Because our models predict (r)LLNA results, we compared our models only with the LLNA node of QSAR Toolbox. This node provides a category prediction (positive or negative) by read-across (OECD, 2014).
The benchmarking results of our skin sensitization models in comparison with the OECD QSAR Toolbox showed the significantly higher specificity and CCR of our models but their slightly lower sensitivity (Table 4). However, these metrics do not completely describe the model performance for predicting the target property for new compounds, which is the ultimate goal of every QSAR model. Thus, we have calculated both positive and negative predicted values (PPV from Equation 5 and NPV from Equation 6, see Supplemental Materials) to estimate the probability of accurate annotation of a new compound as a sensitizer or non-sensitizer. As obvious from Table 4, if a compound is predicted as a sensitizer by our model 5, there is high probability (PPV=95%) that this compound is actually a sensitizer; similarly, there is 73% chance that a compound would be a non-sensitizer if it was predicted as non-sensitizer. Meanwhile, OECD QSAR Toolbox is generating predictions with the probability that a compound predicted as a sensitizer is indeed a sensitizer is less than random (PPV=38%). Besides, the probability of a compound predicted as non-sensitizer to be actual non-sensitizer is not really better (Specificity = 38%; NPV=53%). Undoubtedly, read-across is inexpensive, easy, structurally transparent, and easily interpretable. However, our results show that when using the LLNA node of the QSAR Toolbox for evaluating chemical hazards, one can end up with a very high error rate ultimately leading to the withdrawal of many potentially useful and harmless compounds from the development because of false sensitization alerts or, conversely, selecting unsafe compounds for further development. Although additional information may be obtained when following the AOP described in the tutorial (OECD, 2014) for a target compound, our results shows that it may be premature to rely solely on the read-across prediction at this time. The reason for the relatively low performance of read across is likely due to more complex relationships between the entire chemical structure and the skin sensitization potential than can be captured by identifying selected chemical functional groups as alerts. At the same time, statistical QSAR models built with molecular descriptors seem to capture structural determinants of skin sensitization intrinsically although in general it is harder to interpret these models in simple structural terms. In our opinion, it would be prudent to develop hybrid approaches integrating read across and statistical QSAR modeling to improve both predictivity and interpretability of models. A recently develop Chemical Biological Read Across (CBRA) method (Low et al., 2013) is a step in this direction.
Analysis of sensitizers mispredicted by our models
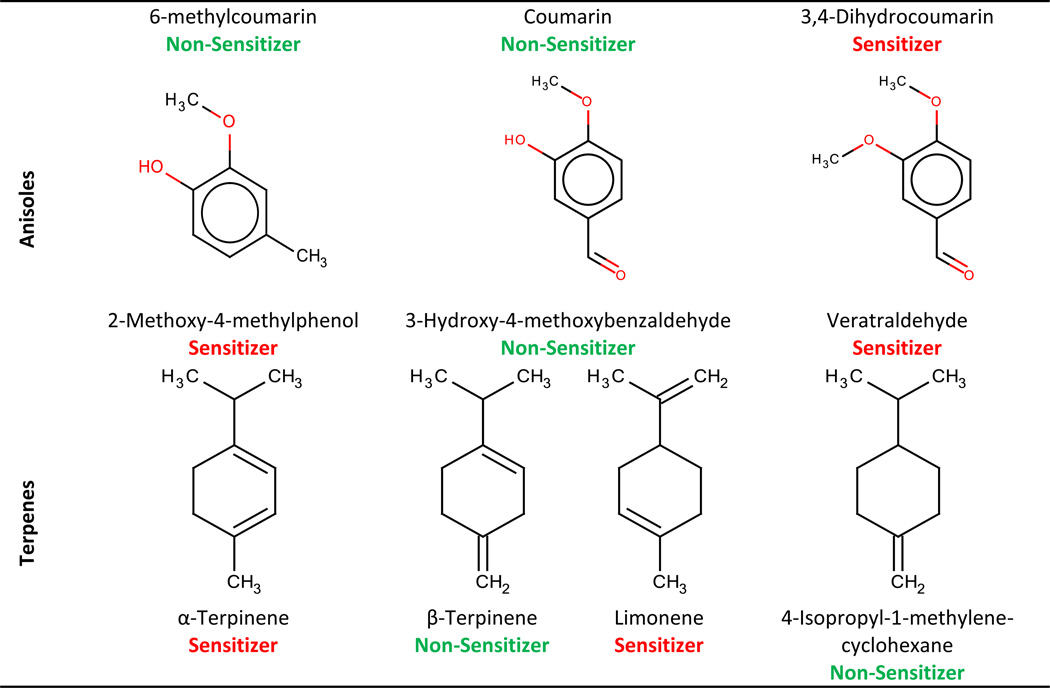
Because our model 5 suffered from low sensitivity, we wanted to investigate the possible reasons of why we encountered a high number of false negatives. We found that as much as one third of sensitizers mispredicted by model 5 (14 out of 43) could be considered as 2D activity cliffs. These compounds are: (i) seven weak sensitizers (4-bromo-1-phthalimidopentane, 2-benzyl-tert-butylamino-3’-hydroxymethyl-4’-hydroxyaceto-phenone, 1,1-dimethylethyl3-[[[[(3s)-2,3,4,5-tetrahydro-1-[2-[(1-methylethyl)phenylamino]-2-oxoethyl]-2,4-dioxo-5-phenyl-1H-1,5-benzodiazepin-3-yl]amino] carbonyl]amino]benzoate, 5-methoxy-6-trifluoromethyl-2,3-dihydro-1H–indole, oxalic acid, bromohexane, and 3,4-dichloroaniline hydrochloride); (ii) two moderate sensitizers (2,6-dimethoxy-4-methyl-8-nitro-5-[3-(trifluoromethyl)-phenoxy]quinolone, and veratraldehyde); (iii) one strong sensitizer (benzylbromide); and (iv) four other compounds (1-(prop-2-enoyloxy)-2-[(prop-2-enoyloxy)methyl]pentan-3-yl-prop-2-enoate, azithromycin, 5-chloro-2,6-dimethoxy-4-methyl-8-nitroquinoline, and 1,5-dimethyl-3-(1-oxo-2-propenyl)-4-phenyl-2-imidazolidinone), for which the level of skin sensitization is not available. The Tanimoto coefficient (Tc) for these compounds compared to their closest nearest neighbors in the modeling set was usually greater than 0.9 and no less than 0.75 (see Table S3 for more details). Most of these 14 compounds, e.g., bromohexane and benzylbromide were already discussed in the cluster analysis section as being very difficult to predict by QSAR models because of the activity cliffs phenomenon. For instance, the difference between the sensitizer veratraldehyde and its nearest neighbors annotated as non-sensitizers, vanillin and 3-hydroxy-4-methoxybenzaldehyde is just due to a substitution of one chemical group (oxymethyl instead of hydroxy group). The compound 2-benzyl-tert-butylamino-3’-hydroxymethyl-4’-hydroxyaceto-phenone was marked as a sensitizer, whereas its closest neighbor 2-(benzyl)tert-butyl)amino)-1-(alpha,4-dihydroxy-m-tolyl)ethane (Tc=0.92) is a non-sensitizer. After checking both structures, we believe the difference in the activity is determined by the protonation of the latter compound. Another interesting example of an activity cliff is 5-chloro-2,6-dimethoxy-4-methyl-8-nitroquinoline. The only difference between this compound and its closest analog, i.e., non-sensitizer 5-chloro-2,6-dimethoxy-4-methylquinoline, is a nitro group, which is directly responsible for the appearance of the sensitization potency in this case. Many of the aforementioned “activity cliffs” may seem obvious and could be correctly assessed by most organic chemists familiar with mechanism-based SARs. However, statistically-based QSAR models developed using hundreds of compounds are treating such compounds as activity cliffs leading to erroneous predictions. This could be one of the reasons why many sensitizers are poorly predicted by our models (and most likely by read across methods).
In addition to activity cliffs we found five cases, i.e., β-phellandrene (moderate sensitizer), sodium lauryl lactylate (weak sensitizer), 2,2-bis-[4-(2-hydroxy-3methacryloxypropoxy)phenyl)]-propane (weak sensitizer), 2-hydroxyethyl acrylate (moderate sensitizer), and 3-ethoxy-1-(2’,3’,4’,5’-tetramethylphenyl)propane-1,3-dione (weak sensitizer) (see Table S3), that were erroneously predicted by our models as non-sensitizers. Although these compounds do belong to structural clusters containing both sensitizers and non-sensitizers, they have rather similar (Tc=0.75–0.96) neighbors that are sensitizers. β-phellandrene belonging to the cluster of terpenes is a good example of an erroneously predicted sensitizer. Sensitization potential of these compounds depends on the mutual positions of substituents in the terpene ring. In this case, limonene - the most structurally similar neighbor (Tc=0.96) of β-phellandrene is actually a sensitizer, but the second nearest neighbor (Tc=0.94), 4-isopropyl-1-methylene-cyclohexane, is annotated as being non-sensitizer. This high similarity with a sensitizer and a non-sensitizer reinforces the difficulty of accurately predicting terpenes. Previous studies have shown that terpenes are not allergenic themselves, but they oxidize when in contact with air to produce allergenic compounds (Matura et al., 2005). Thus, the oxidation impurities that have been formed at some stage in their synthesis or storage are responsible for the skin sensitization of terpenes. In this case the potency of skin sensitization depends on how much oxidation impurities terpenes contain.
Seven other mispredicted sensitizers, Bandrowski’s base, 3,3’,4’,5-tetrachloro-salicylanilide, dinocap, 7-[(4z)-3-(aminomethyl)-4-(methoxyimino)-1pyrrolidinyl]-1-cyclopropyl-6-fluoro-1,4-dihydro-4-oxo-1,8-naphthyridine-3-carboxylic acid, monomethane-sulfonate, ethylenediamine, 8-chloro-3-pentyl-3,7-dihydro-1h–purine-2,6-dione, and dimethyl sulfoxide (see Table S3), were very dissimilar to the modeling set (Tc<0.5). Although such a high global structural dissimilarity could be one of the main reasons for the incorrect prediction of these compounds by our models, these compounds still fell within the applicability domain of our models.
We have noticed also several instances of classification “border effects”, i.e., when the experimental skin sensitization potency of a given compound is very close to the potency cutoff used to discriminate sensitizers from non-sensitizers: for instance, aniline with an EC3 of 89%, which is very close to the 100% EC3 cutoff. Border effects could explain why these compounds were mispredicted. Only seven out of 41 mispredicted compounds were annotated as strong or extreme sensitizers, 29 other compounds were annotated as weak (18) and moderate (11) sensitizers. The five remaining compounds have no data regarding their skin sensitization potency. Overall, 12 out of 13 compounds were mispredicted because of border effects.
Virtual screening of the Scorecard dataset (dataset C)
The initial analysis of the Scorecard dataset revealed 55 chemicals already present in our modeling set: 42 compounds were annotated as sensitizers and 13 as non-sensitizers. Thus, we have applied our QSAR models to the remaining 516 Scorecard compounds. Using model 5, 82 compounds were predicted as sensitizers and 166 compounds as non-sensitizers (the remaining compounds were outside of the AD). Model 7 resulted in 27 sensitizers and 29 non-sensitizers with full agreement between SiRMS and Dragon models. As expected, the use of highly conservative AD decreased the overall coverage to 11% but the reliability of the prediction is expected to be high. All compounds and corresponding predictions are listed in Supplemental Materials (Sensitization_Data_Models_Results.xlsx). The selection of a small number of compounds from the Scorecard database illustrates the utility of QSAR models for prioritizing environmental chemicals of concern for targeted biological testing.
CONCLUSIONS
We have compiled, curated, and integrated the largest publicly available datasets of skin sensitization for diverse chemicals. Cluster analysis revealed high consistency of reported experimental data as well as helped identifying 30 “suspicious” compounds with potentially erroneous data. Indeed, we found additional literature evidence to correct mis-annotated skin sensitization potential for two compounds.
We have obtained robust and predictive QSAR models of skin sensitization. Our skin sensitization models showed significantly higher specificity and CCR compared to the OECD QSAR Toolbox but lower sensitivity and coverage. However, the analysis of positive and negative prediction values showed that our models almost guaranteed (PPV = 85%) that if a compound was classified as a sensitizer, then the compound was actually a sensitizer. Thus, our models could be regarded as reliable tools for identifying putative sensitizers in the first step of multi-tiered testing strategy. Meanwhile, there is 79% chance that a compound would be non-sensitizer if predicted as non-sensitizer. The relatively high external predictive power of our models suggests that they can be considered for regulatory decision support although corresponding authorities may require more certainty to confirm negative results by following the QSAR with additional in vitro or animal tests. In comparison, the probability of a compound to be correctly predicted as sensitizer or non-sensitizer by the OECD QSAR Toolbox is not better than random (PPV=0.38, NPV=0.53). The extensive mechanistic understanding of skin sensitization and its’ AOP has enabled the development of various non-animal test methods associated with one or more of the AOP key events, and the complexity of the underlying biology has produced the hypothesis that no single measurement will be sufficient to predict sensitizer potency. Therefore, it is becoming accepted that only a combination of several methods in an integrated strategy will allow skin sensitization assessment without the need for animal testing, and QSAR models such as those presented here will be a critical part of such strategies.
In summary, we have built statistically significant and externally predictive QSAR models of skin sensitization that can be used by the research community and regulatory scientists to flag potentially unsafe compounds in chemical inventories. For instance, virtual screening of the Scorecard dataset with the most conservative but also most reliable model built in this study identified 27 potential skin sensitizers that may be candidates for targeted testing. All curated datasets, models, and results developed in this study have been made publicly available at the Chembench Web Portal (http://chembench.mml.unc.edu).
Supplementary Material
ACKNOWLEDGEMENTS
This study was supported in part by NIH (grants GM66940 and GM096967), EPA (grant RD 83499901), and FAPEG (grant 201310267001095). A.T. acknowledges partial support from Russian Scientific Foundation. V.A. thanks CNPq and Science without Borders program for the financial support of his visit to the University of North Carolina at Chapel Hill. E.M. acknowledges partial support from STCU (Grant P407). E.M, V.A., and C.H.A acknowledge partial support from CNPq (PVE, Grant 400760/2014-2).N.K. and J.S. are supported by the NIEHS contract N01-ES 35504 and the Intramural Research Program of the NIEHS. This article may be the work product of an employee or group of employees of the NIEHS, NIH, or other organizations; however, the statements, opinions, or conclusions contained therein do not necessarily represent the statements, opinions, or conclusions of NIEHS, NIH, the United States government, or other organizations. The use of commercial product names is for comparative purposes only and does not constitute endorsement by any of the authors, organizations, or agencies.
ABBREVIATIONS
- AD
Applicability domain
- AOP
Adverse outcome pathway
- CCR
Correct classification rate
- ICCVAM
Interagency Coordinating Committee on the Validation of Alternative Methods
- NPV
Negative predictive value
- OECD
Organization for Economic Co-operation and Development
- PPV
Positive predictive value
- QSAR
Quantitative structure-activity relationship
- RF
Random Forest
- (r)LLNA
(Reduced) local lymph node assay
Footnotes
CONFLICT OF INTERESTS
The authors declare no actual or potential conflict of interests
SUPPLEMENTAL MATERIAL
Supplemental materials including methodology details, curated chemical datasets, and tables are available online
REFERENCES
- Adler S, Basketter D, Creton S, Pelkonen O, van Benthem J, Zuang V, Andersen KE, Angers-Loustau A, Aptula A, Bal-Price A, Benfenati E, Bernauer U, Bessems J, Bois FY, Boobis A, Brandon E, Bremer S, Broschard T, Casati S, Coecke S, Corvi R, Cronin M, Daston G, Dekant W, Felter S, Grignard E, Gundert-Remy U, Heinonen T, Kimber I, Kleinjans J, Komulainen H, Kreiling R, Kreysa J, Leite SB, Loizou G, Maxwell G, Mazzatorta P, Munn S, Pfuhler S, Phrakonkham P, Piersma A, Poth A, Prieto P, Repetto G, Rogiers V, Schoeters G, Schwarz M, Serafimova R, Tähti H, Testai E, van Delft J, van Loveren H, Vinken M, Worth A, Zaldivar J-M. Alternative (non-animal) methods for cosmetics testing: current status and future prospects-2010. Arch. Toxicol. 2011;85:367–485. doi: 10.1007/s00204-011-0693-2. [DOI] [PubMed] [Google Scholar]
- Aeby P, Ashikaga T, Bessou-Touya S, Schepky A, Gerberick F, Kern P, Marrec-Fairley M, Maxwell G, Ovigne J-M, Sakaguchi H, Reisinger K, Tailhardat M, Martinozzi-Teissier S, Winkler P. Identifying and characterizing chemical skin sensitizers without animal testing: Colipa’s research and method development program. Toxicol. In Vitro. 2010;24:1465–1473. doi: 10.1016/j.tiv.2010.07.005. [DOI] [PubMed] [Google Scholar]
- Alves VM, Muratov EN, Fourches D, Strickland J, Kleinstreuer N, Andrade CH, Tropsha A. Predicting chemically-induced skin reactions. Part II: QSAR models of skin permeability and the relationship between skin permeability and skin sensitization. Toxicol. Appl. Pharmacol. Submitted. 2014 doi: 10.1016/j.taap.2014.12.013. [DOI] [PMC free article] [PubMed] [Google Scholar]
- Anderson SE, Siegel PD, Meade BJ. The LLNA: A Brief Review of Recent Advances and Limitations. J. Allergy. 2011:1–10. doi: 10.1155/2011/424203. [DOI] [PMC free article] [PubMed] [Google Scholar]
- Ankley GT, Bennett RS, Erickson RJ, Hoff DJ, Hornung MW, Johnson RD, Mount DR, Nichols JW, Russom CL, Schmieder PK, Serrrano JA, Tietge JE, Villeneuve DL. Adverse outcome pathways: a conceptual framework to support ecotoxicology research and risk assessment. Environ. Toxicol. Chem. 2010;29:730–741. doi: 10.1002/etc.34. [DOI] [PubMed] [Google Scholar]
- Artemenko AG, Muratov EN, Kuz’min VE, Muratov NN, Varlamova EV, Kuz’mina AV, Gorb LG, Golius A, Hill FC, Leszczynski J, Tropsha A. QSAR analysis of the toxicity of nitroaromatics in Tetrahymena pyriformis: structural factors and possible modes of action. SAR QSAR Environ. Res. 2011;22:575–601. doi: 10.1080/1062936X.2011.569950. [DOI] [PMC free article] [PubMed] [Google Scholar]
- Basketter DA, Evans P, Fielder RJ, Gerberick GF, Dearman RJ, Kimber I. Local lymph node assay - validation, conduct and use in practice. Food Chem. Toxicol. 2002;40:593–598. doi: 10.1016/s0278-6915(01)00130-2. [DOI] [PubMed] [Google Scholar]
- Basketter DA, Roberts DW, Cronin M, Scholes EW. The value of the local lymph node assay in quantitative structure-activity investigations. Contact Dermatitis. 1992;27:137–142. doi: 10.1111/j.1600-0536.1992.tb05241.x. [DOI] [PubMed] [Google Scholar]
- Bos JD, Meinardi MM. The 500 Dalton rule for the skin penetration of chemical compounds and drugs. Exp. Dermatol. 2000;9:165–169. doi: 10.1034/j.1600-0625.2000.009003165.x. [DOI] [PubMed] [Google Scholar]
- Breiman L, Friedman JH, Olshen RA, Stone CJ. Classification and Regression Trees. Belmont: Wadsworth Publishing; 1984. [Google Scholar]
- Breiman LEO. Random Forests. Mach. Learn. 2001;45:5–32. [Google Scholar]
- Buehler EV. Delayed contact hypersensitivity in the guinea pig. Arch. Dermatol. 1965;91:171–177. doi: 10.1001/archderm.1965.01600080079017. [DOI] [PubMed] [Google Scholar]
- Chaudhry Q, Piclin N, Cotterill J, Pintore M, Price NR, Chrétien JR, Roncaglioni A. Global QSAR models of skin sensitisers for regulatory purposes. Chem. Cent. J. 2010;4(Suppl 1):5. doi: 10.1186/1752-153X-4-S1-S5. [DOI] [PMC free article] [PubMed] [Google Scholar]
- Chuprina A, Lukin O, Demoiseaux R, Buzko A, Shivanyuk A. Drug- and lead-likeness, target class, and molecular diversity analysis of 7.9 million commercially available organic compounds provided by 29 suppliers. J. Chem. Inf. Model. 2010;50:470–479. doi: 10.1021/ci900464s. [DOI] [PubMed] [Google Scholar]
- Cronin MT, Basketter DA. Multivariate QSAR analysis of a skin sensitization database. SAR QSAR Environ. Res. 1994;2:159–179. doi: 10.1080/10629369408029901. [DOI] [PubMed] [Google Scholar]
- Dearman RJ, Betts CJ, Farr C, McLaughlin J, Berdasco N, Wiench K, Kimber I. Comparative analysis of skin sensitization potency of acrylates (methyl acrylate, ethyl acrylate, butyl acrylate, and ethylhexyl acrylate) using the local lymph node assay. Contact Dermatitis. 2007;57:242–247. doi: 10.1111/j.1600-0536.2007.01215.x. [DOI] [PubMed] [Google Scholar]
- Dearman RJ, Wright ZM, Basketter DA, Ryan CA, Gerberick GF, Kimber I. The suitability of hexyl cinnamic aldehyde as a calibrant for the murine local lymph node assay. Contact Dermatitis. 2001;44:357–361. doi: 10.1034/j.1600-0536.2001.044006357.x. [DOI] [PubMed] [Google Scholar]
- Devillers J. A neural network SAR model for allergic contact dermatitis. Toxicol. methods. 2000;10:181–193. [Google Scholar]
- Dickel H, Kuss O, Schmidt A, Kretz J, Diepgen TL. Importance of irritant contact dermatitis in occupational skin disease. Am. J. Clin. Dermatol. 2002;3:283–289. doi: 10.2165/00128071-200203040-00006. [DOI] [PubMed] [Google Scholar]
- Downs GM, Barnard JM. Clustering Methods and Their Uses in Computational Chemistry. In: Lipkowitz KB, Boyd DB, editors. Reviews in Computational Chemistry. Hoboken: John Wiley & Sons, Inc; 2003. pp. 1–40. [Google Scholar]
- ECHA. [accessed 5.6.14];Chlorobenzene [WWW Document] 2010a URL http://apps.echa.europa.eu/registered/data/dossiers/DISS-a13af347-47f5-6bef-e044-00144f67d031/AGGR-33e332cc-47ee-4f5c-9167-c351ad8fce8a_DISS-a13af347-47f5-6bef-e044-00144f67d031.html#AGGR-33e332cc-47ee-4f5c-9167-c351ad8fce8a.
- ECHA. [accessed 5.6.14];Ethylenediamine [WWW Document] 2010b URL http://apps.echa.europa.eu/registered/data/dossiers/DISS-9d8437e1-c001-3dc0-e044-00144f67d249/AGGR-adaf1758-e3ff-4e82-ada1-2a36d2b058c8_DISS-9d8437e1-c001-3dc0-e044-00144f67d249.html#AGGR-adaf1758-e3ff-4e82-ada1-2a36d2b058c8.
- ECHA. [accessed 5.6.14];Oxalic acid [WWW Document] 2010c URL http://apps.echa.europa.eu/registered/data/dossiers/DISS-9d952f55-7514-4c7f–e044-00144f67d249/AGGR-9a0763a4-ef26-4d96-a55a–d9ce751e77af_DISS-9d952f55-7514-4c7f–e044-00144f67d249.html#AGGR-9a0763a4-ef26-4d96-a55a–d9ce751e77af.
- Egeghy PP, Judson R, Gangwal S, Mosher S, Smith D, Vail J, Hubal EAC. The exposure data landscape for manufactured chemicals. Sci. Total Environ. 2012;414:159–166. doi: 10.1016/j.scitotenv.2011.10.046. [DOI] [PubMed] [Google Scholar]
- Estrada E, Patlewicz G, Chamberlain M, Basketter D, Larbey S. Computer-aided knowledge generation for understanding skin sensitization mechanisms: the TOPS-MODE approach. Chem. Res. Toxicol. 2003;16:1226–1235. doi: 10.1021/tx034093k. [DOI] [PubMed] [Google Scholar]
- Fourches D, Muratov E, Tropsha A. Trust, but verify: on the importance of chemical structure curation in cheminformatics and QSAR modeling research. J. Chem. Inf. Model. 2010;50:1189–1204. doi: 10.1021/ci100176x. [DOI] [PMC free article] [PubMed] [Google Scholar]
- Gerberick GF, Ryan CA, Kern PS, Schlatter H. Compilation of historical local lymph node data for evaluation of skin sensitization alternative methods. Dermatitis. 2005;16:157–202. [PubMed] [Google Scholar]
- Gerberick GF, Troutman Ja, Foertsch LM, Vassallo JD, Quijano M, Dobson RLM, Goebel C, Lepoittevin J-P. Investigation of peptide reactivity of pro-hapten skin sensitizers using a peroxidase-peroxide oxidation system. Toxicol. Sci. 2009;112:164–174. doi: 10.1093/toxsci/kfp192. [DOI] [PubMed] [Google Scholar]
- Gerberick GF, Vassallo JD, Bailey RE, Chaney JG, Morrall SW, Lepoittevin J-P. Development of a peptide reactivity assay for screening contact allergens. Toxicol. Sci. 2004;81:332–343. doi: 10.1093/toxsci/kfh213. [DOI] [PubMed] [Google Scholar]
- Gleeson MP, Modi S, Bender A, Robinson RLM, Kirchmair J, Promkatkaew M, Hannongbua S, Glen RC. The challenges involved in modeling toxicity data in silico: a review. Curr. Pharm. Des. 2012;18:1266–1291. doi: 10.2174/138161212799436359. [DOI] [PubMed] [Google Scholar]
- Golbraikh A, Tropsha A. Beware of q2! J. Mol. Graph. Model. 2002;20:269–276. doi: 10.1016/s1093-3263(01)00123-1. [DOI] [PubMed] [Google Scholar]
- Golla S, Madihally S, Robinson RL, Gasem KAM. Quantitative structure-property relationship modeling of skin sensitization: a quantitative prediction. Toxicol. In Vitro. 2009;23:454–465. doi: 10.1016/j.tiv.2008.12.025. [DOI] [PubMed] [Google Scholar]
- Grandjean P, Berlin A, Gilbert M, Penning W. Preventing percutaneous absorption of industrial chemicals: the “skin” denotation. Am. J. Ind. Med. 1988;14:97–107. doi: 10.1002/ajim.4700140111. [DOI] [PubMed] [Google Scholar]
- Hennino A, Vocanson M, Chavagnac C, Saint-Mezard P, Dubois B, Kaiserlian D, Nicolas J. Update on the pathophysiology with special emphasis on CD8 effector T cells and CD4 regulatory T cells. An. Bras. Dermatol. 2005;80:335–347. [Google Scholar]
- Hostýnek JJ, Magee PS. Fragrance allergens: Classification and ranking by QSAR. Toxicol. In Vitro. 1997;11:377–384. doi: 10.1016/s0887-2333(97)00031-3. [DOI] [PubMed] [Google Scholar]
- ICCVAM. [accessed 2.20.12];The reduced murine local lymph node assay: an alternative test method using fewer animals to assess the allergic contact dermatitis potential of chemicals and products [WWW Document] 2009 URL http://ntp.niehs.nih.gov/iccvam/docs/immunotox_docs/LLNA-LD/TMER.pdf.
- ICCVAM, NICEATM. [accessed 6.8.12];The murine local lymph node assay: a test method for assessing the allergic contact dermatitis potential of chemicals/compounds [WWW Document] 1999 URL http://iccvam.niehs.nih.gov/docs/immunotox_docs/llna/llnarep.pdf.
- Jaworska J, Harol A, Kern PS, Gerberick GF. Integrating non-animal test information into an adaptive testing strategy - skin sensitization proof of concept case. ALTEX. 2011;28:211–225. doi: 10.14573/altex.2011.3.211. [DOI] [PubMed] [Google Scholar]
- Johansson H, Lindstedt M. Prediction of Skin Sensitizers using Alternative Methods to Animal Experimentation. Basic Clin. Pharmacol. Toxicol. 2014 doi: 10.1111/bcpt.12199. [DOI] [PubMed] [Google Scholar]
- Johansson H, Lindstedt M, Albrekt A-S, Borrebaeck CAK. A genomic biomarker signature can predict skin sensitizers using a cell-based in vitro alternative to animal tests. BMC Genomics. 2011;12:399. doi: 10.1186/1471-2164-12-399. [DOI] [PMC free article] [PubMed] [Google Scholar]
- Karlberg A-T, Bergström MA, Börje A, Luthman K, Nilsson JLG. Allergic contact dermatitis - formation, structural requirements, and reactivity of skin sensitizers. Chem. Res. Toxicol. 2008;21:53–69. doi: 10.1021/tx7002239. [DOI] [PubMed] [Google Scholar]
- Keegel T, Moyle M, Dharmage S, Frowen K, Nixon R. The epidemiology of occupational contact dermatitis (1990–2007): a systematic review. Int. J. Dermatol. 2009;48:571–578. doi: 10.1111/j.1365-4632.2009.04004.x. [DOI] [PubMed] [Google Scholar]
- Kern PS, Gerberick GF, Ryan CA, Kimber I, Aptula A, Basketter DA. Local lymph node data for the evaluation of skin sensitization alternatives: a second compilation. Dermatitis. 2010;21:8–32. [PubMed] [Google Scholar]
- Kimber I, Basketter DA, Gerberick GF, Dearman RJ. Allergic contact dermatitis. Int. Immunopharmacol. 2002;2:201–211. doi: 10.1016/s1567-5769(01)00173-4. [DOI] [PubMed] [Google Scholar]
- Kimber I, Basketter DA, Gerberick GF, Ryan CA, Dearman RJ. Chemical allergy: translating biology into hazard characterization. Toxicol. Sci. 2011;120(S1):S238–S268. doi: 10.1093/toxsci/kfq346. [DOI] [PubMed] [Google Scholar]
- Knudsen TB, Kleinstreuer NC. Disruption of embryonic vascular development in predictive toxicology. Birth Defects Res. C. Embryo Today. 2011;93:312–323. doi: 10.1002/bdrc.20223. [DOI] [PubMed] [Google Scholar]
- Kuz’min VE, Artemenko aG, Muratov EN. Hierarchical QSAR technology based on the Simplex representation of molecular structure. J. Comput. Aided. Mol. Des. 2008;22:403–421. doi: 10.1007/s10822-008-9179-6. [DOI] [PubMed] [Google Scholar]
- Kuz’min VE, Artemenko AG, Muratov EN, Volineckaya IL, Makarov VA, Riabova OB, Wutzler P, Schmidtke M. Quantitative structure-activity relationship studies of [(biphenyloxy)propyl]isoxazole derivatives. Inhibitors of human rhinovirus 2 replication. J. Med. Chem. 2007;50:4205–4213. doi: 10.1021/jm0704806. [DOI] [PubMed] [Google Scholar]
- Lepoittevin J-P. Molecular Aspects in Allergic and Irritant Contact Dermatitis. In: Johansen JD, Frosch PJ, Lepoittevin J-P, editors. Contact Dermatitis. Heidelberg: Springer Berlin Heidelberg, Berlin; 2011. pp. 91–110. [Google Scholar]
- Li S, Fedorowicz A, Singh H, Soderholm SC. Application of the random forest method in studies of local lymph node assay based skin sensitization data. J. Chem. Inf. Model. 2005;45:952–964. doi: 10.1021/ci050049u. [DOI] [PubMed] [Google Scholar]
- Low Y, Sedykh A, Fourches D, Golbraikh A, Whelan M, Rusyn I, Tropsha A. Integrative chemical-biological read-across approach for chemical hazard classification. Chem. Res. Toxicol. 2013;26:1199–1208. doi: 10.1021/tx400110f. [DOI] [PMC free article] [PubMed] [Google Scholar]
- Low Y, Uehara T, Minowa Y, Yamada H, Ohno Y, Urushidani T, Sedykh A, Muratov E, Kuz’min V, Fourches D, Zhu H, Rusyn I, Tropsha A. Predicting drug-induced hepatotoxicity using QSAR and toxicogenomics approaches. Chem. Res. Toxicol. 2011;24:1251–1262. doi: 10.1021/tx200148a. [DOI] [PMC free article] [PubMed] [Google Scholar]
- Magee PS, Hostýnek JJ, Maibach HI, Francisco S. A classification model for allergic contact dermatitis. QSAR Comb. Sci. 1994;13:22–33. [Google Scholar]
- Maggiora GM. On outliers and activity cliffs--why QSAR often disappoints. J. Chem. Inf. Model. 2006;46:1535. doi: 10.1021/ci060117s. [DOI] [PubMed] [Google Scholar]
- Magnusson B, Kligman AM. The identification of contact allergens by animal assay. The guinea pig maximization test. J. Invest. Dermatol. 1969;52:268–276. doi: 10.1038/jid.1969.42. [DOI] [PubMed] [Google Scholar]
- Magnusson BM, Pugh WJ, Roberts MS. Simple rules defining the potential of compounds for transdermal delivery or toxicity. Pharm. Res. 2004;21:1047–1054. doi: 10.1023/b:pham.0000029295.38564.e1. [DOI] [PubMed] [Google Scholar]
- Matura M, Sköld M, Börje A, Andersen KE, Bruze M, Frosch P, Goossens A, Johansen JD, Svedman C, White IR, Karlberg A-T. Selected oxidized fragrance terpenes are common contact allergens. Contact Dermatitis. 2005;52:320–328. doi: 10.1111/j.0105-1873.2005.00605.x. [DOI] [PubMed] [Google Scholar]
- Mercier D. Clustering large datasets. Electron. Rev. - Linacre Coll. 2003 [Google Scholar]
- Miller MD, Yourtee DM, Glaros AG, Chappelow CC, Eick JD, Holder AJ. Quantum mechanical structure-activity relationship analyses for skin sensitization. J. Chem. Inf. Model. 2005;45:924–929. doi: 10.1021/ci050018z. [DOI] [PubMed] [Google Scholar]
- Muir DCG, Howard PH. Are there other persistent organic pollutants? A challenge for environmental chemists. Environ. Sci. Technol. 2006;40:7157–7166. doi: 10.1021/es061677a. [DOI] [PubMed] [Google Scholar]
- Muratov EN, Artemenko AG, Varlamova EV, Polischuk PG, Lozitsky VP, Fedchuk AS, Lozitska RL, Gridina TL, Koroleva LS, Sil’nikov VN, Galabov AS, Makarov VA, Riabova OB, Wutzler P, Schmidtke M, Kuz’min VE. Per aspera ad astra: application of Simplex QSAR approach in antiviral research. Future Med. Chem. 2010;2:1205–1226. doi: 10.4155/fmc.10.194. [DOI] [PubMed] [Google Scholar]
- Nandy A, Kar S, Roy K. Development of classification- and regression-based QSAR models and in silico screening of skin sensitisation potential of diverse organic chemicals. Mol. Simul. 2014;40:261–274. [Google Scholar]
- OECD. [accessed 4.11.13];OECD principles for the validation, for regulatory purposes, of (Quantitative) Structure-Activity Relationship models [WWW Document] 2004 URL http://www.oecd.org/chemicalsafety/risk-assessment/37849783.pdf.
- OECD. [accessed 1.23.13];Test No. 429: Skin Sensitisation [WWW Document]. OECD Guidelines for the Testing of Chemicals, Section 4: Health Effects. 2010 URL http://iccvam.niehs.nih.gov/SuppDocs/FedDocs/OECD/OECD-TG429-2010.pdf.
- OECD. [accessed 4.11.12];The adverse outcome pathway for skin sensitisation initiated by covalent binding to proteins part 1: scientific evidence [WWW Document]. OECD Enviroment, Heal. Safaty Publ. 2012 URL http://search.oecd.org/officialdocuments/displaydocumentpdf/?cote=env/jm/mono(2012)10/ part1&doclanguage=en.
- OECD. [accessed 6.10.14];OECD QSAR Toolbox v. 3.2 How to use the Toolbox AOP workflow for Skin Sensitization [WWW Document] 2014 URL http://www.oecd.org/env/ehs/risk-assessment/Tutorial_1_How to use AOP for Skin sensitization_F_28012014.pdf.
- Polishchuk PG, Muratov EN, Artemenko AG, Kolumbin OG, Muratov NN, Kuz’min VE. Application of random forest approach to QSAR prediction of aquatic toxicity. J. Chem. Inf. Model. 2009;49:2481–2488. doi: 10.1021/ci900203n. [DOI] [PubMed] [Google Scholar]
- Raunio H. In silico toxicology - non-testing methods. Front. Pharmacol. 2011;2:33. doi: 10.3389/fphar.2011.00033. [DOI] [PMC free article] [PubMed] [Google Scholar]
- Roberts DW, Aptula AO. Determinants of skin sensitisation potential. J. Appl. Toxicol. 2008;28:377–387. doi: 10.1002/jat.1289. [DOI] [PubMed] [Google Scholar]
- Roberts DW, Aptula AO, Patlewicz G. Electrophilic chemistry related to skin sensitization. Reaction mechanistic applicability domain classification for a published data set of 106 chemicals tested in the mouse local lymph node assay. Chem. Res. Toxicol. 2007a;20:44–60. doi: 10.1021/tx060121y. [DOI] [PubMed] [Google Scholar]
- Roberts DW, Patlewicz G, Dimitrov SD, Low LK, Aptula AO, Kern PS, Dimitrova GD, Comber MIH, Phillips RD, Niemelä J, Madsen C, Wedebye EB, Bailey PT, Mekenyan OG. TIMES-SS--a mechanistic evaluation of an external validation study using reaction chemistry principles. Chem. Res. Toxicol. 2007b;20:1321–1330. doi: 10.1021/tx700169w. [DOI] [PubMed] [Google Scholar]
- Saint-Mezard P, Rosieres A, Berard F, Dubois B, Kaiserlian D, Nicolas J, Krasteva M. Allergic contact dermatitis. Eur. J. Dermatol. 2004;14:284–295. [PubMed] [Google Scholar]
- Schlede E, Aberer W, Fuchs T, Gerner I, Lessmann H, Maurer T, Rossbacher R, Stropp G, Wagner E, Kayser D. Chemical substances and contact allergy—244 substances ranked according to allergenic potency. Toxicology. 2003;193:219–259. doi: 10.1016/s0300-483x(03)00266-x. [DOI] [PubMed] [Google Scholar]
- Scholes EW, Basketter DA, Sarll AE, Kimber I, Evans CD, Miller K, Robbins MC, Harrison PT, Waite SJ. The local lymph node assay: results of a final inter-laboratory validation under field conditions. J. Appl. Toxicol. 1992;12:217–222. doi: 10.1002/jat.2550120312. [DOI] [PubMed] [Google Scholar]
- Scorecard. [accessed 3.3.12];Skin or Sense Organ Toxicants [WWW Document] 2011 URL http://scorecard.goodguide.com/health-effects/chemicals-2.tcl?short_hazard_name=skin&all_p=t.
- Siegel PD, Fedorowicz A, Butterworth L, Law B, Anderson SE, Snyder J, Beezhold D. Physical-chemical and solvent considerations in evaluating the influence of carbon chain length on the skin sensitization activity of 1-bromoalkanes. Toxicol. Sci. 2009;107:78–84. doi: 10.1093/toxsci/kfn212. [DOI] [PubMed] [Google Scholar]
- Strid J, Strobel S. Skin barrier dysfunction and systemic sensitization to allergens through the skin. Curr. Drug Targets. Inflamm. Allergy. 2005;4:531–541. doi: 10.2174/156801005774322199. [DOI] [PubMed] [Google Scholar]
- Todeschini R, Consonni V. Handbook of Molecular Descriptors, Methods and Principles in Medicinal Chemistry. Germany: Wiley-VCH, Weinheim; 2000. [Google Scholar]
- Tropsha A. Best practices for QSAR model development, validation, and exploitation. Mol. Inform. 2010;29:476–488. doi: 10.1002/minf.201000061. [DOI] [PubMed] [Google Scholar]
- Tropsha A, Golbraikh A. Predictive QSAR modeling workflow, model applicability domains, and virtual screening. Curr. Pharm. Des. 2007;13:3494–3504. doi: 10.2174/138161207782794257. [DOI] [PubMed] [Google Scholar]
- Varnek A, Fourches D, Horvath D, Klimchuk O, Gaudin C, Vayer P, Solov’ev V, Hoonakker F, Tetko I, Marcou G. ISIDA - Platform for Virtual Screening Based on Fragment and Pharmacophoric Descriptors. Curr. Comput. Aided-Drug Des. 2008;4:191–198. [Google Scholar]
- Varnek A, Fourches D, Sieffert N, Solov’ev VP, Hill C, Lecomte M. QSPR Modeling of the Am III /Eu III Separation Factor: How Far Can we Predict? Solvent Extr. ion Exch. 2007;25:1–26. [Google Scholar]
- VEGA. [accessed 6.11.14];Skin Sensitization Model v. 2.1.1 [WWW Document] 2014 URL http://www.vega-qsar.eu/guidelines/VEGA_model_guide_SKIN_2_1_1.pdf.
- Watanabe KH, Andersen ME, Basu N, Carvan MJ, Crofton KM, King Ka, Suñol C, Tiffany-Castiglioni E, Schultz IR. Defining and modeling known adverse outcome pathways: domoic acid and neuronal signaling as a case study. Environ. Toxicol. Chem. 2011;30:9–21. doi: 10.1002/etc.373. [DOI] [PubMed] [Google Scholar]
Associated Data
This section collects any data citations, data availability statements, or supplementary materials included in this article.