

Abstract
Bacterial infections are known to alter glucose metabolism within tissues via mechanisms of inflammation. We conducted this study to examine whether insulin response genes are differentially expressed in gingival tissues, comparing samples from experimental gingivitis and periodontitis subjects to those from healthy individuals. Total RNA was extracted from gingival biopsies from 26 participants: 8 periodontally healthy, 9 experimental gingivitis, and 9 periodontitis subjects. Gene expression patterns were evaluated with a polymerase chain reaction array panel to examine 84 candidate genes involved with glucose metabolism, insulin resistance, and obesity. Array data were evaluated with a t test adjusted by the false discover rate (P < 0.05), and ingenuity pathway analysis was performed for statistical testing of pathways. Although tissue samples were not sufficient to enable protein quantification, we confirmed the upregulation of the key gene using lipopolysaccharide-stimulated primary gingival epithelial cells by Western blot. The mRNA expression patterns of genes that are associated with insulin response and glucose metabolism are markedly different in experimental gingivitis subjects compared with healthy controls. Thirty-two genes are upregulated significantly by at least 2-fold, adjusted for false discover rate (P < 0.05). Periodontitis subjects show similar but attenuated changes in gene expression patterns, and no genes meet the significance criteria. Ingenuity pathway analysis demonstrates significant activation of the carbohydrate metabolism network in experimental gingivitis but not in periodontitis. G6PD protein increases in response to lipopolysaccharide stimulation in primary gingival epithelial cells, which is in the same direction as upregulated mRNA in tissues. Acute gingival inflammation may be associated with tissue metabolism changes, but these changes are not evident in chronic periodontitis. This study suggests that acute gingival inflammation may induce localized changes that modify tissue insulin/glucose metabolism.
Keywords: gene expression, periodontitis, gingivitis, gingiva, inflammation, carbohydrate metabolism
Introduction
Periodontal disease is a biofilm-initiated inflammatory condition that affects the tooth-supporting apparatus. Two major periodontal diseases—gingivitis and periodontitis—affect 75% and 47% of the adult population in the United States, respectively (Albandar and Kingman 1999; Eke et al. 2012). The pathogenesis of periodontal disease has been described in many aspects, but little is known regarding periodontal tissue glucose metabolism and insulin responsiveness.
Glucose is a major energy source for human cells besides fat and protein, and inflammatory signals are likely to affect glucose metabolism. Insulin is critical for cellular uptake of glucose through the glucose transportation system and for activating enzymatic pathways of glucose metabolism to produce energy for cellular activation and survival. Within gingival tissues, the existence of major glucose transporters GLUT1 and GLUT4 is an indication that glucose metabolism may have a profound effect on periodontal tissue metabolism (Kuroki et al. 2009; Rao et al. 2012). Many studies have shown that certain proinflammatory cytokines that are elevated in gingivitis and periodontitis can modulate glucose utilization and metabolism (Page 1991; Taylor et al. 1992; Shoelson et al. 2006). Tumor necrosis factor α (TNF-α), interleukin 6 (IL-6), interleukin 1β (IL-1β), and increased level of oxidative stress are all known to cause insulin resistance by disrupting molecular pathways, including c-Jun N-terminal kinase and insulin signaling pathways (Hotamisligil et al. 1993; Lee et al. 2003; Evans et al. 2005). The modulatory roles of inflammatory cytokines on glucose metabolism appear to be cell and tissue specific. TNF-α inhibits glucose uptake by decreasing GLUT4 expression in adipose tissue (Ruan et al. 2002). However, in non-insulin-sensitive tissues, TNF-α or IL-1β has been proved to increase glucose utilization (Yu et al. 1995; Shikhman et al. 2001). TNF-α is also known to block lipoprotein lipase production, which may as a result increase glucose utilization (Kim et al. 2001).
Gingivitis and periodontitis are both known to be associated with dramatic elevations in inflammatory cytokines and chemokines (Page 1991). However, whether gingival inflammation (acute vs. chronic) affects glucose metabolism and insulin response gene expression locally is still unknown. Therefore, we conducted this study to begin to explore whether genes associated with glucose metabolism and insulin response were differentially expressed in gingival biopsies, comparing experimental gingivitis and chronic periodontitis to healthy tissues.
Materials and Methods
Study Participant Selection and Gingival Tissue Biopsies
Twenty-six participants, aged 18 to 64 y, provided informed consent and were recruited in the dental clinics from School of Dentistry at the University of North Carolina at Chapel Hill. All procedures were approved by the Institutional Review Board of the University of North Carolina at Chapel Hill. Participants were sequentially enrolled with periodontally healthy tissue, experimental gingivitis, or chronic periodontitis with the following exclusion criteria: (1) no use of antibiotics within 1 mo before the screening examinations, (2) no signs of systemic diseases with any oral manifestation at the time of the enrollment, (3) and no self-reporting treatment for systemic diseases 3 mo prior to the collections of gingival biopsies. Besides obtaining demographic information and periodontal clinical parameters, examiners also recorded all participants’ weight and height to compute body mass index (BMI).
Eight periodontally healthy participants were either healthy volunteers or patients who were undergoing crown-lengthening procedures, and they exhibited ≤4-mm probing depth and no signs of bleeding on probing at the biopsy site. Nine chronic periodontitis patients representing chronic inflammation were enrolled with exhibitions of ≥5 mm of probing depth, presence of bleeding on probing, and radiographic demonstration of bone loss. Nine experimental gingivitis patients representing acute inflammation were acquired from a 3-wk stent-induced biofilm overgrowth procedure (Offenbacher et al. 2009). A gingival biopsy was obtained from each subject at the site of marginal gingiva. Periodontitis gingival biopsies were acquired at the severely inflamed sites during a periodontal flap osseous surgery. For experimental gingivitis subjects, gingival biopsies were obtained at the end of 3 wk of induction. Upon harvesting, all biopsies were immediately preserved in RNAlater (Ambion) overnight at 4 °C and then transferred to −80 °C for longer storage.
RNA Isolation and Assays for Insulin Response Gene Expression Profile
Total RNA was isolated from gingival biopsies with RNeasy Mini Kit (Qiagen), and 600 ng of the RNA was reverse transcribed to cDNA with RT2 First Strand Kit (Qiagen). To examine genes of interest, we used a diabetes pathway–focused RT2 Profiler PCR Array (PAHS-023) in a 7500 Sequence Detection System (ABI Prism, Applied Biosystems). The mRNA expression levels were normalized using glyceraldehyde 3-phosphate dehydrogenase (Gapdh) as the housekeeping gene. We performed the delta-delta threshold cycle method to calculate fold changes of regulated genes. The cutoff threshold cycle value for quantitative polymerase chain reaction (PCR) was set at 35, and all genes within this threshold were included in the analysis. The identified genes were then mapped to known molecular networks in ingenuity pathway analysis (IPA) to obtain statistical significance estimates for pathways and networks ranked by Fisher exact scores.
Cell Culture, Lipopolysaccharide Stimulation, and Western Blot
Primary human gingival cells (HGEPs) were purchased from CellnTec and maintained according to the manufacturer’s instructions. One µg/mL of Escherichia coli (O55:B5) lipopolysaccharide (LPS; Sigma-Aldrich) was added to stimulate HGEPs for 0, 4, 8, and 24 h. Whole cell extracts were prepared by lysing the cells with ice-cold RIPA buffer (Cell Signaling 10× buffer and Roche protease inhibitor mixture). The protein concentrations of the lysates were determined by DC Protein Assay (Bio-Rad). The same amount of protein was separated by 4% to 12% Bis-Tris gels and transferred to a nitrocellulose membrane (BD). The membrane was blocked 1 h in 5% milk powder–TBST solution and then overnight blotted with anti-G6PD (H160, Santa Cruz) or anti-β actin antibodies (13E5, Cell Signaling). Membranes were washed 3 times with TBST, incubated with anti-rabbit HRP-labeled secondary antibodies in TBST, and developed with the ECL system (SuperSignal West Pico; Pierce).
Statistical Analysis
To compare gene expression in different groups, we used web-based RT2 Profiler PCR Array Data Analysis, version 3.5 (http://pcrdataanalysis.sabiosciences.com/pcr/arrayanalysis.php). This web-based analysis by default employs Student’s t test to examine the differences among groups, which increase type Ι error. To correct for this error, we applied the false discover rate test to calculate a stringent statistical significance, and the significance level was set at 0.05. To explore potential confounding effects of age on expression patterns, we used multiple linear regression models. For network analysis based on IPA, the significance of the networks was calculated with the right-tailed Fisher exact test.
Results
Participants
The demographic information and periodontal parameters of the participants are shown in Table 1. No statistically significant differences in age, sex, race, BMI, and smoking history were found among participants with either healthy or diseased gingival tissues. As expected, clinical parameters such as probing depth and attachment loss exhibited higher readings in chronic periodontitis subjects compared with healthy and gingivitis participants.
Table 1.
Subjects’ Demographics and Clinical Parameters
| Healthy (n = 8) | Gingivitis (n = 9) | Periodontitis (n = 9) | P | |
|---|---|---|---|---|
| Age | 45.9 ± 4.9 | 37.0 ± 3.0 | 46.2 ± 4.9 | 0.2 |
| Female | 5 | 5 | 5 | 0.9 |
| Caucasian | 6 | 8 | 5 | 0.3 |
| Body mass index | 29.7 ± 2.3 | 28.5 ± 1.6 | 30.4 ± 2.4 | 0.8 |
| <30 | 24.6 ± 1.7 | 25.2 ± 1.4 | 25.6 ± 1.0 | 0.9 |
| ≥30 | 34.8 ± 2.1 | 32.6 ± 1.6 | 36.5 ± 3.2 | 0.6 |
| Ex-smoker | 2 | 2 | 4 | 0.5 |
| Probing depth | 2.4 ± 0.2 | 1.9 ± 0.2 | 5.0 ± 0.3 | <0.001 |
| Attachment loss | 0.5 ± 0.2 | 1.0 ± 0.2 | 3.9 ± 0.6 | <0.001 |
Values are presented in mean ± standard error or n.
Gene Expression Patterns in Gingivitis and Periodontitis Subjects
We compared gene expression patterns among healthy, experimental gingivitis, and periodontitis gingival biopsies. The volcano plot showing the log2 (fold change) plotted versus the −log10 (P value) for the 76 genes that were within the threshold cycle value can be seen in Figure 1. Genes that were upregulated at least 2-fold are illustrated in Figure 1 as red dots, with the clustering of genes within the upper-right quadrant for statistically significant genes. Only a few genes were downregulated as indicated as green dots. In Figure 1A, which compares gingivitis with healthy subjects, 45 genes were upregulated >2-fold, and 32 of them were at P < 0.05 after false discover rate–adjusted t test. In this comparison, 5 genes were downregulated >2-fold, but none of them reached statistical significance (P > 0.05). In Figure 1B, the periodontitis group shows similar directional but much attenuated changes in gene expression with 15 genes being upregulated >2-fold. However, none of them reached statistical significance by false discover rate-adjusted t test. Only 1 gene was found downregulated >2-fold, but it did not reach statistical significance as well (P > 0.05). To highlight the major effects of gingival inflammation on gene expression, we report genes that were regulated >4-fold in Table 2. The complete expression data appear in the Appendix Table. To explore potential confounding effects of age on gene expression, we chose the top 4 regulated genes in overall comparisons (G6PD, IFNG, CEBPA, DUSP4) and analyzed their fold-change differences adjusted by age. Adjusted fold change did not differ much from the unadjusted fold change. When gingivitis was compared with healthy subjects, the age-adjusted fold-change differences were slightly increased. For instance, adjusted G6PD fold regulation was increased by 11% (data not shown). This gene expression profile suggests that genes that are associated with glucose metabolism and insulin responsiveness are more highly expressed in acute gingival inflammation but not significantly upregulated in chronic inflammation.
Figure 1.

Volcano plot presenting regulation of insulin response genes, comparing diseased with healthy subjects. The vertical axis refers to the −log10 (P value) for t test of differences among groups; the horizontal axis refers to log2 (fold change) as expression levels. Red and green dots represent upregulated (>2-fold) and downregulated (<2-fold) genes, respectively. Black dots are genes that are within 2-fold regulation. The clustering of red dots within the upper-right quadrant are statistically significant genes (P < 0.05). (A) Forty-five genes are upregulated >2-fold in experimental gingivitis group, and 32 of them are statistically significant; 5 genes are downregulated >2-fold in the same group, but none of them reach statistical significance. (B) Fifteen genes are upregulated >2-fold and 1 gene is downregulated >2-fold in the chronic periodontitis group, but none of them is significant.
Table 2.
Gene Transcription in Gingivitis and Periodontitis Compared with Healthy Subjects
| Gingivitis | Periodontitis | |||
|---|---|---|---|---|
| Molecules | Fold Change | P Value | Fold Change | P Value |
| G6PD | 14.11 | 0.0021a | 3.34 | 0.99 |
| IFNG | 13.12 | 0.0069a | 1.94 | 0.99 |
| CEBPA | 10.39 | 0.0021a | 2.64 | 0.99 |
| DUSP4 | 9.90 | 0.0085a | 2.04 | 0.99 |
| PDX1 | 9.69 | 0.038a | 1.42 | 0.99 |
| SNAP23 | 8.48 | 0.037a | 1.86 | 0.99 |
| PRKCB | 7.82 | 0.0080a | 1.09 | 0.99 |
| PARP1 | 6.98 | 0.0084a | 3.40 | 0.99 |
| IRS1 | 6.69 | 0.0069a | 2.20 | 0.99 |
| STXBP2 | 6.66 | 0.010a | 2.25 | 0.99 |
| TRIB3 | 6.39 | 0.013a | 1.51 | 0.99 |
| IL12B | 6.38 | 0.087 | 1.20 | 0.99 |
| STX4 | 6.01 | 0.031a | 2.01 | 0.99 |
| CCL5 | 5.06 | 0.96 | 2.67 | 0.99 |
| PIK3CD | 5.06 | 0.0069a | 1.60 | 0.99 |
| IL6 | 5.02 | 0.28 | 1.98 | 0.99 |
| SREBF1 | 4.95 | 0.010a | 1.49 | 0.99 |
| PRKAG2 | 4.84 | 0.0045a | 2.09 | 0.99 |
| HNF4A | 4.66 | 0.89 | 1.72 | 0.99 |
| NSF | 4.56 | 0.0026a | 1.96 | 0.99 |
| SNAP25 | 4.43 | 0.0084a | 1.76 | 0.99 |
| PIK3C2B | 4.37 | 0.0069a | 1.08 | 0.99 |
| TGFB1 | 0.23 | 0.68 | 0.66 | 0.99 |
Fold changes are calculated through the delta-delta threshold cycle method; P values are generated by Student’s t tests, followed by a false discover rate adjustment.
Statistical significance after the false discover rate adjustment, P < 0.05.
Molecular Networks Analysis in Gingivitis and Periodontitis Subjects
To further understand the biological relationships between genes, we used IPA to analyze molecular networks encompassing investigated genes. To include regulated genes that are more relevant in the network analysis, we used fold regulation at 1.5 as the cutoff threshold. Figure 2 shows the top 5 activated networks in gingivitis subjects compared with their healthy counterparts. Each network is endowed with a score, and in IPA a score ≥2 suggests that networks have at least a 99% confidence of not being generated by random chance. Since we used the targeted array, the highest ranked network comprised endocrine disorders, metabolic disease, and carbohydrate metabolism (P = 1 × 10⁻²⁵). As delineated in Figure 2, the majority of key molecules in this network were upregulated (red nodes) by acute inflammation, with only AKT2 and NFkB1 genes being downregulated (green nodes). The IPA for the periodontitis group shows similar key networks (data not shown) but is greatly attenuated, suggesting that periodontitis subjects have an overall nonsignificant trend for the activation of glucose metabolism and insulin responsiveness.
Figure 2.

Ingenuity pathway analysis comparing gingivitis to healthy subjects. Functions and scores of 5 activated networks in gingivitis subjects are listed. The top-ranked network comprises endocrine disorders, metabolic disease, and carbohydrate metabolism functions (score = 25). The majority of molecules in this network are highlighted by red, indicating upregulation. Only 2 molecules are highlighted by green, indicating downregulation. Genes that are associated with these key network molecules but not included in the polymerase chain reaction array are not colored. Straight lines represent direct interaction, and dotted lines represent indirect interaction.
G6PD Protein Expression Increases in Response to LPS Stimulation
To confirm that the elevated mRNA expression data seen in experimental gingivitis likely is mirrored by increased protein expression, we created an in vitro acute inflammatory condition by stimulating HGEPs with E. coli LPS and detected G6PD protein expression by Western blot. G6PD was selected as a marker because it was the top upregulated mRNA species identified (Table 2). As demonstrated in Figure 3, G6PD protein expression increased in response to LPS stimulation starting from 4 h of stimulation, suggesting that inflammatory stimuli likely induce G6PD on both mRNA and protein levels.
Figure 3.
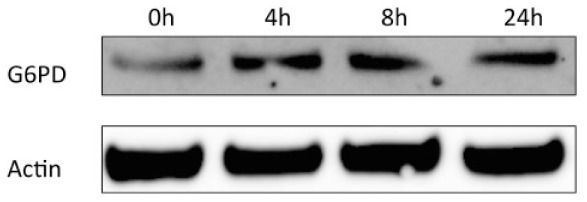
G6PD protein increases by Escherichia coli LPS stimulation. Primary human gingival cells were treated with E. coli lipopolysaccharide (1 µg/mL) for 0, 4, 8, and 24 h, and blotting for G6PD showed protein upregulation.
Discussion
This study suggests that during the induction of experimental gingivitis, the acute gingival inflammatory response is locally activating glucose metabolism and insulin response genes, but in chronic inflammation there has been a reestablishment of a relative balance in insulin/glucose metabolism within the local gingival tissues.
The experimental gingivitis group has an overall markedly upregulated gene profile for these glucose/insulin response genes. As can be seen in Table 2, the top 4 upregulated genes in gingivitis biopsies are G6PD, IFNG, CEBPA, and DUSP4. Both tissue mRNA data and gingival epithelial cell protein data suggest that gingival inflammation affects G6PD expression (Table 2, Fig. 3). The augmentation in G6PD is likely a response to attenuate oxidative stress by generating NADPH rather than participate in the pentose- or carbohydrate-driven pathway for 5-carbon sugars. The increased INFG mRNA is a clear sign for inductions of gingival inflammation, since interferon γ is an activator for both innate and adaptive immunity. Wong et al. (2011) demonstrated that restricting interferon γ in mice improved their glucose metabolism. There was also a significant increase in CEBPA, which encodes for CCAAT/enhancer-binding protein α that controls transcriptions of GCSF and IL6R genes and therefore affects granulocytes differentiation (Zhang et al. 1998). LPS from Porphyromonas gingivalis, IL-1β, IL-1α, and TNF-α all enhanced DNA-binding activity of CEBPA, suggesting that CEBPA may be linked to periodontal inflammation (Kido et al. 2005). DUSP4 is a downstream transcription factor of the MAPK pathway, and it forms a negative feedback loop on limiting MAPK activity (Arthur and Ley 2013). In periodontal cells, MAPK participates in the regulation of IL-6 and enzymes such as MMP-1 and MMP-13, and elevated DUSP4 could be a protective mechanism to control MAPK activity (Craig et al. 2000; Johansson et al. 2000). However, a previous study found that DUSP4 protein expression in gingival epithelial cells was decreased by periodontal pathogens, which was in contrast with our data showing a significant upregulation of DUSP4 mRNA in gingivitis (Hasegawa et al. 2007). One limitation of our study is that we did not have adequate biopsy samples to confirm protein expression levels, as our emphasis was on transcriptomic analysis.
In addition, the expression of key insulin signaling molecules—namely, IRS1, IRS2, SLC2A4 (GLUT4), STX4, STXBP2, and PIK3R1—are all enhanced in experimental gingivitis. This suggests that locally acute inflammation upregulates glucose metabolism by increasing local cellular uptake and glucose utilization. The IPA as shown in Figure 2 confirms that the pathway associated with carbohydrate metabolism is activated by acute inflammation. However, chronic inflammation associated with periodontitis was not as capable as acute inflammation in regulating glucose/insulin response genes, as shown in Table 2 and in the Appendix Table. This suggests that in chronic inflammation, there is some adaptation in the localized tissue response to create a more homeostatic glycolic local environment. Importantly, we had no naturally occurring gingivitis samples to compare in this study. However, we might expect them to have similar insulin/glucose profiles as periodontitis, if the naturally occurring gingivitis represents a chronic inflammatory process. Our findings suggest that acute episodes of inflammation superimposed on existing chronic gingivitis or periodontitis may be associated with disrupted glucose uptake and metabolism, but that will require experimental confirmation.
In gingival tissues, glucose metabolism may not only be important for tissue metabolism but also affect microenvironment that supports the growth of periodontal pathogens. We appreciate that most subgingival species and most of the pathogens are asaccharolytic. However, the extension of the supragingival adherent plaque that contains saccharolytic bacteria into the subgingival pocket provides an important “feeder bed” to provide nutrients of intermediate metabolism, including lactate and formate to support the metabolism of the asaccharolytic organisms.
There were no statistical differences in race, sex, age, smoking history, or BMI in the study subjects. BMI was matched in subjects from each group to eliminate potential effects of obesity on local insulin/glucose metabolism gene expression. It should be noted that the mean age of the gingivitis group varies from those of the other groups, which raises questions about the confounding effects of age on gene expression. Our analysis shows that adjusted fold regulation did not differ much from unadjusted fold regulation. This suggests that the markedly differential expression pattern that we observed in gingivitis subjects was not affected by age. To further prove the interactions between age and insulin response gene expression, larger study subjects are needed. The application of PCR array allows us to have more quantitative data compared with microarray. However, limitations of this study were that relatively few subjects were involved, thereby limiting the generalizability of the findings, and we did not design the study to enable protein analysis. Although this is a pilot study with relatively few subjects (N = 26), it demonstrates the utility of pathway analysis, which allows each molecular observation to contribute to the overall significance of networks.
In conclusion, this study suggests that acute gingival inflammation may induce localized changes that modify tissue insulin/glucose metabolism. But these changes are not evident in chronic periodontitis. Additionally, larger studies will be needed to confirm these findings to provide insights into understanding the association between gingival inflammation and periodontal tissue metabolism.
Author Contributions
N. Yu, contributed to data acquisition, analysis, and interpretation, drafted and critically revised the manuscript; S. P. Barros, contributed to conception and design, critically revised the manuscript; S. Zhang, S.T. Phillips, contributed to data acquisition, critically revised the manuscript; K.L. Moss, contributed to data analysis, critically revised the manuscript; S. Offenbacher, contributed to conception and design, drafted and critically revised the manuscript. All authors gave final approval and agree to be accountable for all aspects of the work.
Supplementary Material
Footnotes
A supplemental appendix to this article is published electronically only at http://jdr.sagepub.com/supplemental.
This study was funded by the National Institute of Dental and Craniofacial Research (R90-DE022527 and 5R01DE021418) and the National Institutes of Health (1UL1TR001111).
The authors declare no potential conflicts of interest with respect to the authorship and/or publication of this article.
References
- Albandar JM, Kingman A. 1999. Gingival recession, gingival bleeding, and dental calculus in adults 30 years of age and older in the United States, 1988–1994. J Periodontol. 70(1):30–43. [DOI] [PubMed] [Google Scholar]
- Arthur JS, Ley SC. 2013. Mitogen-activated protein kinases in innate immunity. Nat Rev Immunol. 13(9):679–692. [DOI] [PubMed] [Google Scholar]
- Craig R, Larkin A, Mingo AM, Thuerauf DJ, Andrews C, McDonough PM, Glembotski CC. 2000. p38 MAPK and NF-kappa B collaborate to induce interleukin-6 gene expression and release. J Biol Chem. 275(31):23814–23824. [DOI] [PubMed] [Google Scholar]
- Eke PI, Dye BA, Wei L, Thornton-Evans GO, Genco RJ; CDC Periodontal Disease Surveillance Workgroup. 2012. Prevalence of periodontitis in adults in the United States: 2009 and 2010. J Dent Res. 91(10):914–920. [DOI] [PubMed] [Google Scholar]
- Evans JL, Maddux BA, Goldfine ID. 2005. The molecular basis for oxidative stress-induced insulin resistance. Antioxid Redox Signal. 7(7–8):1040–1052. [DOI] [PubMed] [Google Scholar]
- Hasegawa Y, Mans JJ, Mao S, Lopez MC, Baker HV, Handfield M, Lamont RJ. 2007. Gingival epithelial cell transcriptional responses to commensal and opportunistic oral microbial species. Infect Immun. 75(5):2540–2547. [DOI] [PMC free article] [PubMed] [Google Scholar]
- Hotamisligil GS, Shargill NS, Spiegelman BM. 1993. Adipose expression of tumor necrosis factor-alpha: direct role in obesity-linked insulin resistance. Science. 259(5091):87–91. [DOI] [PubMed] [Google Scholar]
- Johansson N, Ala-aho R, Uitto V, Grénman R, Fusenig NE, López-Otín C, Kähäri VM. 2000. Expression of collagenase-3 (MMP-13) and collagenase-1 (MMP-1) by transformed keratinocytes is dependent on the activity of p38 mitogen-activated protein kinase. J Cell Sci. 113(Pt 2):227–235. [DOI] [PubMed] [Google Scholar]
- Kido J, Hayashi N, Kataoka M, Nagata T. 2005. Calprotectin expression in human monocytes: induction by porphyromonas gingivalis lipopolysaccharide, tumor necrosis factor-alpha, and interleukin-1beta. J Periodontol. 76(3):437–442. [DOI] [PubMed] [Google Scholar]
- Kim JK, Fillmore JJ, Chen Y, Yu C, Moore IK, Pypaert M, Lutz EP, Kako Y, Velez-Carrasco W, Goldberg IJ, et al. 2001. Tissue-specific overexpression of lipoprotein lipase causes tissue-specific insulin resistance. Proc Natl Acad Sci U S A. 98(13):7522–7527. [DOI] [PMC free article] [PubMed] [Google Scholar]
- Kuroki S, Yokoo S, Terashi H, Hasegawa M, Komori T. 2009. Epithelialization in oral mucous wound healing in terms of energy metabolism. Kobe J Med Sci. 55(1):E5–E15. [PubMed] [Google Scholar]
- Lee YH, Giraud J, Davis RJ, White MF. 2003. c-Jun N-terminal kinase (JNK) mediates feedback inhibition of the insulin signaling cascade. J Biol Chem. 278(5):2896–2902. [DOI] [PubMed] [Google Scholar]
- Offenbacher S, Barros SP, Paquette DW, Winston JL, Biesbrock AR, Thomason RG, Gibb RD, Fulmer AW, Tiesman JP, Juhlin KD, et al. 2009. Gingival transcriptome patterns during induction and resolution of experimental gingivitis in humans. J Periodontol. 80(12):1963–1982. [DOI] [PubMed] [Google Scholar]
- Page RC. 1991. The role of inflammatory mediators in the pathogenesis of periodontal disease. J Periodontal Res. 26(3 Pt 2):230–242. [DOI] [PubMed] [Google Scholar]
- Rao SR, Sundaram S, Lavu V. 2012. Immuno-localization of glucose transporter 4 in healthy human gingiva. Indian J Dent Res. 23(5):565–567. [DOI] [PubMed] [Google Scholar]
- Ruan H, Hacohen N, Golub TR, Van Parijs L, Lodish HF. 2002. Tumor necrosis factor-alpha suppresses adipocyte-specific genes and activates expression of preadipocyte genes in 3T3–L1 adipocytes: nuclear factor-kappaB activation by TNF-alpha is obligatory. Diabetes. 51(5):1319–1336. [DOI] [PubMed] [Google Scholar]
- Shikhman AR, Brinson DC, Valbracht J, Lotz MK. 2001. Cytokine regulation of facilitated glucose transport in human articular chondrocytes. J Immunol. 167(12):7001–7008. [DOI] [PubMed] [Google Scholar]
- Shoelson SE, Lee J, Goldfine AB. 2006. Inflammation and insulin resistance. J Clin Invest. 116(7):1793–1801. [DOI] [PMC free article] [PubMed] [Google Scholar]
- Taylor DJ, Faragher EB, Evanson JM. 1992. Inflammatory cytokines stimulate glucose uptake and glycolysis but reduce glucose oxidation in human dermal fibroblasts in vitro. Circ Shock. 37(2):105–110. [PubMed] [Google Scholar]
- Wong N, Fam BC, Cempako GR, Steinberg GR, Walder K, Kay TW, Proietto J, Andrikopoulos S. 2011. Deficiency in interferon-gamma results in reduced body weight and better glucose tolerance in mice. Endocrinology. 152(10):3690–3699. [DOI] [PubMed] [Google Scholar]
- Yu N, Maciejewski-Lenoir D, Bloom FE, Magistretti PJ. 1995. Tumor necrosis factor-alpha and interleukin-1 alpha enhance glucose utilization by astrocytes: involvement of phospholipase A2. Mol Pharmacol. 48(3):550–558. [PubMed] [Google Scholar]
- Zhang P, Iwama A, Datta MW, Darlington GJ, Link DC, Tenen DG. 1998. Upregulation of interleukin 6 and granulocyte colony-stimulating factor receptors by transcription factor CCAAT enhancer binding protein alpha (C/EBP alpha) is critical for granulopoiesis. J Exp Med. 188(6):1173–1184. [DOI] [PMC free article] [PubMed] [Google Scholar]
Associated Data
This section collects any data citations, data availability statements, or supplementary materials included in this article.