

Significance
As with their macroscopic counterparts, the moving parts of nanoscale protein machines grow hot while in operation. A portion of the energy biomolecules harness to perform meaningful work is always dissipated as heat into the surroundings. Here, we feature a methodology by which dominant dissipative trajectories can be extracted from detailed models of protein dynamics. In two important classes of signaling proteins [kinases and G-protein–coupled receptors (GPCRs)], we find that the regions of phase space in which heat is evolved are closely connected to the structural dynamics these proteins use to transmit signals. This schematic might be used to probe the true functional dynamics of biomolecules that drive a wide array of cellular architectures and ultimately sustain the steady state of life.
Keywords: entropy production, signaling proteins, Markov state models, heat dissipation, functional dynamics
Abstract
Life is fundamentally a nonequilibrium phenomenon. At the expense of dissipated energy, living things perform irreversible processes that allow them to propagate and reproduce. Within cells, evolution has designed nanoscale machines to do meaningful work with energy harnessed from a continuous flux of heat and particles. As dictated by the Second Law of Thermodynamics and its fluctuation theorem corollaries, irreversibility in nonequilibrium processes can be quantified in terms of how much entropy such dynamics produce. In this work, we seek to address a fundamental question linking biology and nonequilibrium physics: can the evolved dissipative pathways that facilitate biomolecular function be identified by their extent of entropy production in general relaxation processes? We here synthesize massive molecular dynamics simulations, Markov state models (MSMs), and nonequilibrium statistical mechanical theory to probe dissipation in two key classes of signaling proteins: kinases and G-protein–coupled receptors (GPCRs). Applying machinery from large deviation theory, we use MSMs constructed from protein simulations to generate dynamics conforming to positive levels of entropy production. We note the emergence of an array of peaks in the dynamical response (transient analogs of phase transitions) that draw the proteins between distinct levels of dissipation, and we see that the binding of ATP and agonist molecules modifies the observed dissipative landscapes. Overall, we find that dissipation is tightly coupled to activation in these signaling systems: dominant entropy-producing trajectories become localized near important barriers along known biological activation pathways. We go on to classify an array of equilibrium and nonequilibrium molecular switches that harmonize to promote functional dynamics.
Proteins that perform work on their surroundings are, in effect, heat engines. Such systems pull in energy from the environment, transduce a portion of this energy into productive motion, and release the remainder of their intake back into their surroundings as heat. Just as one might observe a macroscopic engine at work, a cellular physicist might dream of observing protein machines in operation as driven components of biological pathways. The driving forces placed on individual biomolecules, like those studied here, are functions of exceptionally complex external fields in the cellular environment. For example, key signaling proteins such as G-protein–coupled receptors (GPCRs) (which comprise a large percentage of human drug targets) (1) and kinases (which are deeply entwined in the pathology of cancer) (2) interact with other protein domains, membranes, and/or small molecules in their signaling environments, and both classes of systems rely (either directly or indirectly) on ATP hydrolysis to function. At present, simulation of these in vivo “functional conditions,” in atomistic detail and to timescales of interest, is an intractable proposition.
However, just like their macroscopic counterparts, we know nanoscale protein machines cannot operate with perfect efficiency. Biological systems have evolved under the Second Law of Thermodynamics, the precept that provides us with a sense of a forward direction in time. When proteins are performing meaningful work, they must also be dissipating some amount of heat into their surroundings. The converse of this statement may be useful for connecting proteins to the forces that drive them.
It has previously been hypothesized that functional dynamics are strongly connected to the general dissipative processes a system undertakes (3). As with macroscopic engines, the pistons of biomolecular machines should get hot while in operation; if a system dissipates energy (i.e., produces entropy) in a specific region of its phase space, one might suspect that functional dynamics are nearby. How can we test this hypothesis?
When considering a driven system, we need to suppose that our usual Hamiltonian is augmented with some external, time-dependent driving field, (3). In the context of biomolecular systems, relevant components of this field (other small molecules, proteins, membranes, etc.) can extend beyond the cellular scale in scope—presenting a monumental challenge for detailed simulation. Continuing our analogy to macroscopic engines, one might take a first step toward understanding the functional dynamics of a machine’s components by simply displacing its moving parts and characterizing any localized dissipation observed over the course of subsequent motion. Generally speaking, this procedure amounts to preparing a system in a specific nonequilibrium state and studying the statistics of the dissipation that result during relaxation back to equilibrium. In this work, we will follow this prescription to study the nature of dissipative processes in a model kinase and GPCR.
Theory, Models, and Methods
Entropy production is directly proportional, via , to the amount of heat dissipated during a driven process. In our heat engine notation (shown in Fig. 1), the amount of heat dissipated into the system’s surroundings, , is related to the total amount of energy absorbed, , and the work done by the system on its surroundings, W:
| [1] |
Fig. 1.

Molecular machines as heat engines. (Left) In a heat engine, heat , is absorbed from a hot source at temperature . The engine transduces some of this heat into work on its surroundings, W, and the rest of the absorbed energy, , is dissipated into a cold sink at . (Right) If a protein performs work on its surroundings, the properties of heat engines must apply to its functional dynamics. Such biomolecules are coupled to an energy source, , and dissipate an amount of heat, , into the bath.
Markov state models (MSMs), which leverage a network-based approach to describe dynamics among small ensembles of molecular configurations, have proven useful for understanding protein folding and conformational change (4, 5). The foundational theory of Markov chains, however, also allows one to characterize the statistics of entropy production with relative ease. In nonequilibrium statistical mechanics, one often considers entropy production in the microscopic trajectories a system might follow. For a trajectory x of some length , we can define a corresponding level of entropy production, , using its forward and reverse probabilities:
| [2] |
For dynamics that obey detailed balance, one can show (see Supporting Information for more details) that the entropy production corresponding to a given trajectory, x, depends only the equilibrium probabilities of that trajectory’s beginning and end states, and : . As noted above, we seek to track the statistics of dissipation as a protein system relaxes from a prepared nonequilibrium state. We here focus on uniform nonequilibrium starting states, as such initial distributions are largely agnostic to information encoded on the protein free energy landscapes. Propagating this uniform distribution through an N-state Markov model with an transition probability matrix, , over a given observation time, , one can compute the probability for a given value of entropy production conditioned on trajectory beginning and end points: . By enumerating all possible trajectory starting points and endpoints, one can bin such conditional probabilities to produce the full probability distribution over the entropy production spanning a given observation time, .
After computing , a next natural step involves analyzing subensembles of trajectories that give rise to interesting features (e.g., peaks and troughs) of the distribution. To facilitate this analysis, one can borrow machinery from large deviation theory to generate subensembles of trajectories that conform to particular mean rates of entropy production. Much like a simple, controllable version of the discussed previously, a scalar parameter, λ, coupled to the entropy production can be used as a control parameter that tunes the extent of dissipation in a system’s trajectories. Ultimately, the generation of these “λ-ensembles” circumvents the more expensive need to calculate full distributions over at each time step when biased probability data are only needed at a few representative values of λ (see below for more details).
A detailed description of λ-ensemble theory in the context of Markov chains is included in Supporting Information; further background and derivation can be found throughout the literature (6–13). To introduce the λ parameter into our MSM dynamics, we define the “tilted” transition matrix for λ-ensembles corresponding to an initial uniform distribution (9, 10):
| [3] |
The tilted matrix describes ensembles of trajectories based on their extent of entropy production, . To study the statistics of these ensembles, one often invokes a cumulant generating function, or “dynamical free energy,” for the entropy production rate, (11, 12):
| [4] |
In this case, is a uniform probability distribution and o is a vector with all unit entries. The function , of course, is not a standard free energy. Rather, draws an analogy to familiar statistical mechanics. By taking the same mathematical role of the inverse temperature, β, the parameter λ sets the scale for fluctuations in . One can take the typical derivatives of with respect to λ to compute statistics of the entropy production rate, , such as the mean entropy production rate, denoted by (one derivative) and the entropy production rate susceptibility, (two derivatives).
One can show (see Supporting Information for more details) that a symmetry exists in uniformly initialized λ-ensembles such that (6). A consequence of this property is that is symmetric about . Accordingly, we choose to present the values of thermodynamic properties and probabilities only for in the main text.
One can compute time-dependent probabilities of Markov states within λ-ensembles using operators analogous to transfer matrices, as fully described in Supporting Information (11, 12). To generate the λ-biased order parameter plots shown throughout the text, we first calculate such probabilities over all states at time for (the equilibrium model) and . We then compute the so-called excess relative probability (ERP) using the following expression:
The ERP over all states in a given model is projected onto order parameters of interest, yielding the plots generated for specific systems discussed in the main text.
Kinases and GPCRs, which play central roles in cellular signal transduction, have been subjects of intense study for decades (14–16). Conducting simple equilibrium simulations of these single protein domains proved to be a huge challenge at the atomistic level, given the large system sizes and long activation timescales involved. However, recent advances in hardware, software, and sampling techniques have made millisecond-scale simulations of such biomolecules possible (17). Recently, Kohlhoff et al. (18) and Shukla et al. (19) have reported long timescale simulations of the -adrenergic receptor (β2-AR) (GPCR) and c-Src kinase (Src), respectively, that provide an equilibrium view of conformational dynamics in these key signaling systems. Simulation and MSM construction details related to these equilibrium data are included in Supporting Information and Fig. S1 (20–30). With simulations and network models in hand, what can entropy-producing trajectories tell us about these proteins’ nonequilibrium functional dynamics?
Fig. S1.

Relaxation timescale plots corresponding to the apo-Src MSM. A lag time of 5 ns was chosen owing to a “flattening” in the slowest implied (relaxation) timescales near that microscopic time interval.
Results and Discussion
Entropy Production in a Model Kinase and GPCR.
Fig. 2 illustrates the time evolution of full entropy production probability distributions in ATP-bound Src over the course of equilibration from a uniform distribution. As the plots at later times demonstrate, a broad dissipative regime, which itself contains several peaks and troughs, emerges in contradistinction to the sharp, near-equilibrium peak that dominates the neighborhood of . Later analysis based on λ-ensembles will help us characterize the trajectories that give rise to the higher levels of entropy production that appear at right in each subplot of Fig. 2. It is noteworthy, however, that distributions could represent a point of contact between our theory and biophysical experiments. Experimental efforts to confirm the fluctuation theorem, for instance, have explicitly measured distributions over dissipative work (31). A comparison of our distributions with experimental data derived for Src’s catalytic domain, if such data were possible to collect, would no doubt be useful in evaluating our results.
Fig. 2.

Probability distributions over entropy production (in natural units) during Src kinase relaxation. All horizontal scales shown are equivalent. Peaks in the rightward subplots correspond to the “dynamical phases” that appear in λ-based analysis. For reference, Src activation in this model occurs on an ∼5-μs timescale.
Fig. 3 shows the mean entropy production rate and its derivative, , for our kinase and GPCR, as a function of the scalar field λ. Each molecule has been simulated in two forms: in an apo state (with no small molecules bound) and an agonist/ATP-bound (activating ligand) state. The multiple peaks in the entropy production rate susceptibility curves speak to the nonlinearity of the dissipation we observe: from large deviation theory (see Supporting Information for more discussion), we know that peaks in susceptibilities should roughly correspond to troughs in and thus highlight transitions between subensembles of dissipative trajectories. Inspection of Fig. 2 suggests that the first slope maximum in ATP-bound Src’s rate curve (related to the first peak of ) corresponds to the transition between the near-equilibrium and dissipative regimes; the second, less dramatic maximum seems to be related to a transition between the two prominent peaks within the dissipative regime. In comparison with fully nonequilibrium systems, these crossovers are reminiscent of “dynamical phase transitions” that have been observed between different regimes of dissipation in simple, driven networks (10, 11, 32). The response function peaks we observe here only occur within transient relaxation dynamics, and thus do not represent true phase transitions in the thermodynamic limit. One might, however, expect to observe similar crossovers that persist at steady state in signaling proteins driven by an explicit flux of ATP (see further discussion below). One discerns from Fig. 3 that a simple binding of agonist molecules impacts dissipative properties. In Src, ATP-binding appears to hasten the appearance of the entropy-producing regime; the GPCR agonist only seems to amplify the entropy production in the large-λ phase. In physical terms, these observations imply that the rare, entropy-producing fluctuations seen in these systems’ dynamics become more likely upon ATP/agonist binding.
Fig. 3.

Properties of entropy production in a Src kinase and a GPCR. The mean entropy production rate and its susceptibility, , rescaled in the case of Src for purposes of visual comparison; absolute scales for upper plot limits in Src are differentiated by text color/shading. Observation times () were selected based on the longest relaxation times for each model. The mean entropy production was observed to be approximately 10 times higher in ATP-bound Src relative to its apo counterpart; the entropy production was quite similar in magnitude for both the apo and agonist (ag)-bound GPCR models. Shifts in the transient dynamical crossovers observed (demarcated by peaks in susceptibilities) suggest how agonist binding affects entropy-producing trajectories in these systems. These results are obtained from the dynamical free energy of the λ-ensemble as a function of the λ-field.
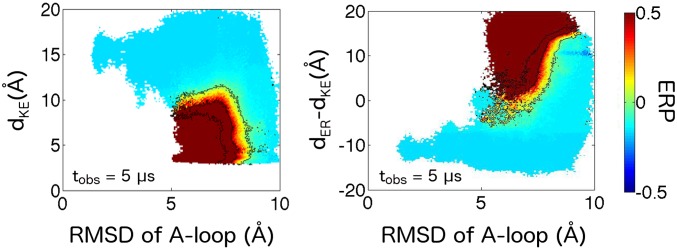
One can easily track changes in conformational state populations as a function of time under the λ bias. To study the dynamics through the lens of protein activation, we project these population shifts onto order parameters known to describe respective activation processes (19, 33–36). It is worth emphasizing, however, that the bias we apply is completely agnostic to protein structural information. Fig. 4 shows the progression of λ-ensemble simulations with respect to relevant order parameters in Src. Provocatively, the dynamics of the λ-ensemble are very well correlated with Src activation. At short observation times, probability accumulates behind the largest barrier along the activation pathway. Around 2.5 μs, the λ bias starts to push population over this barrier, and probability density begins to leak into the active region. The population shift waxes near 5 μs, at which time the kinase is being driven into its intermediate II and active basins (that are themselves separated by a low barrier at equilibrium). At longer observation times—at and beyond 10 μs—the system gently decays back to equilibrium, a necessity imposed by our detail balanced MSMs. The timescales described in this λ-ensemble–based activation compare favorably with relaxation timescales taken from the MSM. Interestingly, the trajectories that give rise to the most positive bin in Fig. 2 correspond to dynamics from the inactive state to states near the I1/I2 barrier.
Fig. 4.

Illustration of population shifts under the λ-ensemble () in ATP-bound Src. Excess relative probability (indicated by the color scale) is defined as the ratio of biased and equilibrium probabilities for a given Markov state, minus one unit. The activation pathway, shown below the order parameter plots (F), describes how the activation loop (A-loop) and C-helix change in conformation throughout the activation process (28, 29). The order parameters presented are the rmsd of the A-loop from its inactive (28) crystal conformation and the difference of distances between the highlighted side chains. Over the course of 25 μs of biased dynamics, we see that under the λ-ensemble (A) probability accumulates in , (B) density leaks over the highest barrier along the activation pathway, and (C) density is driven into the and active states, where the C-helix and A-loop are no longer in contact, before (D) the system begins to relax toward and (E) nearly reaches equilibrium. This qualitative behavior does not change as λ increases further; the extent of the observed population shifts is enhanced, however, in higher entropy-producing regimes.
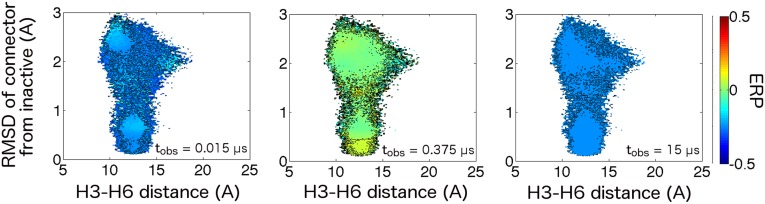
Fig. 5 illustrates the driven dynamics seen in our GPCR, projected onto the downward movement of Helix 6 and the conformational flipping of the connector residues. GPCR dynamics under the λ-ensemble also correlate well with activation. At short times, density is pushed from the inactive basin against/onto barriers corresponding to both Helix 6 and connector movements. At around 1 μs, population is driven into several intermediate states and the active basin; dynamics begin to decay back to equilibrium at longer observation times. More detailed plots of dissipative dynamics in both the kinase and the GPCR are shown in Figs. S2 and S3.
Fig. 5.

Illustration of probability shifts under the λ-ensemble in the agonist-bound GPCR. Based on the chosen order parameters, the activation pathway of the GPCR consists of downward movement in Helix 6 coupled with the conformational flipping of the connector residues (Phe381 and Ile121). Under the driving field (with the color scale again indicating the excess relative probability), (A) probability density accumulates against and (B) breaches both the Helix 6 motion and connector barriers at short timescales. Population is (C) pushed into multiple intermediate states and the active state at around 1 μs; (D) the system begins to relax back to equilibrium after several microseconds. The structural details of one prominent activation pathway are highlighted in D and E. As with Src, this qualitative activation behavior is conserved throughout the various entropy production phases we have identified.
Fig. S2.

Population shifts (excess relative probabilities) under the λ-ensemble in ATP-bound Src. Illustration of population shifts as a function of the observation time () projected onto (A) the A-loop’s (residues 404–424) rmsd from the inactive structure [Protein Data Bank (PDB): 2SRC (28)] and (B) the difference between the Glu310–Arg409 and Glu310–Lys295 distances as order parameters. These distances define the electrostatic switch that characterizes the activation of Src family kinases (28–30). The driven calculations were performed by setting λ = 1.5. (C) Two-dimensional contour plot of c-Src kinase activation from the equilibrium data projected onto the relevant order parameters. Free energy values are reported in kilocalories per mole. The landscape is obtained by summing over all Markov states contained in the 2,000-state MSM.
Fig. S3.

Population shifts (excess relative probabilities) under the λ-ensemble in -AR. Illustration of population shifts as a function of the observation time () projected onto (A) the rmsd of the connector residues (F282 and I121) from the inactive structure (PDB: 2RH1) and (B) the distance between residues Arg131 and Leu272, which characterizes the motion of Helix 6 with respect to the Helix 3. The outward motion of Helix 6 is a hallmark of the active-state structures of GPCRs. The active-state values were calculated using the PDB 3P0G and the inactive-state values using PDB 2RH1. The driven calculations were performed by setting λ = 1.5. (C) Two-dimensional contour plot of GPCR activation from the equilibrium data projected onto relevant order parameters. The free energy values are reported in kilocalories per mole. The landscape is obtained by summing over all Markov states contained in the 3,000-state MSM.
Equilibrium vs. Nonequilibrium Conformational Switches.
We have shown that important aspects of these proteins’ functional dynamics are strongly correlated with entropy-producing trajectories that appear during relaxation from nonequilibrium states. However, we have also identified conformational switches that seem to be decoupled from dissipative phenomena—suggesting they are more closely related to equilibrium conformational fluctuations. Our results (shown in Fig. S4) illustrate a prominent example of such a decoupled switch: the DFG motif in Src is largely unaffected by the λ bias. Other such “equilibrium switches” seem to include formation of the K295–E310 contact in Src (Fig. 4) and the twisting of NPXXY in our GPCR (Fig. S5). All of these processes are largely untouched by entropy-producing trajectories, meaning each faces an equilibrium barrier to activation that it must “wait” to traverse. The emergence of both equilibrium and nonequilibrium switches in these systems provides a rich view of their biological evolution. Our observations highlight the fact that the proteins we have studied become active via a combination of equilibrium fluctuations and external driving forces. Thermal motion provides access to a range of protein conformations, which in turn helps to seed rare dissipative processes that are productive from a biological activation standpoint. This duplicity should allow for different regimes of control based on factors like ligand concentration in the external field. The balance between equilibrium and nonequilibrium switches also is not necessarily optimal; how and why certain systems develop useful entropy-producing trajectories pose interesting evolutionary questions. It is important to note that our results implicitly depend on our choice of a uniform initial nonequilibrium state. One could repeat the above analysis for an arbitrary number of initial distributions (e.g., localized in the active or inactive state, or one of the observed intermediates). However, the initial conditions with true relevance to functional biology are determined in the immediate aftermath of ATP hydrolysis or the intervention of other biomolecules, processes that are difficult to access in simulations. Without explicit knowledge of what these initial distributions look like, we would argue that a uniform distribution, and its agnosticism to the location and direction of activation events, represents the most reasonable choice of initial condition. The fact that the activation picture becomes so clear from dissipative properties derived from this very general initial condition is certainly striking.
Fig. S4.

DFG dynamics in ATP-bound and ATP-free Src kinase. In ATP-bound Src (which is locked into the DFG “IN” conformation, shown at Left), fluctuations within the DFG motif do not appear to be correlated with entropy-producing trajectories. Density is weakly driven into the inactive DFG “OUT” conformation in the apo molecule, wherein the DFG residues can fluctuate freely. The DFG motif thus appears to be an “equilibrium switch” in the activation dynamics of Src, for which the molecule may simply have to “wait” to flip in and out. The calculation were performed under the λ-ensemble at a 5-μs observation time.
Fig. S5.

Alternative illustration of probability shifts under the λ-ensemble in the agonist-bound GPCR. Based on the order parameters chosen here, the activation pathway of the GPCR consists of downward movement in Helix 6 coupled with a twisting motion in the NPXXY region of Helix 7. Under the driving field, (A) probability density accumulates against and (B) breaches the Helix 6 motion barrier at short times. Population is (C) pushed into the and active states at around 1 μs; (D) the system begins to relax back to equilibrium after several microseconds. As with Src, this qualitative activation behavior is conserved throughout the various entropy production phases we have identified. (E) The equilibrium free energy landscape is included for comparison. (F) Conformations of the GPCR along the activation pathway.
In nature, the activity of signaling proteins like GPCRs and kinases is regulated either by posttranslational modification (often mediated through phosphorylation) or by the binding of other molecules (drugs, hormones, other proteins, etc.). These modifications alter the conformational dynamics of a given protein to achieve a desired up/down-regulation in its signaling pathway. In the case of kinases, both the binding of ATP and the phosphorylation of key residues (such as Tyr416 in the A-loop in c-Src) tend to enhance a system’s activity. Fig. S6 illustrates that although λ-ensemble dynamics in apo c-Src mirror the driven dynamics of the ATP-bound molecule, ATP binding serves to suppress structural fluctuations orthogonal to key activation order parameters. Furthermore, using recent equilibrium simulation data on phosphorylated and unphosphorylated c-Src, we can directly identify conformational states for which probabilities are altered upon phosphorylation (19, 37). Our results (shown in Fig. 6) demonstrate that the phosphorylation of Src enhances populations (here, excess relative probabilities) in a manner parallel to driven dynamics under the λ bias: populations of conformations with an unfolded A-loop (active) are enhanced, whereas states with a folded A-loop (inactive) lose probability.
Fig. S6.
Biased dynamics in the apo c-Src kinase. Dissipative dynamics projected onto (Left) Glu310–Lys295 distance and (Right) Glu310–Arg409 and Glu310–Lys295 distance differential order parameters at a 5-μs observation time. Apo dynamics under the λ-ensemble mirror those seen for the ATP-bound kinase, as density is driven into active- and intermediate II-equivalent states at moderate and long observation times. However, structural fluctuations (manifested in deviations orthogonal to each order parameter) are much more pronounced along the apo molecule’s driven activation pathway.
Fig. 6.

Equilibrium population shifts in ATP-bound c-Src upon autophosphorylation. (A) Changes in the probability density for A-loop conformations when Tyr416 (on the A-loop) is phosphorylated. (B) The difference between the probability densities reported in A shows that folded A-loop conformations lose population and unfolded conformations gain population upon phosphorylation. (C) Excess relative probabilities within the equilibrium phosphorylated kinase with respect to the equilibrium unphosphorylated kinase. (D) Excess relative probability estimates obtained using λ-ensemble show that states that gain population in the driven dynamics are quite similar to the states that gain population upon phosphorylation of the A-loop in the kinase. The data used in generating A–C is taken from recent computational studies on kinase activation (19, 37).
In a similar fashion, we can use equilibrium data corresponding to an apo -AR to evaluate how agonist binding tends to enhance the activity of our GPCR (18). As shown in Figs. S7 and S8, we find that states with the connector motif flipped to the active conformation and Helix 6 moved outward (close to its active configuration) gain population upon agonist binding, in parallel with data taken from the λ-ensemble. In concert, our observations indicate that the activation dynamics in these two signaling proteins are quite similar to the λ-biased dynamics, suggesting that activation events in naturally evolved systems are tightly coupled with the general phenomena of rare dissipative fluctuations and the production of entropy.
Fig. S7.
Driven dynamics in the apo -AR. Dissipative dynamics projected onto connector rmsd and Helix 3/Helix 6 distance order parameters at (Left) short, (Middle) moderate, and (Right) long observation times. Density is driven very weakly into the active region at short times, after which probability deficits become uniformly distributed among the inactive and intermediate states. Poor sampling of the active state in the equilibrium MD dataset likely contributes to the tempered nature of driven apo activation dynamics.
Fig. S8.

Equilibrium population shifts upon agonist binding to -AR. (A) Changes in the probability density of conformations of the connector region in -AR upon binding of agonist BI-167107. (B) The difference between the probability densities reported in A shows that the connector region prefers the active conformation upon agonist binding. (C) Excess relative probability of the agonist-bound -AR compared with the apo -AR. (D) Excess relative probability estimates obtained using the λ-ensemble show that states that gain population in the driven dynamics are similar to the states that gain population upon agonist binding. The data used in generating A–C are taken from a recent computational study on GPCR activation (18).
Conclusion
We have thus demonstrated that the activation dynamics of a model kinase and GPCR are well connected to irreversible, entropy-producing pathways observed in simulations. Furthermore, we have illustrated schemata by which equilibrium processes might harmonize with such dissipative trajectories to facilitate biomolecular function. As these results suggest, the marriage of MSMs with a trajectory ensemble approach opens a door to an intriguing world of nonequilibrium simulation. It is particularly interesting that dissipative fluctuations collected from equilibrium simulations align well with the unfolding/movement of activation helices and the flipping of specific activating hydrophobic contacts. This observation suggests that activation-related motifs have evolved to unfold, move, or flip with comparative ease and irreversibility, even in the absence of ATP hydrolysis/external biomolecular binding. One might, in general, be able to “pull” on such irreversible, dissipative handles left by evolution to access information about the functional cellular environment.
It is natural to aim future work at the modeling of chemically driven kinases, wherein the chemical physics of phosphorylation and dephosphorylation are treated in explicit detail. Methodology based on λ-ensembles would be particularly essential in analyzing such simulations, as no simple trajectory endpoint formulas exist for computing entropy production in the absence of detailed balance. Simulating phosphorylation/dephosphorylation cycles would necessarily include driven phases, in which phosphate/phosphoresidue bonds are actively broken, and passive phases in which the newly altered kinase relaxes back to a distinct equilibrium fixed point. In this work, we have analyzed exactly such secondary relaxation processes, albeit starting from distributions different from those that bond scission would create. Combining clever nonequilibrium methods with various simulation approaches, we eventually might circumvent the need to simulate full in vivo environments—allowing us to study the driven physics of life in piecewise detail. Using equilibrium simulation alone, dissipative physics has given us insight into both biological function and evolutionary design in kinases and GPCRs, hinting at the governing dynamics behind wide swaths of human disease pathology. Prospects for further application, accordingly, are bright.
As indicated in the main text, this supplement provides a detailed description of entropy production distribution generation, λ-ensemble theory, equilibrium simulation, and MSM construction details, and eight supplemental figures.
Entropy Production Distributions from Dynamics That Obey Detailed Balance
Generally speaking, to compute full distributions over the entropy production in a given system, one must analyze all of its possible trajectories at all time points of a given observation interval. For dynamics that violate detailed balance, this type of analysis quickly becomes intractable in systems with nontrivial spatial and time constraints. However, in dynamics that obey detailed balance, the dissipative properties of a trajectory can be fully determined by its beginning and end points, as the following derivation demonstrates. As indicated in the main text, the entropy production, , corresponding to a trajectory of length is computed using that trajectory’s forward and reverse probabilities:
In the language of Markov chains, one can express the forward probability of an arbitrary trajectory x as follows:
and its reverse probability as follows:
where the conditional probabilities are determined by the Markov chain’s transition probability matrix, :
The detailed balance condition for transition probabilities can be stated as follows:
where is the equilibrium distribution for the Markov chain. Assuming this condition holds, the ratio of forward and reverse probabilities then reduces to the following:
Under the additional assumption of an initial uniform distribution (which we make in all of the calculations presented in this paper), we thus find that
Enumerating all possible trajectories according to their endpoints is a relatively easy task in models with states; by computing and binning for all such trajectories, one can generate data like that shown in Fig. 2 of the main text.
Foundation of the λ-Ensemble
Under the λ-ensemble, we aim to constrain the entropy production rates of trajectories observed within a dynamical process. We do so by defining and analyzing a constrained probability distribution over . For reasons related to the Crooks fluctuation theorem (7), we understand that should obey a large deviation principle—that is, the probability of observing a given should decay exponentially with (6). Introducing an auxiliary variable λ which controls this rate of decay, we can write down the probability of a trajectory within our new λ-ensemble:
Here, refers to the unbiased probability of trajectory x, and represents the partition function, or normalization constant, for the ensemble.
If one builds a discrete Markov model for dynamics in a system of interest, one can leverage the memoryless property to define probabilities for trajectories of unit length. Suppose one’s N-state Markov model includes an transition probability matrix, . Elements of that matrix describe the probability of moving from state i to state j in a given discrete lag time, τ. The probability corresponding to the reverse of the trajectory, of course, is simply . In this analysis, we will focus on an initial uniform distribution over Markov states. Plugging these transition probabilities into the expression for , and assuming a uniform initial state, one finds that (9, 10)
We call the matrix the “tilted” transition matrix for the λ-ensemble. Calculating the partition function requires summing over all possible exponential weights on , for trajectories of some length . With our tilted matrix in hand, we can complete this sum using transfer matrix theory (11, 12):
Here, π is chosen to be an initial uniform probability distribution; in general, however, π can be set to any initial probability distribution, provided that fidelity to the fluctuation theorem can be proven. For the ket portion of the matrix element, o represents a vector with all unit entries. We thus arrive at our expression for the dynamical free energy for entropy production rate, :
where . This dynamical free energy represents the cumulant generating function for the λ-ensemble over entropy production rates. Under the assumption of fidelity to a large deviation principle, is mathematically related to the exponent (i.e., the so-called large deviation rate function) of the full distribution via a Legendre–Fenchel transform (6). This fact quantitatively explains the apparent relationships between the properties of and derivatives of discussed in the main text. We obtain the mean entropy production rate, , by taking one derivative of :
and the entropy production rate susceptibility, , by taking two derivatives:
One can show that a symmetry exists in the λ-ensemble such that (6); derivation of this result here relies on the minor added caveat of a uniform initial distribution over states. The symmetry about , however, can also be easily verified through numerical calculations. This symmetry directly implies the entropy production fluctuation theorem mentioned above (6). One consequence of this property is that is symmetric about . Accordingly, we choose to present the values of cumulants only for in the main text.
To compute time-dependent probabilities of Markov states within the λ-ensemble, one observes that the probability of a single trajectory can be decomposed into a product of tilted matrix elements (11, 12):
In this expression, is an element of , and is the equilibrium probability of being in a Markov state X. Within the λ-ensemble comprised of trajectories of length , the probability of occupying a state X at some time is calculated by summing over all trajectories that arrive at X at time t. To complete this sum, we again revisit the transfer matrix formalism (11, 12):
Here, we have introduced a projection matrix, , which contains all zero entries apart from one unique diagonal element, which is set to .
To generate the order parameter plots shown in the main text, we first calculate such probabilities over all states at time for (the equilibrium model) and . We then compute the excess relative probability (ERP) using the following expression:
The ERP over all states in a given model is projected onto order parameters of interest, yielding the plots shown in Figs. 2 and 3, and the extended data figures (Figs. S2–S8).
As noted previously, all MSMs analyzed here have been subjected to the constraint of detailed balance: , i, j. It follows directly that the steady-state entropy production for these models, at any value of λ, is zero. This relationship explains why our driven systems, independent of choice of initial condition, relax back to equilibrium at long observation times: one cannot construct “extensive” (i.e., periodic) entropy-producing trajectories in a detail balanced system. The above theory can be somewhat simplified in the ergodic limit for systems that do exhibit steady-state dissipation; because we can only consider finite-time entropy currents derived from initial nonequilibrium states, however, the full time-dependent formalism is necessary (and, additionally, proves useful for analyzing activation pathways in signaling proteins).
As mentioned in the main text, we say crossovers resembling “dynamical phase transitions” occur when we observe a maximum in the entropy production rate susceptibility, , as a function of the driving field, λ. Whether these crossovers correlate with dynamical phase transitions in the steady-state dissipation of protein systems, however, remains an open question. Based on previous work in glassy systems, one would expect such phase transitions to be first-order–like in the thermodynamic limit: that is, when and , a divergence should appear in the mean entropy production rate. Due to the limitations of classical simulation (and the fixed size of protein machines of interest), however, one generally cannot consider the portion of the thermodynamic limit for these signaling proteins’ cyclic, steady-state activation/deactivation dynamics. At present, we simply observe inflection points in entropy production curves that represent crossovers between distinct regimes of dissipation seen during relaxation from a particular nonequilibrium state.
Although we draw an analogy between nanoscale protein machines and heat engines in the main text, an interesting question concerns what work signaling proteins actually perform on their surroundings. Signaling proteins, of course, play no role in directing locomotion of cellular components or catalyzing chemical transformations. Rather, by maintaining a given conformation and/or phosphorylation state, signaling proteins transduce messages to other regions of a cell. This transmission of information itself constitutes thermodynamic work, from an information theoretic point of view; this idea is well developed in literature surrounding the resolution of the apparent Maxwell’s Demon paradox. The “meaningful” work a signaling protein performs, therefore, entails reaching and maintaining its active state, and the dissipation that results from driving this transformation seems to correlate well with signaling functions.
Apo c-Src Simulation Details.
Distributed molecular dynamics (MD) simulations were performed using GROMACS (20) on the Folding@home (21) computing platform. The AMBER99sb-ILDN (22) force field was used for protein and ligands along with TIP3P (23) water model. The all-atom structures were solvated in a cubic solvent box constructed from a 80 80 80-Å3 cube with TIP3P water molecules placed such that water extended at least 10 Å away from the surface of the protein; 22 Na+ ions and 19 Cl− ions were added to the system to neutralize the charge, corresponding to the physiological salt concentration of ∼150 mM. Covalent bonds involving hydrogen atoms were constrained with LINCS (24), and particle mesh Ewald (25) was used to treat long-range electrostatic interactions. The structures obtained after an initial equilibration for 1 ns at constant temperature and pressure and with constraints on the heavy atom positions were used as the starting conformation for the distributed MD simulations. Production MD simulations were carried out at constant temperature and pressure of 300 K and 1 atm, respectively, with a time step of 2 fs. Simulations were started using the initial structures taken from the recent study by Shukla et al. (19) on conformational states of ATP-bound c-Src by removing the ATP and Mg2+ ions. A set of 23,000 simulations were started from the 1,797 snapshots for an aggregate simulation time of 350 μs on the Folding@home platform. Trajectory snapshots were recorded every 100 ps.
Apo c-Src MSM Construction Details.
MSMs provide a map of a molecule’s free energy landscape; in some sense, an MSM provides a reduced view of the ensemble of spontaneous fluctuations the molecule undergoes at equilibrium (4). The MSM building procedure involves the clustering of simulation snapshots into states based on their similarity in terms of a given metric. The transitions between these states are then counted to get an initial estimate of the transition probability matrix, . A maximum-likelihood estimate of the transition probability matrix is next obtained to yield final transition probabilities that designate the equilibrium populations of states (5). The MSMBuilder software was used to build MSMs of the conformational landscape of apo c-Src tyrosine kinase (26). Conformations were clustered using a hybrid metric involving the sum of the distances between residue pairs Lys295–Glu310, Glu310–Arg409, Lys295–Asp404, and Phe405–Leu315. This combination of residues was chosen due to its past success as a metric for characterizing transitions in the tyrosine kinases c-Src and c-Abl (27). The final 2,000-state model for apo c-Src provided a good balance between state connectivity and adequate transition sampling. The model also provided converged implied timescales as a function of lag time, which is used as a measure of the Markovian nature of the model. A lag time of τ = 5 ns was determined to be suitable by building a series of MSMs at different lag times to find a region in which the spectrum of relaxation timescales are relatively insensitive to lag time.
Other Simulation Datasets and MSMs.
Simulation data and the MSM for ATP-bound Src were taken from our recent work on activation of c-Src (19). Meng and Roux (37) performed umbrella sampling simulations of c-Src with a phosphorylated Y416 to study how phosphorylation locks the c-Src kinase in active state. We have used these data to estimate the excess relative probability within the phosphorylated kinase compared with the unphosphorylated kinase. Similarly, Kohlhoff et al. (18) have recently shown how ligands modulate activation pathways of GPCRs. We have used their simulation data and MSMs of apo and agonist-bound -AR in λ-ensemble calculations.
Acknowledgments
We thank the users of the Folding@Home distributed computing project who donated compute time used for simulations. We thank the National Science Foundation (Grant MCB-0954714) and NIH (Grant R01-GM062868) for their support of this work. This work was funded in parts by the Simbios NIH National Center for Biomedical Computation through NIH Roadmap for Medical Research Grant U54 GM07297. J.K.W. was supported by the Fannie and John Hertz Foundation on the Endowed Professor Yaser S. Abu-Mostafa Fellowship. D.S. was supported by the Biomedical Data Science Initiative Postdoc Scholar Program of Stanford School of Medicine.
Footnotes
The authors declare no conflict of interest.
This article is a PNAS Direct Submission.
This article contains supporting information online at www.pnas.org/lookup/suppl/doi:10.1073/pnas.1501804112/-/DCSupplemental.
References
- 1.Rosenbaum DM, Rasmussen SG, Kobilka BK. The structure and function of G-protein-coupled receptors. Nature. 2009;459(7245):356–363. doi: 10.1038/nature08144. [DOI] [PMC free article] [PubMed] [Google Scholar]
- 2.Taylor SS, Kornev AP. Protein kinases: Evolution of dynamic regulatory proteins. Trends Biochem Sci. 2011;36(2):65–77. doi: 10.1016/j.tibs.2010.09.006. [DOI] [PMC free article] [PubMed] [Google Scholar]
- 3.England JL. Statistical physics of self-replication. J Chem Phys. 2013;139(12):121923. doi: 10.1063/1.4818538. [DOI] [PubMed] [Google Scholar]
- 4.Bowman GR, Pande VS. Protein folded states are kinetic hubs. Proc Natl Acad Sci USA. 2010;107(24):10890–10895. doi: 10.1073/pnas.1003962107. [DOI] [PMC free article] [PubMed] [Google Scholar]
- 5.Pande VS, Beauchamp K, Bowman GR. Everything you wanted to know about Markov state models but were afraid to ask. Methods. 2010;52(1):99–105. doi: 10.1016/j.ymeth.2010.06.002. [DOI] [PMC free article] [PubMed] [Google Scholar]
- 6.Touchette H. The large deviation approach to statistical mechanics. Phys Rep. 2009;478(1-3):1–69. [Google Scholar]
- 7.Crooks GE. Path-ensemble averages in systems driven far from equilibrium. Phys Rev E Stat Phys Plasmas Fluids Relat Interdiscip Topics. 2000;61:2361–2366. [Google Scholar]
- 8.Jarzynski C. Nonequilibrium equality for free energy differences. Phys Rev Lett. 1997;78:2690–2693. [Google Scholar]
- 9.Lebowitz JL, Spohn H. A Gallavotti–Cohen-type symmetry in the large deviation functional for stochastic dynamics. J Stat Phys. 1999;95:333–365. [Google Scholar]
- 10.Vaikuntanathan S, Gingrich TR, Geissler PL. Dynamic phase transitions in simple driven kinetic networks. Phys Rev E Stat Nonlin Soft Matter Phys. 2014;89(6):062108. doi: 10.1103/PhysRevE.89.062108. [DOI] [PubMed] [Google Scholar]
- 11.Garrahan JP, et al. Dynamical first-order phase transition in kinetically constrained models of glasses. Phys Rev Lett. 2007;98(19):195702. doi: 10.1103/PhysRevLett.98.195702. [DOI] [PubMed] [Google Scholar]
- 12.Jack RL, Sollich P. Large deviations and ensembles of trajectories in stochastic models. Prog Theor Phys Suppl. 2010;184:304–317. [Google Scholar]
- 13.Weber JK, Jack RL, Schwantes CR, Pande VS. Dynamical phase transitions reveal amyloid-like states on protein folding landscapes. Biophys J. 2014;107(4):974–982. doi: 10.1016/j.bpj.2014.06.046. [DOI] [PMC free article] [PubMed] [Google Scholar]
- 14.Aleshin A, Finn RS. SRC: A century of science brought to the clinic. Neoplasia. 2010;12(8):599–607. doi: 10.1593/neo.10328. [DOI] [PMC free article] [PubMed] [Google Scholar]
- 15.Blume-Jensen P, Hunter T. Oncogenic kinase signalling. Nature. 2001;411(6835):355–365. doi: 10.1038/35077225. [DOI] [PubMed] [Google Scholar]
- 16.Lefkowitz RJ. Historical review: A brief history and personal retrospective of seven-transmembrane receptors. Trends Pharmacol Sci. 2004;25(8):413–422. doi: 10.1016/j.tips.2004.06.006. [DOI] [PubMed] [Google Scholar]
- 17.Lane TJ, Shukla D, Beauchamp KA, Pande VS. To milliseconds and beyond: Challenges in the simulation of protein folding. Curr Opin Struct Biol. 2013;23(1):58–65. doi: 10.1016/j.sbi.2012.11.002. [DOI] [PMC free article] [PubMed] [Google Scholar]
- 18.Kohlhoff KJ, et al. Cloud-based simulations on Google Exacycle reveal ligand modulation of GPCR activation pathways. Nat Chem. 2014;6(1):15–21. doi: 10.1038/nchem.1821. [DOI] [PMC free article] [PubMed] [Google Scholar]
- 19.Shukla D, Meng Y, Roux B, Pande VS. Activation pathway of Src kinase reveals intermediate states as targets for drug design. Nat Commun. 2014;5:3397. doi: 10.1038/ncomms4397. [DOI] [PMC free article] [PubMed] [Google Scholar]
- 20.Hess B, Kutzner C, van der Spoel D, Lindahl E. Gromacs 4: Algorithms for highly efficient, load-balanced, and scalable molecular simulation. J Chem Theory Comput. 2008;4:435–447. doi: 10.1021/ct700301q. [DOI] [PubMed] [Google Scholar]
- 21.Shirts M, Pande VS. Screen savers of the world unite! Science. 2000;290(5498):1903–1904. doi: 10.1126/science.290.5498.1903. [DOI] [PubMed] [Google Scholar]
- 22.Lindorff-Larsen K, et al. Improved side-chain torsion potentials for the Amber ff99SB protein force field. Proteins. 2010;78(8):1950–1958. doi: 10.1002/prot.22711. [DOI] [PMC free article] [PubMed] [Google Scholar]
- 23.Jorgensen W, Chandrasekhar J, Madura J, Impey R, Klein M. Comparison of simple potential functions for simulating liquid water. J Chem Phys. 1983;79:926. [Google Scholar]
- 24.Hess B, Bekker H, Berendsen H, Fraaije J. Lincs: A linear constraint solver for molecular simulations. J Comput Chem. 1997;18:1463–1472. [Google Scholar]
- 25.Darden T, York D, Pedersen L. Particle mesh ewald: An nlog (n) method for ewald sums in large systems. J Chem Phys. 1993;98:10089. [Google Scholar]
- 26.Beauchamp KA, et al. Msmbuilder2: Modeling conformational dynamics on the picosecond to millisecond scale. J Chem Theory Comput. 2011;7(10):3412–3419. doi: 10.1021/ct200463m. [DOI] [PMC free article] [PubMed] [Google Scholar]
- 27.Lovera S, et al. The different flexibility of c-Src and c-Abl kinases regulates the accessibility of a druggable inactive conformation. J Am Chem Soc. 2012;134(5):2496–2499. doi: 10.1021/ja210751t. [DOI] [PubMed] [Google Scholar]
- 28.Xu W, Doshi A, Lei M, Eck MJ, Harrison SC. Crystal structures of c-Src reveal features of its autoinhibitory mechanism. Mol Cell. 1999;3(5):629–638. doi: 10.1016/s1097-2765(00)80356-1. [DOI] [PubMed] [Google Scholar]
- 29.Cowan-Jacob SW, et al. The crystal structure of a c-Src complex in an active conformation suggests possible steps in c-Src activation. Structure. 2005;13(6):861–871. doi: 10.1016/j.str.2005.03.012. [DOI] [PubMed] [Google Scholar]
- 30.Ozkirimli E, Yadav SS, Miller WT, Post CB. An electrostatic network and long-range regulation of Src kinases. Protein Sci. 2008;17(11):1871–1880. doi: 10.1110/ps.037457.108. [DOI] [PMC free article] [PubMed] [Google Scholar]
- 31.Collin D, et al. Verification of the Crooks fluctuation theorem and recovery of RNA folding free energies. Nature. 2005;437(7056):231–234. doi: 10.1038/nature04061. [DOI] [PMC free article] [PubMed] [Google Scholar]
- 32.Hedges LO, Jack RL, Garrahan JP, Chandler D. Dynamic order-disorder in atomistic models of structural glass formers. Science. 2009;323(5919):1309–1313. doi: 10.1126/science.1166665. [DOI] [PubMed] [Google Scholar]
- 33.Cherezov V, et al. High-resolution crystal structure of an engineered human β2-adrenergic G protein-coupled receptor. Science. 2007;318(5854):1258–1265. doi: 10.1126/science.1150577. [DOI] [PMC free article] [PubMed] [Google Scholar]
- 34.Rasmussen SG, et al. Structure of a nanobody-stabilized active state of the β2 adrenoceptor. Nature. 2011;469(7329):175–180. doi: 10.1038/nature09648. [DOI] [PMC free article] [PubMed] [Google Scholar]
- 35.Weis WI, Kobilka BK. Structural insights into G-protein-coupled receptor activation. Curr Opin Struct Biol. 2008;18(6):734–740. doi: 10.1016/j.sbi.2008.09.010. [DOI] [PMC free article] [PubMed] [Google Scholar]
- 36.Taylor SS, Ilouz R, Zhang P, Kornev AP. Assembly of allosteric macromolecular switches: Lessons from PKA. Nat Rev Mol Cell Biol. 2012;13(10):646–658. doi: 10.1038/nrm3432. [DOI] [PMC free article] [PubMed] [Google Scholar]
- 37.Meng Y, Roux B. Locking the active conformation of c-Src kinase through the phosphorylation of the activation loop. J Mol Biol. 2014;426(2):423–435. doi: 10.1016/j.jmb.2013.10.001. [DOI] [PMC free article] [PubMed] [Google Scholar]