Significance
Materials constructed with metal nanoparticles interact strongly with light, enabling functions such as tunable color, molecular sensors, and light-based electronics. These materials, however, are often imperfect; nanoparticles vary in their size, shape, and surface morphology, which can affect the quality of their arrangement as well as their properties. We use DNA to synthesize precisely controlled crystalline arrangements of gold nanoparticles and survey how a variety of structural inhomogeneities affects their optical properties. The results reported herein identify specific metal nanoparticle-based materials whose optical properties are either sensitive or insensitive to inhomogeneity.
Keywords: nanoparticle, noble metal, plasmonics, DNA, disorder
Abstract
Bottom-up assemblies of plasmonic nanoparticles exhibit unique optical effects such as tunable reflection, optical cavity modes, and tunable photonic resonances. Here, we compare detailed simulations with experiment to explore the effect of structural inhomogeneity on the optical response in DNA-gold nanoparticle superlattices. In particular, we explore the effect of background environment, nanoparticle polydispersity (>10%), and variation in nanoparticle placement (∼5%). At volume fractions less than 20% Au, the optical response is insensitive to particle size, defects, and inhomogeneity in the superlattice. At elevated volume fractions (20% and 25%), structures incorporating different sized nanoparticles (10-, 20-, and 40-nm diameter) each exhibit distinct far-field extinction and near-field properties. These optical properties are most pronounced in lattices with larger particles, which at fixed volume fraction have greater plasmonic coupling than those with smaller particles. Moreover, the incorporation of experimentally informed inhomogeneity leads to variation in far-field extinction and inconsistent electric-field intensities throughout the lattice, demonstrating that volume fraction is not sufficient to describe the optical properties of such structures. These data have important implications for understanding the role of particle and lattice inhomogeneity in determining the properties of plasmonic nanoparticle lattices with deliberately designed optical properties.
The rational arrangement of nanoparticles in multiple dimensions is a promising means for creating materials with novel properties not found in nature. Noble metal nanoparticles are interesting material building blocks due to their ability to amplify local fields by orders of magnitude and scatter light well below the diffraction limit. These efficient interactions with visible light are due to localized surface plasmon resonances (LSPRs), the collective oscillation of conduction electrons (1). Hierarchical arrangements of plasmonic nanoparticles have become the basis for colorimetric sensors (2, 3), subdiffraction limited waveguides (4), visible light metamaterials (5), and nanoscale lasing devices (6, 7), and the ability to adjust architecture in such materials has led to a wide variety of structures with tunable and unusual optical properties (8–12). Many of these technologies leverage the scalability and modularity of bottom-up assembly techniques, which use chemically synthesized colloidal nanoparticles as building blocks (13, 14). Unfortunately, all nanoparticle assembly techniques result in materials with structural defects across multiple length scales, including imprecise particle placement, grain boundaries, and variation in crystallite size. In addition, the nanoparticles used in these systems are inherently inhomogeneous: varying in size, shape, and radius of curvature. Although the effects of inhomogeneity have been investigated at the individual nanoparticle level (15, 16), the effects of inhomogeneity on plasmonic assemblies are not as well understood. Determining the defect resilience of emergent properties is crucial for the continued development of scalable nanomaterial devices with reproducible properties. At this point, a comprehensive understanding of how structural defects contribute to the optical response does not exist.
Herein, we combine structural and optical characterization with a variety of theoretical techniques to investigate structural inhomogeneities that affect the optical properties of hierarchical plasmonic assemblies. These factors include the chemical environment of the structure, the inhomogeneity of the nanoparticle building blocks, and the displacement of nanoparticles within the lattice. We use the programmability of DNA (3, 17–22) to construct body-centered cubic (bcc) thin-film plasmonic superlattices comprising nanospheres with diameters of 10, 20, and 40 nm. We compare the optical response of these superlattices with two types of simulations: (i) Fresnel thin-film simulations based solely on volume fraction that closely mimic the experimental geometry, and (ii) rigorous electrodynamics simulations that explicitly describe structural inhomogeneities of the crystalline superlattice. In doing so, we determine that volume fraction accurately describes the plasmonic superlattices comprising plasmonic building blocks spaced at least a diameter apart, i.e., when their interactions are primarily dipolar. At volume fractions of 20% Au and above (when the particles are within a diameter), the plasmonic properties vary depending on the nanoparticle building block size. In the far field, changes in plasmonic coupling primarily result in red-shifted collective resonances. In the near field, however, simulations suggest that both nanoparticle inhomogeneity and disorder in the superlattice arrangement alter the electric-field intensity throughout the lattice. These data suggest that the plasmonic properties of elevated volume fraction superlattices are dependent on both nanoparticle size and crystal symmetry, providing a powerful means for fine-tuning the optical response.
Results
As a model system for the study of plasmonic nanoparticle superlattices, we use DNA as a programmable ligand for assembly. It has been shown that nanoparticles that are densely functionalized with DNA act as programmable atom equivalents (PAEs) that assemble into 3D crystalline superlattices where the interparticle spacing, lattice symmetry, and nanoparticle size can all be precisely controlled (23). Layer-by-layer assembled thin-film superlattices are particularly useful for studying structure–function relationships because they enable wide area measurements, programmed sample thicknesses, and the comparison of isostructural structures in solution with those stabilized in the solid state. Here, 10-, 20-, and 40-nm diameter Au nanoparticles are used to form bcc-type superlattices using an A-type, B-type layer-by-layer assembly method described previously (Fig. 1A, Supporting Information, and Table S1) (22). Using grazing incidence small-angle X-ray scattering (GISAXS), the interparticle spacing and crystal quality can be determined quantitatively; Table 1 lists the nanoparticle size, lattice parameter, nearest-neighbor distance (surface-to-surface), volume fraction, and film thickness of the superlattices probed in this work (Fig. S1 plots the 2D GISAXS scattering). Importantly, superlattices that are transferred to the solid state (encased in silica) exhibit minimal perturbation of the lattice as confirmed by GISAXS (Fig. 1C solution [solid lines], solid state [dashed lines]) and with electron microscopy (Fig. 1B) (24).
Fig. 1.
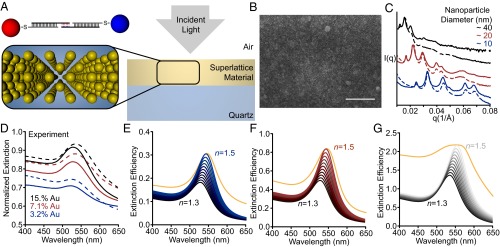
Optical properties of DNA-assembled plasmonic thin films. (A) Scheme of the A-B–type assembly system (Top Left) within the experimental measurement geometry (Right). (B) A representative scanning electron micrograph (top-down view; scale bar, 100 nm). (C) GISAXS linecuts for solution (solid lines) and silica-embedded (dashed lines) bcc superlattices comprising 40-nm (black), 20-nm (red), and 10-nm (blue) nanoparticle building blocks. (D) Experimental extinction measurements of the thin-film superlattices from C in solution (solid lines) and in silica (dashed lines). Generalized Mie simulations of superlattices comprising10-nm (blue, E), 20-nm (red, F), and 40-nm (black, G)-diameter nanoparticle building blocks, respectively. In the simulations, the background refractive increases from 1.3 to 1.5 in 0.02 increments. Effective medium simulations with identical structural parameters are included for comparison (orange traces, n = 1.5). All structures were simulated as ideal lattices according to the structural information gathered from GISAXS (Table 1).
Table S1.
DNA sequences used in this work
| Strand | Description | Sequence |
| Thiolated strands | ||
| 1 | AuNP-bound strand | 5′TCC ACT CAT ACT CAG CAA Sp18 SH 3′ |
| 2 | AuNP-bound strand | 5′TCA ACT ATT CCT ACC TAC Sp18 SH 3′ |
| 3 | AuNP-bound strand | 5′TCC ACT CAT ACT CAG CAA (Sp18)5 SH 3′ |
| 4 | AuNP-bound strand | 5′TCA ACT ATT CCT ACC TAC (Sp18)5 SH 3′ |
| 5 | AuNP-bound strand | 5′TCC ACT CAT ACT CAG CAA (Sp18)10 SH 3′ |
| 6 | AuNP-bound strand | 5′TCA ACT ATT CCT ACC TAC (Sp18)10 SH 3′ |
| Linker strands | ||
| 3 | bcc linker for 1,3,5 | 5′TTG CTG AGT ATG AGT GGA Sp18 AAGGAAA 3′ |
| 4 | bcc linker for 2,4,6 | 5′GTA GGT AGG AAT AGT TGA Sp18 TTTCCTT 3′ |
Sp18 is a commercially available hexaethyleneglycol phosphate spacer available from Glen Research.
Table 1.
Superlattice structural parameters extracted from GISAXS characterization
| Particle diameter, nm | Lattice constant, nm | Gap, nm | Volume fraction, % Au | Thickness, nm |
| 8.9 | 28.4 | 15.7 | 3.2 | 56.8 |
| 19.8 | 48.5 | 22.2 | 7.1 | 97.0 |
| 39.1 | 73.7 | 24.7 | 15.6 | 147.4 |
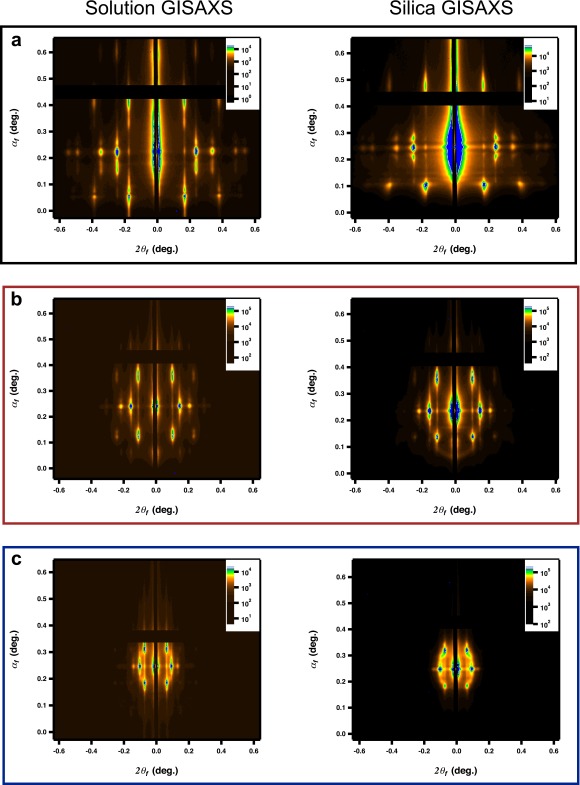
Fig. S1.
GISAXS for thin-film superlattices. Two-dimensional scattering patterns for thin-film superlattices. (A) Superlattice synthesized using 10-nm nanoparticle building blocks: (Left) solution; (Right) silica-embedded. (B) Superlattice synthesized using 20-nm nanoparticle building blocks: (Left) solution; (Right) silica-embedded. (C) Superlattice synthesized using 40-nm nanoparticle building blocks: (Left) solution; (Right) silica-embedded.
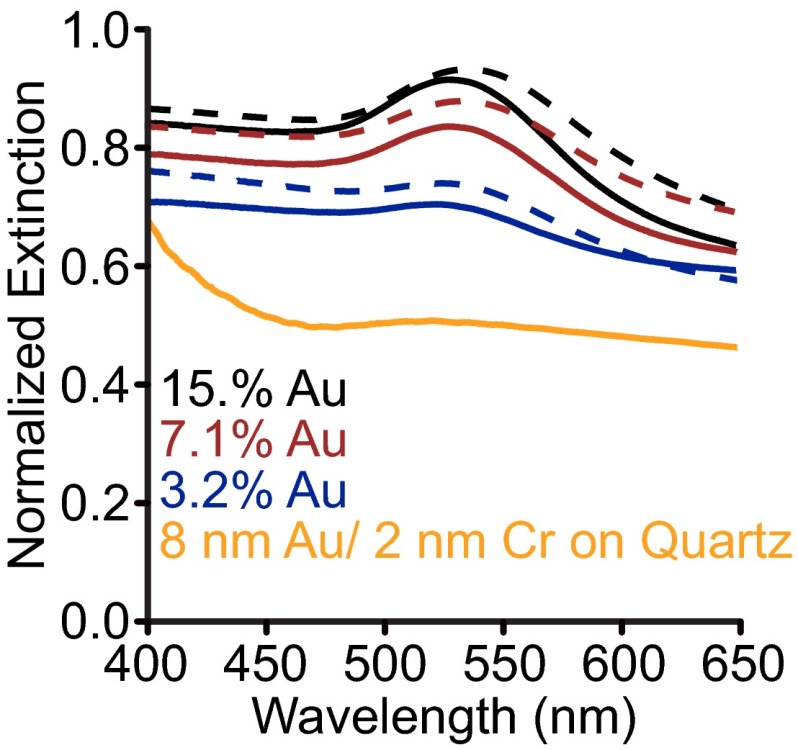
To probe the effect of background environment on the optical properties, we compare the extinction of isostructural superlattices in solution with those in the solid state (silica embedded). Fig. 1D compares the far-field extinction of the as-synthesized superlattices in solution (solid lines, approximately n = 1.33, ε = 1.77) with those stabilized in silica (dashed lines, approximately n = 1.40, ε = 1.96). Spectra were normalized by transmission through a glass slide; notably, the evaporated gold layer (2 nm Cr, 8 nm Au) that the films are grown on contributes minimally to the optical response (Fig. S2). For all superlattices measured (listed in Table 1), the solid-state extinction spectra are red-shifted and at a higher intensity than the analogous superlattices in solution. This observation can be qualitatively understood through the relationship between the extinction efficiency and the background dielectric medium for a quasi-static (small size limit) sphere (25, 26):
| [1] |
where a is the sphere radius, εm is the dielectric constant for the background medium, and ε1 and ε2 are the real and imaginary values of the permittivity (at this wavelength), respectively. Eq. 1 describes the dominant dipole LSPR observed in small metal nanoparticles; it also states that the LSPR occurs when ε1 = −2εm. In elevated refractive indices, the wavelength necessary to achieve the resonance condition ε1/εm = −2 is longer, red-shifting the resonance (as seen in the experiment) (1, 25, 26). It can also be derived from Eq. 1 that Au is a “higher-quality material” in elevated dielectric constant media (i.e., when the LSPR is red-shifted) (27). The result of this is a material with a higher relative extinction efficiency (i.e., extinction coefficient). Thus, the red-shift and increase in extinction intensity of isostructural superlattices in solution and in silica can be understood qualitatively using Mie theory.
Fig. S2.
Extinction by 8-nm Au, 2-nm Cr film on quartz (orange trace). The black, red, and blue traces are a reproduction of those shown in Fig. 1 (main text), compared with the extinction by the 8-nm Au, 2-nm Cr film deposited on the quartz. The rise in extinction blue of 450 nm by the film is primarily due to interband absorption transitions in the Au film.
The rigorous comparison of simulation with experiment provides a powerful means for understanding those factors that affect the optical response of plasmonic materials. Here, we compare experimental extinction measurements with two types of simulations: (i) Maxwell–Garnett effective medium theory (EMT) and (ii) discrete nanoparticle electrodynamics simulations (ED). In EMT (28, 29), the superlattice is described as a sum of its constituent building blocks (e.g., 10% Au particles, 90% water). This effective material is then input into the Fresnel equations to determine the transmission, reflection, and absorption of an infinite thin film (Fig. S3). In ED simulations, a discrete lattice of nanoparticles is built in a homogeneous background, and Maxwell’s equations are solved for all of the interactions between particles (1). Differences between EMT and ED signify the presence of strong, nonlinear plasmonic coupling, i.e., the point at which the fine structure of the lattice determines the optical response. More details on the simulation methods can be found in the Supporting Information.
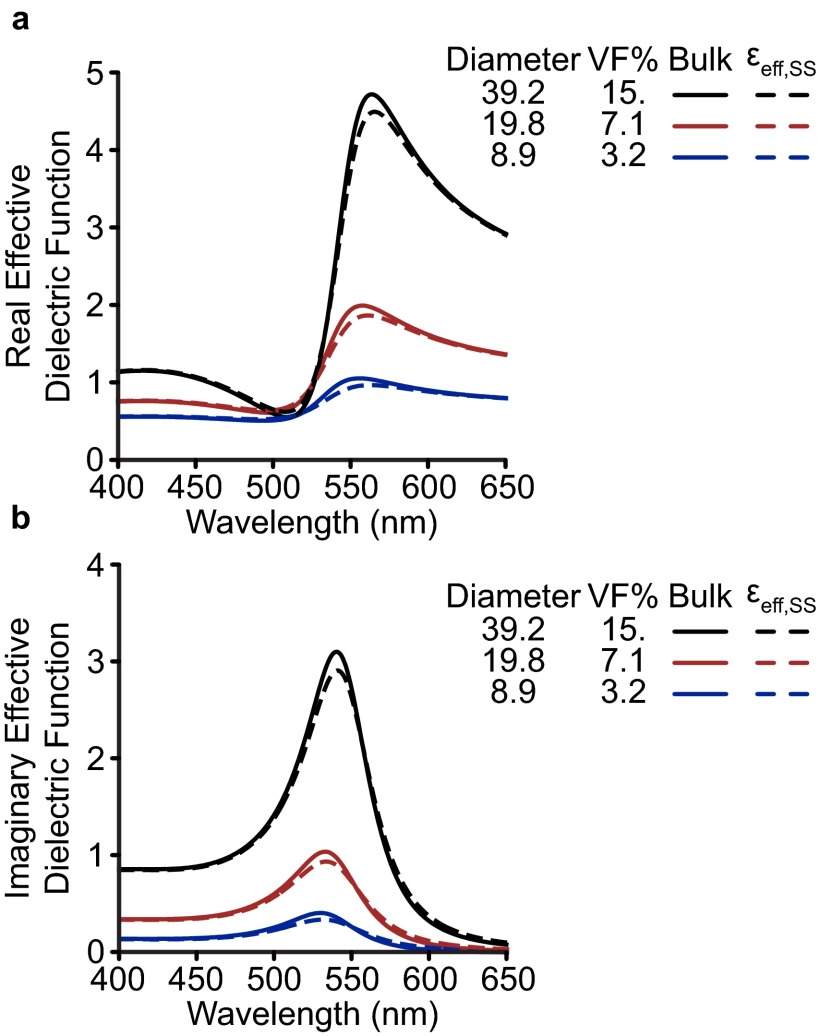
Fig. S3.
Effective material properties of plasmonic superlattices. Real (A) and imaginary (B) effective dielectric functions εeff for superlattices with varying volume fraction. Dashed lines represent εeff including surface scattering that was determined using the size of the constituent spheres. For EMT, only the Au volume fraction is used as input; sphere sizes are provided only as a reference to the superlattice studied (Table 1, main text). εeff is easily related to the refractive index via where μ = 1. Here, Im{εeff} represents absorption by the material, which dominates LSPR extinction in the small-particle quasi-static limit (main text). Re{εeff} signifies the concentration of electric flux; in thin films it contributes minimally to extinction, although in larger systems on the order of the wavelength of light it controls the photonic properties of the crystal.
Both Fresnel-EMT simulations and ED simulations (Fig. 1 E–G and Fig. S4) reveal a red-shift and increase in extinction intensity with increasing background index, reproducing the optical response observed in the experiments. This reproduction with Fresnel-EMT confirms that the interparticle interactions in these systems are weak dipole–dipole interactions that are well described solely by volume fraction (EMT). Notably, at elevated volume fraction (and larger nanoparticles, ∼40-nm diameter), the extinction predicted by the Fresnel-EMT model begins to saturate (Fig. 1 E–G, orange traces, and Fig. S4), whereas the classical ED methods reproduce the characteristic Lorentzian lineshape of the experimental LSPR accurately (Fig. 1). This suggests that the Fresnel-EMT model does not perfectly describe thin-film plasmonic superlattices at high volume fraction or above a certain nanoparticle size. Moreover, the variation in predicted LSPR maximum between the experimental data and the simulations is present both for the simple Fresnel-EMT model and the more rigorous ED methods (Fig. S5). These differences could be due to variable silica porosity, which would change the dielectric background, but they could also be due to inhomogeneity of the superlattice. To better understand how structural inhomogeneity affects the plasmonic response, it is necessary to incorporate experimentally relevant defect structures within the ED simulations.
Fig. S4.
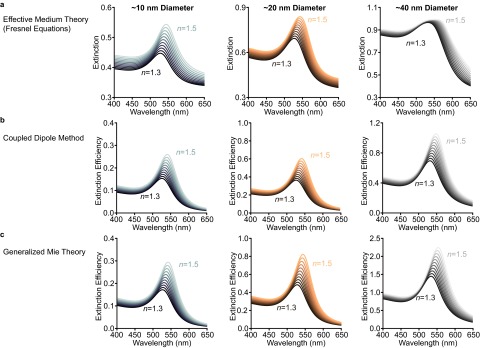
Comparison of theoretical methods. Simulated extinction spectra in increasing background indices for each thin-film superlattice measured in Fig. 1 [note that the superlattices are arranged by particle size: (Left) ∼10-nm; (Center) ∼20-nm; (Right) ∼40-nm diameters]. (A) Fresnel thin-film simulations. (B) Coupled dipole simulations. (C) Generalized Mie theory simulations. Notice that at elevated volume fractions the Fresnel simulations “saturate” in extinction intensity whereas the electrodynamics simulations maintain the characteristic LSPR Lorentzian shape.
Fig. S5.

Comparison between different theoretical methods and experimental extinction maxima. The extinction maximum is plotted for simulations in each background index and compared with the experimental background index (∼1.33 solution, 1.4 silica). (A) Superlattices constructed with ∼10-nm-diameter spheres. (B) Superlattices constructed with ∼20-nm-diameter spheres. (C) Superlattices constructed with ∼40-nm-diameter spheres. In all cases the magnitude of LSPR shift from solution to solid-state silica is similar (∼5 nm).
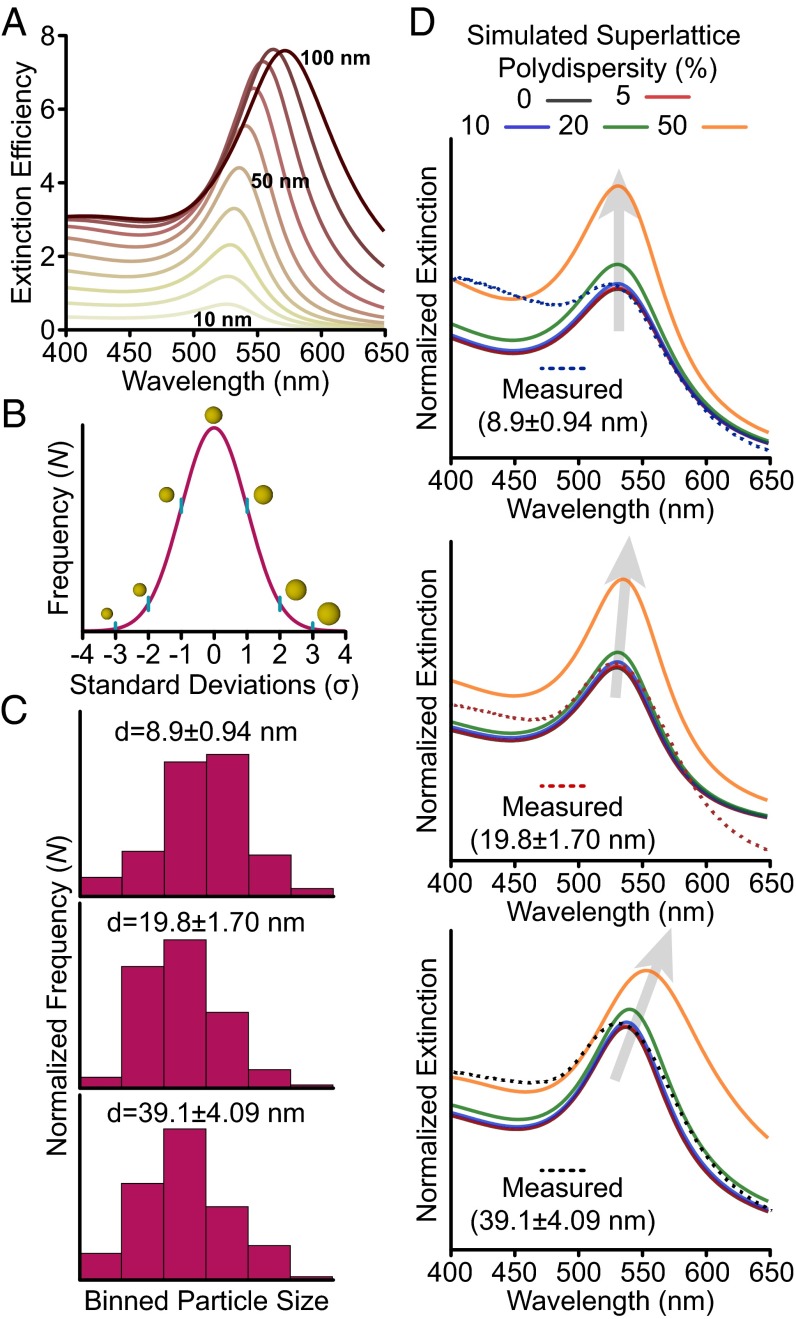
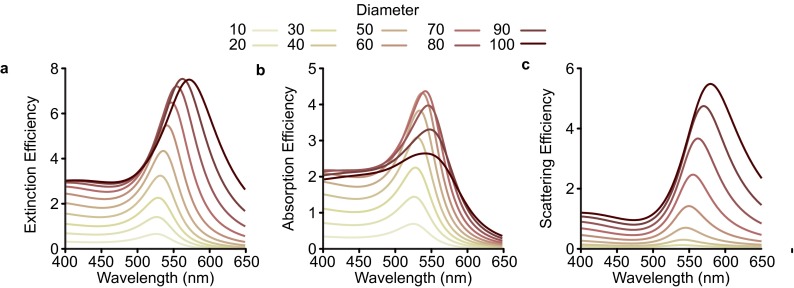
Our exploration of structural inhomogeneities begins with an analysis of the plasmonic nanoparticle building blocks. The sensitivity of the LSPR to variation in size and shape is well known (1, 15). Fig. 2A plots the simulated extinction efficiency from Mie theory for Au spheres with diameters ranging from 10 to 100 nm. At small sizes (10–40 nm), increasing the diameter increases the extinction intensity without appreciably changing the peak position. This occurs in the quasi-static regime, where the particle is much smaller than the wavelength. At larger diameters, the LSPR begins to red-shift, broaden, and strongly scatter incident light (Fig. S6) (1, 26). In a plasmonic superlattice, where millions of particles are measured as an ensemble, variation in nanoparticle size would inevitably lead to broadening and inconsistency in the optical response. Incorporating experimentally determined nanoparticle polydispersity enables the direct quantification of its effect on extinction. We use transmission electron microscopy (TEM) to determine the statistical variation of the nanoparticle diameters. The variation of particle diameters follows the normal distribution (Fig. 2 B and C).
Fig. 2.
Effect of nanoparticle polydispersity on extinction. (A) Simulated extinction efficiencies for Au spheres with diameters ranging from 10 to 100 nm (yellow to red). (B) A scheme of nanoparticle polydispersity across the normal distribution; particles are drawn to scale. (C) Binned nanoparticle diameter counts determined by TEM, n = 100. (D) Simulated extinction spectra for superlattices incorporating increasing extents of polydispersity. The dashed lines are the experimental traces for the superlattice films in solution.
Fig. S6.
Optical efficiencies for Au spheres. Extinction (A), absorption (B), and scattering (C) efficiencies for Au spheres with increasing diameters.
Using nanoparticle size distributions determined by TEM, we performed Mie simulations (Fig. 2D) with varying amounts of polydispersity; these are compared with the measured extinction of superlattices in solution (dashed lines) whose structural parameters are listed in Table 1. Notably, for all particle sizes minimal broadening in the extinction is observed for 10% polydispersity or less, showing strong agreement with the experimental traces. Increasing polydispersity changes the optical response; moreover, the extent of the change depends on the average particle size. For the smallest spheres, ∼10-nm average diameter, increasing the polydispersity increases the extinction intensity without changing the peak breadth or location (Fig. 2D, Top). For ∼20-nm average diameter spheres, the extinction first increases in intensity, and then broadens with polydispersity values of 50% (Fig. 2D, Middle). Finally, for the ∼40-nm average diameter spheres, the extinction maximum increases in intensity (like the ∼10-nm spheres), and with increasing polydispersity, the extinction peak broadens and red-shifts (Fig. 2D, Bottom).
The differences in behavior for the different particle diameters can be understood through the size dependence of the sphere LSPR (Fig. 2A). When the average particle diameter is small, the particles are quasi-static; an increase in the particle size increases the extinction coefficient without changing the LSPR location or breadth, resulting only in an increase in extinction intensity. Comparatively, for the larger-diameter case, some fraction of particles in the distribution are no longer quasi-static (i.e., they exhibit broadened and red-shifted LSPRs). In addition, larger spheres have greater extinction coefficients than smaller ones, increasing their contribution to the collective extinction even if they are at the tail of the particle distribution. In all cases, the extinction intensity increase with greater polydispersity is due to disproportionate contributions from larger particles compared with the smaller ones (extinction scales with diameter squared). These data suggest that one should consider polydispersity when selecting a plasmonic building block for optical materials; larger particles are undoubtedly better plasmonic scatterers, but from a polydispersity standpoint they will be less forgiving than small, quasi-static ones. Additionally, Figs. 1 and 2 demonstrate that volume fraction is only sufficient for describing quasi-static plasmonic nanoparticles with small amounts of polydispersity.
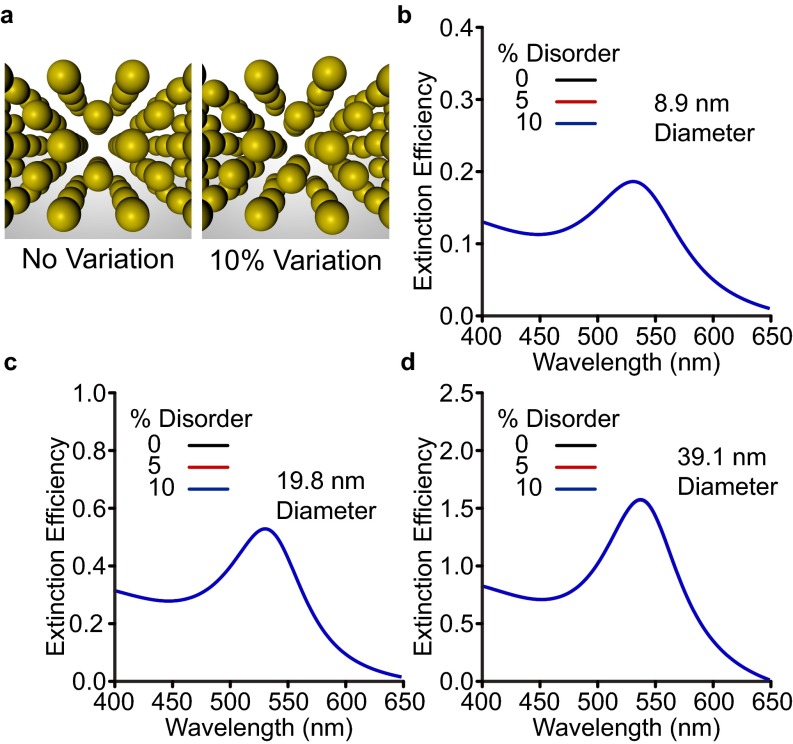
The use of imperfect building blocks in bottom-up nanoparticle assemblies often results in defects, grain boundaries, and lattice strain (30–35). In the systems studied in this work, molecular dynamics simulations suggest that DNA-assembled particles can exhibit 5–10% variation in their position due to the dynamic reorganization that occurs as interparticle linkages break and reform (36). To simulate the effect of nanoparticle site displacement in a superlattice, the locations of nanoparticles were randomly varied over a defined interval in three dimensions. Previous investigations of diffractive plasmonic nanoparticle lattices revealed that disorder in nanoparticle position changes the intensity of the collective LSPR due to weakened dipole–dipole interactions (37, 38). Here, however, the superlattice optical response does not vary with the inclusion of 5–10% displacement in the nanoparticle position (Fig. S7). This suggests that the interparticle plasmonic interactions here are primarily coherent and in-phase; small displacements (relative to their radii) in nanoparticle position do not meaningfully change the weak plasmonic coupling between particles. In turn, many of the emergent plasmonic and photonic effects that we have identified in similar systems (29, 34, 39) are likely robust to the presence of defects and forgiving to minor variations to the crystalline environment.
Fig. S7.
Effect of disorder on superlattices whose optical properties are dipole-dominated. (A) To-scale scheme depicting 5% variation in nanoparticle placement within the superlattice. (B) Extinction with increasing heterogeneity for a superlattice constructed with ∼8.9-nm building blocks. (C) Extinction with increasing heterogeneity for a superlattice constructed with ∼19.8-nm building blocks. (D) Extinction with increasing heterogeneity for a superlattice constructed with ∼39.1-nm building blocks. All superlattice geometries were determined using structural data from Table 1 (main text) and include experimentally informed polydisperse nanoparticle building blocks (10% SD) as described in the main text. In all cases, the black, red, and blue traces are overlaid.
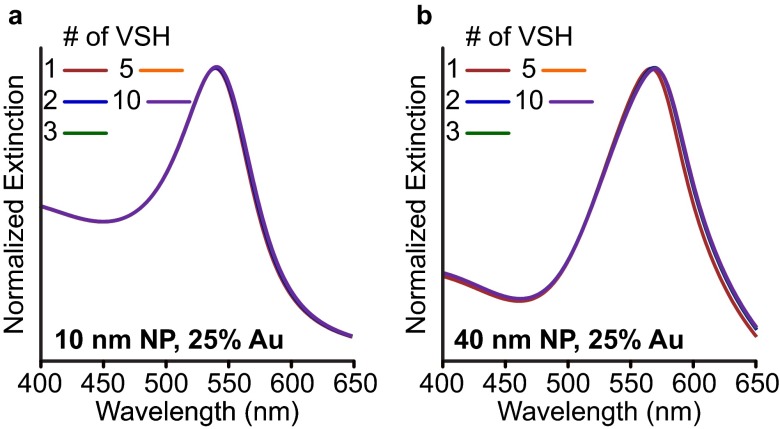
It is well known that different symmetries of closely coupled plasmonic particles can greatly alter interparticle interactions (13), controlling phenomena such as surface-enhanced Raman enhancement (40, 41), Fano profiles and “dark” plasmon modes (42), and altering waveguide quality (43). Moreover, superlattices with higher metal volume fractions exhibit rich optical behavior (8–10, 35). It is likely that the strong, nonlinear plasmonic coupling in these systems will increase the effect of randomness, disorder, and polydispersity on the optical response. To study the role of randomness and volume fraction, superlattices with fixed Au volume fractions (20% and 25%) comprising different nanoparticle sizes and spacing were simulated using generalized Mie theory (Table 2). For these systems, two methods of analysis are useful: far field (Fig. 3A, Left) and near field (Fig. 3A, Right). The far-field analysis describes optical properties such as absorption, extinction, and scattering whereas the near-field analysis quantifies the electric-field intensity |E| at the particle surface. A number of studies have demonstrated that far-field properties do not always describe interesting near-field phenomena that are crucial for spectral enhancement and light concentration (40, 41, 44). For example, short-ranged quadrupolar coupling between closely spaced 100-nm Ag nanoparticle arrays can lead to sharp coherent plasmon modes (45). Although these effects are not expected in these systems (which are dipole-dominated, Fig. S8), it is important to directly quantify interactions in the near field.
Table 2.
Structural parameters for 20% and 25% volume fraction superlattices
| Volume fraction, % Au | Particle diameter, nm | Lattice constant, nm | Gap, nm |
| 20. | 8.9 | 17.3 | 5 |
| 20. | 19.8 | 34.6 | 10 |
| 20. | 39.1 | 69.3 | 20 |
| 25. | 8.9 | 16.2 | 4 |
| 25. | 19.8 | 32.3 | 8 |
| 25. | 39.1 | 64.7 | 16 |
Fig. 3.
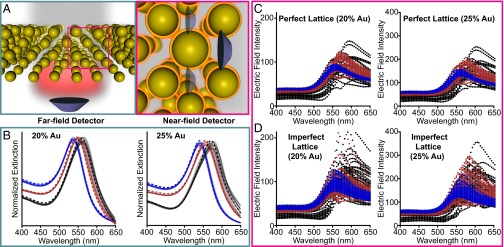
Far- and near-field plasmonic properties of high volume fraction superlattices. (A) Scheme depicting far-field (Left) and near-field (Right) plasmonic properties. (B) Far-field extinction spectra (solid traces) for 10 randomly generated superlattices incorporating nanoparticle polydispersity (10%) and variation in lattice location (5%); the dashed lines are for the “perfect” superlattices that do not include inhomogeneity. The simulations incorporate the experimental particle sizes determined in Fig. 3 for ∼10-nm (blue), ∼20-nm (red), and ∼40-nm (black)-diameter spheres. Each trace represents a single superlattice simulation. (C) Distribution of the near field at the surface of each particle in a perfect lattice (Left, 20% Au; Right, 25% Au). (D) Distribution of the near field at the surface of each particle in an imperfect lattice (Left, 20% Au; Right, 25% Au). The structural parameters describing each structure are listed in Table 2; each film has an ∼500-nm edge length and is in an index of 1.33.
Fig. S8.
Multipolar contributions to the optical response. Au superlattice (25%) comprising 10-nm-diameter (A) and 40-nm-diameter (B) spheres. The structures here are isostructural to those simulated in Table 2. Generalized Mie theory was used to limit the number of VSH (multipoles where n = 1 dipole, n = 2, quadrupole,…) allowed in the simulation.
Ten superlattice structures for each particle size were randomly generated to approximate sample-to-sample variation; these structures were designed to approximate realistic experimental samples with 10% polydispersity and 5% variation in lattice site (Fig. 3). Fig. 3B plots the simulated far-field extinction of these superlattices in water (n = 1.33), listed in Table 2. Fig. 3B compares superlattices with 20% Au (Left) and 25% Au (Right). In each case, the extinction maxima red-shift with increasing particle size (∼10 nm blue, ∼20 nm red, ∼40 nm black). In addition, it is clear that there is variation in both extinction intensity and in λmax between the 10 different simulated superlattices. Notably, these imperfect lattices differ from the perfect lattice (dashed line) in all cases. These effects are amplified at higher Au volume fraction, which would make forming a consistent and reproducible optical response more difficult. Because the structures compared are of equivalent volume fraction using different building blocks, it is clear that this regime is beyond that which can be described solely by volume fraction.
To quantify the effect of disorder on plasmonic coupling, we compare the distribution of the electric-field intensity (|E|2) at the surface of 50 particles within a superlattice. The electric-field intensity is color-coded by particle size (10 nm = blue, 20 nm = red, 40 nm = black) and the volume fraction is fixed at 20% and 25% Au (Table 2). In all cases, the distribution of |E|2 is smaller for the perfect superlattice (Fig. 3C) than for the imperfect superlattice (Fig. 3D). A physical interpretation of these data is that the imperfect superlattice has some sites with higher electric-field intensity than the perfect structure, some sites with lower electric-field intensity than the perfect structure, and greater variation in electric-field intensity from site to site than the perfect structure does.
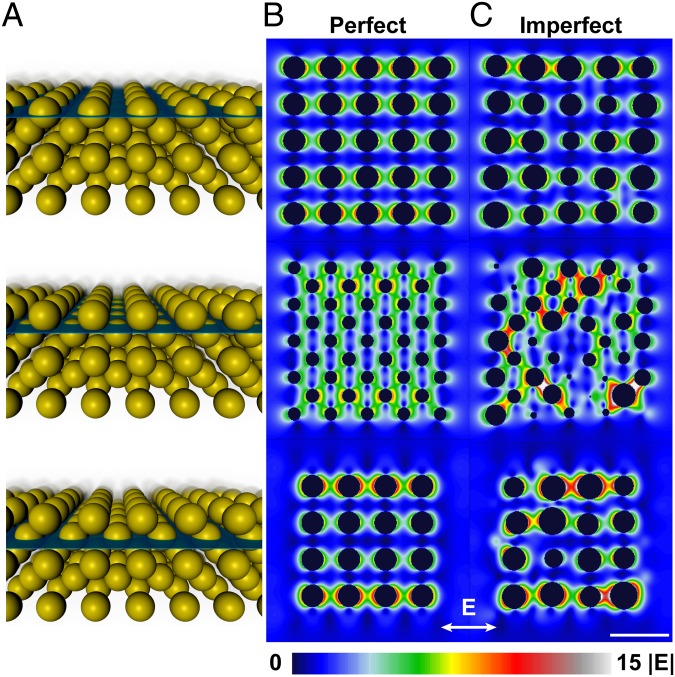
To visualize the variation in electric field |E|, a plane was moved through the superlattice in 1-nm increments perpendicular to the direction of light to create “slices” of the confined electric field (Fig. 4A). By combining a series of slices, we can approximate the effect of moving through the lattice with stills or in a movie (Movies S1, S2). From the electric-field slices of the perfect (Fig. 4B and Movie S1) and imperfect (Fig. 4C and Movie S2) superlattices, it is clear that the imperfect lattice has significant variation in electric-field intensity compared with the perfectly ordered lattice, which has a more homogeneous, and ultimately more predictable, electric-field intensity distribution. In the imperfect lattice, variation in the nanoscale gaps between particles leads to regions with larger maximum field values and also has regions where the field values are lower. It is likely that regions of high electric field (small gaps) would contribute disproportionately to the optical response, especially in devices that use various forms of spectral enhancement. Previous surface-enhanced Raman studies have observed that a disproportionate amount of scattered Raman intensity comes from a small percentage of the molecules in the “hot spots” (46). Although in principle hot spots increase device output and quality factor, they also can significantly reduce reproducibility and increase failure rates, which is an immense challenge for nanoscale systems. The extent to which disorder and inhomogeneity can be detrimental strongly depends on the desired property.
Fig. 4.
Electric-field intensity throughout a superlattice. (A) Scheme depicting different lattice planes for which the electric field was calculated. (B) Electric-field intensity plotted for the perfect superlattices. (C) Electric-field intensity plotted for a superlattice with 10% particle polydispersity and 5% variation in lattice site. The lattices comprise ∼40-nm spheres with a nearest-neighbor gap of 16.0 nm (25% Au). (Scale bar, 100 nm.)
Discussion
In summary, these data suggest that volume fraction of constituent nanoparticles is not always sufficient to describe the optical properties of plasmonic superlattices. We have previously implemented volume-fraction–based methods with predictable and consistent agreement between experiment and simulation in the far field (28, 29, 32, 34, 39). Many of the unique and exciting plasmonic materials that we have explored using programmable DNA assembly depend solely on dipolar interparticle interactions (at low volume fraction) and are fairly insensitive and defect-tolerant. In particular, nanoparticle size polydispersity (∼10%) and small (5%) displacement of the nanoparticle location have minimal effects on far-field extinction in the systems studied. Additionally, when monodisperse nanoparticles are not available, small quasi-static nanoparticles, e.g., those above a critical size at which variation is inherent, are ideal as building blocks to minimize broadening and ensure an even distribution of electric field.
It is clear, however, that plasmonic particles with sufficiently close spacings exhibit strong coupling in hierarchical superlattices where the optical response is both particle size and arrangement dependent. An extension of this is that defects and inhomogeneity in the superlattice can affect the near- and far-field optical response. In particular, 10-, 20-, and 40-nm-diameter particles in superlattices with volume fractions of 20% or greater exhibit different far- and near-field plasmonic properties that cannot be described by metal volume fraction alone. It is likely that further investigation of closely coupled plasmonic lattices will uncover unexpected and unusual plasmonic behavior (35). For example, numerous studies of closely coupled plasmonic nanoparticles have identified tunable reflection and dielectric behavior in addition to unique symmetry-dependent properties (5, 8–10, 13). These insights will lead to materials and devices that exhibit greater reproducibility including sensing, metamaterials, coatings, and optical electronics.
Materials and Methods
Optical Simulations.
Optical simulations were performed using either (i) Maxwell–Garnett effective medium theory in a Fresnel geometry or (ii) generalized multiparticle Mie theory, which are analytic and included 10 vector spherical harmonic expansions to ensure accuracy. All simulations used the Johnson and Christy dielectric function (47) with a surface scattering correction.
Optical Measurements.
Optical measurements were performed using an inverted microscope in the transmission orientation and extinction was determined by the relationship
Synthetic details are included in the main text; all methods are described in detail in the Supporting Information.
SI Materials and Methods
Oligonucleotide Synthesis and Nanoparticle Functionalization.
Table S1 lists the sequences used for assembly in this work. DNA sequences were synthesized on an MM48 oligonucleotide synthesizer (BioAutomation) using standard solid-phase phosphoramidite chemistry and reagents (Glen Research). Oligonucleotides were purified with reverse-phase high-performance liquid chromatography and their structure was confirmed using matrix-assisted laser desorption ionization time-of-flight mass spectrometry. PAEs were synthesized by functionalizing citrate-capped Au nanospheres (AuNPs, BBI Solutions) with DNA ligands (48). Briefly, 100 mM dithiolthreitol (DTT, Sigma-Aldrich) was incubated with DNA for 1 h to cleave the 3′-propyl-mercaptan protecting group. Size exclusion chromatography (NAP5 GE Life Sciences) was then performed for desalting of the DNA. Purified thiol strands were then added to the AuNPs in a 4 nmol DNA:1 mL nanoparticles ratio. Particles and nanoparticle concentrations were determined using a Cary 5000 UV-vis spectrometer (Agilent) and extinction coefficients provided by Ted Pella (nanoparticles) and the IDT Oligo Analyzer (oligonucleotides).
Next, sodium chloride (NaCl, Sigma-Aldrich), SDS (Sigma-Aldrich), and sodium phosphate (NaPO4, Sigma-Aldrich) were added stepwise (followed by 10-s sonication) over the course of several hours to increase the solution concentrations to 0.5 M NaCl, 0.01% SDS, and 10 mM NaPO4. To obtain maximum loading the solution was placed on a shaker overnight. The PAEs were then purified by three rounds of centrifugation (resuspension in 0.01% wt/vol SDS). After the final round of centrifugation, PAEs were resuspended in 0.5 M PBS (10 mM phosphate buffer, 0.5 M NaCl, and 0.01% SDS wt/vol).
Oligonucleotide linkers were hybridized to the PAEs by adding appropriate molar ratios of the linker strands (suspended in a 0.5-M NaCl solution). For 10-nm-diameter spheres, 60 linker strands were added per particle. For 20-nm-diameter spheres, 200 linker strands were added per particle. For 40-nm-diameter spheres, 600 linker strands were added per particle.
A thermal denaturation experiment is then performed between complementary particles A and B (Fig. 1, main text) by monitoring the extinction at 520 nm while increasing the temperature from 25 °C to 75 °C at a rate of 0.25 °C/min to determine where the melting transition occurs. The melting temperature is determined at the maximum of the derivative of the melting transition.
Layer-by-Layer Thin-Film Superlattice Assembly and Crystallization.
Substrates for layer-by-layer superlattice assembly were prepared using quartz slides (Ted Pella) using DNA that was synthesized and purified as described above. First, quartz slides were cleaned in piranha solution (3:1 sulfuric acid to H2O; Caution: piranha solutions are extremely corrosive and dangerous) at 80 °C for 30 min and then rinsed with a copious amount of water. A thin (8 nm) film of Au was evaporated with a 2-nm Cr adhesion layer onto the substrate using a physical vapor deposition (PVD) 75 E-beam evaporator (Kurt J. Lesker) at a base pressure of 5 × 10⁻⁸ torr and an evaporation rate of 0.25 Å/s. The substrates were then functionalized with DTT-cleaved thiolated DNA (2 μM) suspended in 5 mM PBS, 1 M NaCl for 24 h. Copious rinsing with 0.5 M PBS and shaking was performed to remove any excess DNA adsorbed to the substrate. Complementary linkers (0.5 μM, Table S1) were then hybridized to the oligonucleotide strands stabilized on the substrate in 0.5 M PBS by heating to 45 °C for 30 min. After cooling the substrates to room temperature, they were washed in triplicate with 0.5 M PBS.
Five nanoparticle layers were added iteratively to construct superlattices (Table 1, main text). Briefly, substrates were immersed in a solution of PAEs (10 nM of 10-nm AuNPs, 1.5 nM of 20-nm AuNPs, and 200 pM of 40-nm AuNPs all in 0.5 M PBS) in a capped Eppendorf tube which was held between 35 and 37 °C for ∼12 h. The sample was then cooled to room temperature and washed five times in 0.5 M PBS. This process was repeated for each additional layer of PAEs that was added, alternating between A and B particles (22).
Solid-State Stabilization of Superlattices in Silica.
The solid-state stabilization of superlattices is based on a silica sol–gel growth described previously (24). Typically, 2 μL of N-trimethoxysilylpropyl-N,N,N-trimethylammonium chloride (Gelest, 50% in methanol) was added to the superlattice in 1 mL of 0.5 M PBS. The sample was shaken (Eppendorf Thermomixer) for ∼20 min at room temperature to allow for association between the trimethylammonium cation and the negative phosphate backbone on the DNA. Next, 4 μL of triethyoxysilane (Sigma-Aldrich) was added and the sample was shaken at 1,400 rpm for 0.5 h for the substrate assembled samples. The substrate-bound samples were then washed in water and blown dry with nitrogen.
Synchrotron X-Ray Characterization.
Thin-film superlattices were interrogated using GISAXS experiments performed at the 12ID-B station at the APS at Argonne National Laboratory. Samples were probed using 12-keV (1.003 Å) X-rays which were calibrated with a silver behenate standard. Parasitic scattering was minimized using two sets of slits and pinhole to collimate the X-ray beam. Samples were aligned using the half-cut technique on a stage that allowed for translation in x, y, and z directions. Data were collected at angles ranging from 0.05 to 0.4°. Scattered X-rays were captured with a Pilatus 2M CCD detector. All GISAXS spectra here are interpreted and plotted using I(q), which represents the total scattering by both the particle and the crystallographic symmetry. The nearest-neighbor distance d (in nanometers) can be calculated by the location of the first-order scattering peak q0 in the diffraction pattern with (49)
| [S1] |
where C is a constant derived using the nearest-neighbor distance between two particles of a given lattice and the distance between the two planes associated with q0. From the nearest-neighbor distance, the lattice constant can be determined through geometrical relationships. For the bcc lattice studied here, this conversion is . The structural parameters for the thin-film superlattices are summarized in Table 1, main text.
Scanning Electron Microscopy Characterization of Nanoparticle Superlattices.
Electron micrographs were obtained at the Northwestern University Atomic and Nanoscale Characterization Experimental Center (NUANCE) on a Hitachi scanning electron microscope SU8030. Silica-embedded superlattices were rinsed a few times in water, briefly sonicated, and vortexed before dropcasting ∼10 μL of suspension onto a clean silicon wafer (Ted Pella).
SI Simulation Methods
All simulations were performed using the dielectric constant for Au from Johnson and Christy (47). We also include a small-size correction to the dielectric function to account for broadening and damping observed in small particles and experimental systems (A = 0.1). Much of this broadening is due to defects, surface-scattering events, and are ultimately derived from the finite mean-free path of electrons in a small sphere (50). We apply an analytic adjustment that has provided strong agreement with experiments; it is related to the surface area and volume of an arbitrary concave shape. More details can be found elsewhere (50).
Maxwell–Garnett Effective Medium Theory Calculation of Effective Material Properties.
The dielectric function describes the ability of a material to concentrate and transmit electric flux. The effective properties of a material can be described by an effective dielectric function εeff:
| [S2] |
where ε is the dielectric function of the material and f is the volume fraction of the metal, given by
| [S3] |
Here, N is the number of nanoparticle inclusions per unit cell, Vnanoparticle is the metal volume of each nanoparticle, and Vunit cell is the total volume of interest, in this case a single unit cell. All unit cells studied are bcc, which contain two nanoparticles per unit cell.
Fresnel Multilayer Film Simulations.
A Fresnel equation model was used to simulate superlattices in an infinite film geometry. The Fresnel thin-film geometry incorporates the EMT effective dielectric material as superlattice input. Although this only approximates the properties of the superlattice (discussed in the main text), it provides an accurate comparison with the experimental geometry setup, i.e., transmission through air and quartz. The solution to the Fresnel equations provides the transmission and reflection of a wave incident on films that differ in refractive index. In these simulations, the top layer (where light is incident) is set to n = 1 (air), the middle layer is the superlattice material determined using EMT, and the bottom layer is set to n = 1.458 (quartz).
Coupled Dipole Simulations of Nanoparticle Superlattices.
Coupled dipole simulations allow for the simulation of superlattices of arbitrary size, shape, and symmetry (11, 28, 29, 32, 34, 51). In the coupled dipole method, each dipole represents a single quasi-static spherical nanoparticle and the interactions between them are fully retarded. Using the open-source DDSCAT code (52–54), the interactions between dipoles are solved using fast Fourier transforms, which greatly speed up the calculations and allow for parallelization.
The polarization Pi of the ith dipole is given by
| [S4] |
where Eloc(ri) is the sum of the incident plane wave and the electric field generated by all of the other dipoles at a given point, ri. The polarizability of a single dipole αι is given by the quasi-static expression for a sphere:
| [S5] |
where ε is the complex, frequency-dependent dielectric function of the metal, εb is the dielectric constant of the background media, and a is the volume of a sphere . We present the simulated extinction spectra either normalized or as extinction efficiencies. The latter are defined using the ratio of the extinction cross-section and the geometric cross-section. Coupled dipole simulations are for comparison with generalized multiparticle Mie (GMM) simulations (see the next section), which are more accurate and include multipolar resonances (i.e., dipole, quadrupole, etc.) (Figs. S4 and S5).
GMM Theory Simulations.
Mie’s theory is the analytic solution to Maxwell’s equations for light scattering by a sphere. The solution to Mie theory is exact provided a sufficient amount of vector spherical harmonic (VSH) expansion terms are included. At least 10 VSH terms were included for all simulated systems, providing a high level of accuracy. All simulated thin films ranged between 250 and 500 nm on edge; these structures included 100–500 nanoparticles. Due to the high computational demand for closely spaced nanoparticle structures, these were the largest structures able to be simulated accurately. In all cases, 100 nanoparticles were sufficient to approximate structure-to-structure variation.
Supplementary Material
Acknowledgments
M.B.R. and J.C.K. gratefully acknowledge support through the National Defense Science and Engineering Graduate (NDSEG) Fellowship Program. This research was supported by Air Force Office of Scientific Research (AFOSR) Multidisciplinary University Research Initiative (MURI) Grant FA9550-11-1-0275 and by the Northwestern Materials Research Center (MRSEC) under NSF Grant DMR-1121262. Computational time was provided by the Quest High-Performance Computing Facility at Northwestern University, which is jointly supported by the Office of the Provost, the Office for Research, and Northwestern University Information Technology. GISAXS experiments were performed at beamline 12-ID-B at the Advanced Photon Source (APS), Argonne National Laboratory, and use of the APS was supported by the Department of Energy (DE-AC02-06CH11357). This work made use of the Electron Probe Instrumentation Center (EPIC) facility [Northwestern University Atomic and Nanoscale Characterization Experimental (NUANCE) Center-Northwestern University], which has received support from the MRSEC program (NSF DMR-1121262) at the Materials Research Center, the International Institute for Nanotechnology (IIN), and the State of Illinois, through the IIN.
Footnotes
The authors declare no conflict of interest.
This article contains supporting information online at www.pnas.org/lookup/suppl/doi:10.1073/pnas.1513058112/-/DCSupplemental.
References
- 1.Kelly KL, Coronado E, Zhao LL, Schatz GC. The optical properties of metal nanoparticles: The influence of size, shape, and dielectric environment. J Phys Chem B. 2003;107(3):668–677. [Google Scholar]
- 2.Howes PD, Chandrawati R, Stevens MM. Bionanotechnology. Colloidal nanoparticles as advanced biological sensors. Science. 2014;346(6205):1247390. doi: 10.1126/science.1247390. [DOI] [PubMed] [Google Scholar]
- 3.Mirkin CA, Letsinger RL, Mucic RC, Storhoff JJ. A DNA-based method for rationally assembling nanoparticles into macroscopic materials. Nature. 1996;382(6592):607–609. doi: 10.1038/382607a0. [DOI] [PubMed] [Google Scholar]
- 4.Maier SA, Atwater HA. Plasmonics: Localization and guiding of electromagnetic energy in metal/dielectric structures. J Appl Phys. 2005;98(1):01101. [Google Scholar]
- 5.Soukoulis CM, Wegener M. Past achievements and future challenges in the development of three-dimensional photonic metamaterials. Nat Photonics. 2011;5(9):523–530. [Google Scholar]
- 6.Zhou W, et al. Lasing action in strongly coupled plasmonic nanocavity arrays. Nat Nanotechnol. 2013;8(7):506–511. doi: 10.1038/nnano.2013.99. [DOI] [PubMed] [Google Scholar]
- 7.Rose A, et al. Control of radiative processes using tunable plasmonic nanopatch antennas. Nano Lett. 2014;14(8):4797–4802. doi: 10.1021/nl501976f. [DOI] [PubMed] [Google Scholar]
- 8.Collier CP. Reversible tuning of silver quantum dot monolayers through the metal-insulator transition. Science. 1997;277(5334):1978–1981. [Google Scholar]
- 9.Fafarman AT, et al. Chemically tailored dielectric-to-metal transition for the design of metamaterials from nanoimprinted colloidal nanocrystals. Nano Lett. 2013;13(2):350–357. doi: 10.1021/nl303161d. [DOI] [PubMed] [Google Scholar]
- 10.Tao A, Sinsermsuksakul P, Yang P. Tunable plasmonic lattices of silver nanocrystals. Nat Nanotechnol. 2007;2(7):435–440. doi: 10.1038/nnano.2007.189. [DOI] [PubMed] [Google Scholar]
- 11.Ross MB, Ku JC, Vaccarezza VM, Schatz GC, Mirkin CA. Nanoscale form dictates mesoscale function in plasmonic DNA-nanoparticle superlattices. Nat Nanotechnol. 2015;10(5):453–458. doi: 10.1038/nnano.2015.68. [DOI] [PubMed] [Google Scholar]
- 12.Olson J, et al. Vivid, full-color aluminum plasmonic pixels. Proc Natl Acad Sci USA. 2014;111(40):14348–14353. doi: 10.1073/pnas.1415970111. [DOI] [PMC free article] [PubMed] [Google Scholar]
- 13.Jones MR, Osberg KD, Macfarlane RJ, Langille MR, Mirkin CA. Templated techniques for the synthesis and assembly of plasmonic nanostructures. Chem Rev. 2011;111(6):3736–3827. doi: 10.1021/cr1004452. [DOI] [PubMed] [Google Scholar]
- 14.Cademartiri L, Bishop KJM. Programmable self-assembly. Nat Mater. 2015;14(1):2–9. doi: 10.1038/nmat4184. [DOI] [PubMed] [Google Scholar]
- 15.Henry A-I, et al. Correlated structure and optical property studies of plasmonic nanoparticles. J Phys Chem C. 2011;115(19):9291–9305. [Google Scholar]
- 16.Olson J, et al. Optical characterization of single plasmonic nanoparticles. Chem Soc Rev. 2015;44(1):40–57. doi: 10.1039/c4cs00131a. [DOI] [PMC free article] [PubMed] [Google Scholar]
- 17.Alivisatos AP, et al. Organization of ‘nanocrystal molecules’ using DNA. Nature. 1996;382(6592):609–611. doi: 10.1038/382609a0. [DOI] [PubMed] [Google Scholar]
- 18.Park SY, et al. DNA-programmable nanoparticle crystallization. Nature. 2008;451(7178):553–556. doi: 10.1038/nature06508. [DOI] [PubMed] [Google Scholar]
- 19.Nykypanchuk D, Maye MM, van der Lelie D, Gang O. DNA-guided crystallization of colloidal nanoparticles. Nature. 2008;451(7178):549–552. doi: 10.1038/nature06560. [DOI] [PubMed] [Google Scholar]
- 20.Tan SJ, Campolongo MJ, Luo D, Cheng W. Building plasmonic nanostructures with DNA. Nat Nanotechnol. 2011;6(5):268–276. doi: 10.1038/nnano.2011.49. [DOI] [PubMed] [Google Scholar]
- 21.Macfarlane RJ, et al. Nanoparticle superlattice engineering with DNA. Science. 2011;334(6053):204–208. doi: 10.1126/science.1210493. [DOI] [PubMed] [Google Scholar]
- 22.Senesi AJ, et al. Stepwise evolution of DNA-programmable nanoparticle superlattices. Angew Chem Int Ed Engl. 2013;52(26):6624–6628. doi: 10.1002/anie.201301936. [DOI] [PubMed] [Google Scholar]
- 23.Jones MR, Seeman NC, Mirkin CA. Nanomaterials. Programmable materials and the nature of the DNA bond. Science. 2015;347(6224):1260901. doi: 10.1126/science.1260901. [DOI] [PubMed] [Google Scholar]
- 24.Auyeung E, Macfarlane RJ, Choi CHJ, Cutler JI, Mirkin CA. Transitioning DNA-engineered nanoparticle superlattices from solution to the solid state. Adv Mater. 2012;24(38):5181–5186. doi: 10.1002/adma.201202069. [DOI] [PubMed] [Google Scholar]
- 25.Bohren CF, Huffman DR. Absorption and Scattering of Light by Small Particles. Wiley; New York: 1983. pp. 130–154. [Google Scholar]
- 26.Kreibig U, Vollmer M. Optical Properties of Metal Clusters. Springer; Berlin: 1995. pp. 170–173. [Google Scholar]
- 27.Blaber MG, Arnold MD, Ford MJ. A review of the optical properties of alloys and intermetallics for plasmonics. J Phys Condens Matter. 2010;22(14):143201. doi: 10.1088/0953-8984/22/14/143201. [DOI] [PubMed] [Google Scholar]
- 28.Lazarides AA, Schatz GC. DNA-linked metal nanosphere materials: Structural basis for the optical properties. J Phys Chem B. 2000;104(3):460–467. [Google Scholar]
- 29.Ross MB, Blaber MG, Schatz GC. Using nanoscale and mesoscale anisotropy to engineer the optical response of three-dimensional plasmonic metamaterials. Nat Commun. 2014;5:4090. doi: 10.1038/ncomms5090. [DOI] [PubMed] [Google Scholar]
- 30.Diroll BT, et al. X-ray mapping of nanoparticle superlattice thin films. ACS Nano. 2014;8(12):12843–12850. doi: 10.1021/nn5062832. [DOI] [PubMed] [Google Scholar]
- 31.Rupich SM, Shevchenko EV, Bodnarchuk MI, Lee B, Talapin DV. Size-dependent multiple twinning in nanocrystal superlattices. J Am Chem Soc. 2010;132(1):289–296. doi: 10.1021/ja9074425. [DOI] [PubMed] [Google Scholar]
- 32.Storhoff JJ, et al. What controls the optical properties of DNA-linked gold nanoparticle assemblies? J Am Chem Soc. 2000;122(19):4640–4650. [Google Scholar]
- 33.Xia Y, et al. Self-assembly of self-limiting monodisperse supraparticles from polydisperse nanoparticles. Nat Nanotechnol. 2011;6(9):580–587. doi: 10.1038/nnano.2011.121. [DOI] [PubMed] [Google Scholar]
- 34.Young KL, et al. Using DNA to design plasmonic metamaterials with tunable optical properties. Adv Mater. 2014;26(4):653–659. doi: 10.1002/adma.201302938. [DOI] [PubMed] [Google Scholar]
- 35.Senesi AJ, et al. Oligonucleotide flexibility dictates crystal quality in DNA-programmable nanoparticle superlattices. Adv Mater. 2014;26(42):7235–7240. doi: 10.1002/adma.201402548. [DOI] [PubMed] [Google Scholar]
- 36.Li TING, Sknepnek R, Macfarlane RJ, Mirkin CA, de la Cruz MO. Modeling the crystallization of spherical nucleic acid nanoparticle conjugates with molecular dynamics simulations. Nano Lett. 2012;12(5):2509–2514. doi: 10.1021/nl300679e. [DOI] [PubMed] [Google Scholar]
- 37.Zou S, Schatz GC. Narrow plasmonic/photonic extinction and scattering line shapes for one and two dimensional silver nanoparticle arrays. J Chem Phys. 2004;121(24):12606–12612. doi: 10.1063/1.1826036. [DOI] [PubMed] [Google Scholar]
- 38.Zou S, Zhao L, Schatz GC. Extinction spectra of silver nanoparticle arrays. Proc SPIE. 2003;5221(5221):174–181. [Google Scholar]
- 39.Park DJ, et al. Plasmonic photonic crystals realized through DNA-programmable assembly. Proc Natl Acad Sci USA. 2015;112(4):977–981. doi: 10.1073/pnas.1422649112. [DOI] [PMC free article] [PubMed] [Google Scholar]
- 40.Kleinman SL, et al. Structure enhancement factor relationships in single gold nanoantennas by surface-enhanced Raman excitation spectroscopy. J Am Chem Soc. 2013;135(1):301–308. doi: 10.1021/ja309300d. [DOI] [PubMed] [Google Scholar]
- 41.Zhang Y, et al. Coherent anti-Stokes Raman scattering with single-molecule sensitivity using a plasmonic Fano resonance. Nat Commun. 2014;5:4424. doi: 10.1038/ncomms5424. [DOI] [PubMed] [Google Scholar]
- 42.Luk’yanchuk B, et al. The Fano resonance in plasmonic nanostructures and metamaterials. Nat Mater. 2010;9(9):707–715. doi: 10.1038/nmat2810. [DOI] [PubMed] [Google Scholar]
- 43.Solis D, Jr, et al. Electromagnetic energy transport in nanoparticle chains via dark plasmon modes. Nano Lett. 2012;12(3):1349–1353. doi: 10.1021/nl2039327. [DOI] [PubMed] [Google Scholar]
- 44.Teulle A, et al. Multimodal plasmonics in fused colloidal networks. Nat Mater. 2015;14(1):87–94. doi: 10.1038/nmat4114. [DOI] [PMC free article] [PubMed] [Google Scholar]
- 45.Malynych S, Chumanov G. Light-induced coherent interactions between silver nanoparticles in two-dimensional arrays. J Am Chem Soc. 2003;125(10):2896–2898. doi: 10.1021/ja029453p. [DOI] [PubMed] [Google Scholar]
- 46.Fang Y, Seong NH, Dlott DD. Measurement of the distribution of site enhancements in surface-enhanced Raman scattering. Science. 2008;321(5887):388–392. doi: 10.1126/science.1159499. [DOI] [PubMed] [Google Scholar]
- 47.Johnson PB, Christy RW. Optical constants of the noble metals. Phys Rev B. 1972;6(12):4370–4379. [Google Scholar]
- 48.Hill HD, Mirkin CA. The bio-barcode assay for the detection of protein and nucleic acid targets using DTT-induced ligand exchange. Nat Protoc. 2006;1(1):324–336. doi: 10.1038/nprot.2006.51. [DOI] [PubMed] [Google Scholar]
- 49.Cullity BD, Stock SR. Elements of X-ray Diffraction. 3rd Ed. Prentice Hall; Upper Saddle River, NJ: 2001. pp. 170–173. [Google Scholar]
- 50.Coronado EA, Schatz GC. Surface plasmon broadening for arbitrary shape nanoparticles: A geometrical probability approach. J Chem Phys. 2003;119(7):3926. [Google Scholar]
- 51.Lazarides AA, Schatz GC. DNA-linked metal nanosphere materials: Fourier-transform solutions for the optical response. J Chem Phys. 2000;112(6):2987–2993. [Google Scholar]
- 52.Draine BT, Flatau PJ. Discrete-dipole approximation for scattering calculations. J Opt Soc Am A Opt Image Sci Vis. 1994;11(4):1491. doi: 10.1364/josaa.25.002693. [DOI] [PubMed] [Google Scholar]
- 53.Draine BT, Goodman J. Beyond Clausius-Mossotti - wave-propagation on a polarizable point lattice and the discrete dipole approximation. Astrophys J. 1993;405(2):685–697. [Google Scholar]
- 54.Flatau PJ, Draine BT. Fast near field calculations in the discrete dipole approximation for regular rectilinear grids. Opt Express. 2012;20(2):1247–1252. doi: 10.1364/OE.20.001247. [DOI] [PubMed] [Google Scholar]
Associated Data
This section collects any data citations, data availability statements, or supplementary materials included in this article.


