Significance
The metabolic syndrome has evolved to be a major health issue globally. The association between genome integrity and metabolic abnormalities is not well understood. Our results indicate that increased DNA damage and persistent activation of the DNA damage response induce adipocyte senescence in DNA polymerase η knockout (pol η−/−) mice. Suppression of adipocyte senescence with a p53 inhibitor, pifithrin-α, alleviated metabolic abnormalities in pol η−/− mice. An increase or decrease in DNA damage affected the senescence status of adipocytes accordingly, which was also in concordance with the severity of metabolic abnormalities in the pol η−/− mice. Our current results indicate that reduced genome integrity plays a causative role in provoking adipocyte senescence that leads to development of obesity and insulin resistance.
Keywords: DNA polymerase η, obesity, senescence, DNA damage, adipose tissue
Abstract
Obesity and the metabolic syndrome have evolved to be major health issues throughout the world. Whether loss of genome integrity contributes to this epidemic is an open question. DNA polymerase η (pol η), encoded by the xeroderma pigmentosum (XP-V) gene, plays an essential role in preventing cutaneous cancer caused by UV radiation-induced DNA damage. Herein, we demonstrate that pol η deficiency in mice (pol η−/−) causes obesity with visceral fat accumulation, hepatic steatosis, hyperleptinemia, hyperinsulinemia, and glucose intolerance. In comparison to WT mice, adipose tissue from pol η−/− mice exhibits increased DNA damage and a greater DNA damage response, indicated by up-regulation and/or phosphorylation of ataxia telangiectasia mutated (ATM), phosphorylated H2AX (γH2AX), and poly[ADP-ribose] polymerase 1 (PARP-1). Concomitantly, increased cellular senescence in the adipose tissue from pol η−/− mice was observed and measured by up-regulation of senescence markers, including p53, p16Ink4a, p21, senescence-associated (SA) β-gal activity, and SA secretion of proinflammatory cytokines interleukin 6 (IL-6) and tumor necrosis factor α (TNF-α) as early as 4 wk of age. Treatment of pol η−/− mice with a p53 inhibitor, pifithrin-α, reduced adipocyte senescence and attenuated the metabolic abnormalities. Furthermore, elevation of adipocyte DNA damage with a high-fat diet or sodium arsenite exacerbated adipocyte senescence and metabolic abnormalities in pol η−/− mice. In contrast, reduction of adipose DNA damage with N-acetylcysteine or metformin ameliorated cellular senescence and metabolic abnormalities. These studies indicate that elevated DNA damage is a root cause of adipocyte senescence, which plays a determining role in the development of obesity and insulin resistance.
The human genome is constantly challenged by exogenous and endogenous DNA damaging agents. To ensure genome integrity, human cells have faithful DNA replication machinery and DNA repair systems that are coordinated by DNA damage response networks. In response to different extents or types of DNA lesions, the DNA damage response activates appropriate cellular responses, including transient or permanent (senescence) cell cycle arrest, or apoptosis, to minimize the detrimental effects of DNA lesions (1). Reduction or deficiency in DNA repair/replication enzyme activity is well documented to increase vulnerability for the development of cancer, neurodegenerative diseases, and aging (2). In addition, defective DNA repair enzymes are associated with the metabolic symptom; for example, DNA glycosylase (Neil1)- and OGG1-deficient mice are obese (3–5), and nucleotide excision repair protein ERCC1-XPF deficiency causes lipodystrophy (6). Furthermore, DNA damage response protein ataxia telangiectasia mutated (ATM) suppresses JNK activity through p53 signaling and mediates an antioxidant action that has been suggested to be relevant to the metabolic syndrome (7). Nucleotide excision repair XP-A protein may affect metabolism by altering mitochondrial function (8). To date, the mechanisms that link genome instability and metabolic dysregulation have not been elucidated.
DNA polymerase η (pol η) is a specialized lesion bypass polymerase that faithfully replicates across UV-induced cyclobutane pyrimidine dimers (9) to rescue stalled DNA replication forks from potential breakages and mutations. Defects in the gene encoding pol η produce a variant form of the autosomal recessive disease xeroderma pigmentosum (XP-V) (9). Patients with XP-V are highly sensitive to sunlight and prone to cutaneous cancer (9). In addition to skin, pol η is expressed in most tissues (10). The expression of pol η correlates with the effectiveness of anticancer therapeutic agents that exert their activity by introducing DNA lesions that block the progression of DNA replication (11). In addition to exogenous introduced DNA lesions, pol η contributes to genomic stability during unperturbed DNA replication (12) and replicates across reactive oxygen species (ROS)-induced oxidative DNA lesions 8-oxoG (7,8-dihydro-8-oxoguanine), thymine glycol, and lipid peroxidation DNA adducts generated during endogenous metabolic processes (13, 14). ROS generated from endogenous metabolism or exogenous sources has been associated with cancer, aging, and the metabolic syndrome.
Therefore, the initial hypothesis for our studies was that pol η contributes to reduce tumorigenesis by managing oxidative DNA lesions in other organs. However, in a 2-y study, no increase in the incidence of tumors of any type was found with pol η KO (pol η−/−) mice (15). Instead, we found pol η−/− mice develop metabolic abnormalities that induce obesity.
Results and Discussion
Metabolic Abnormalities in Pol η Mice.
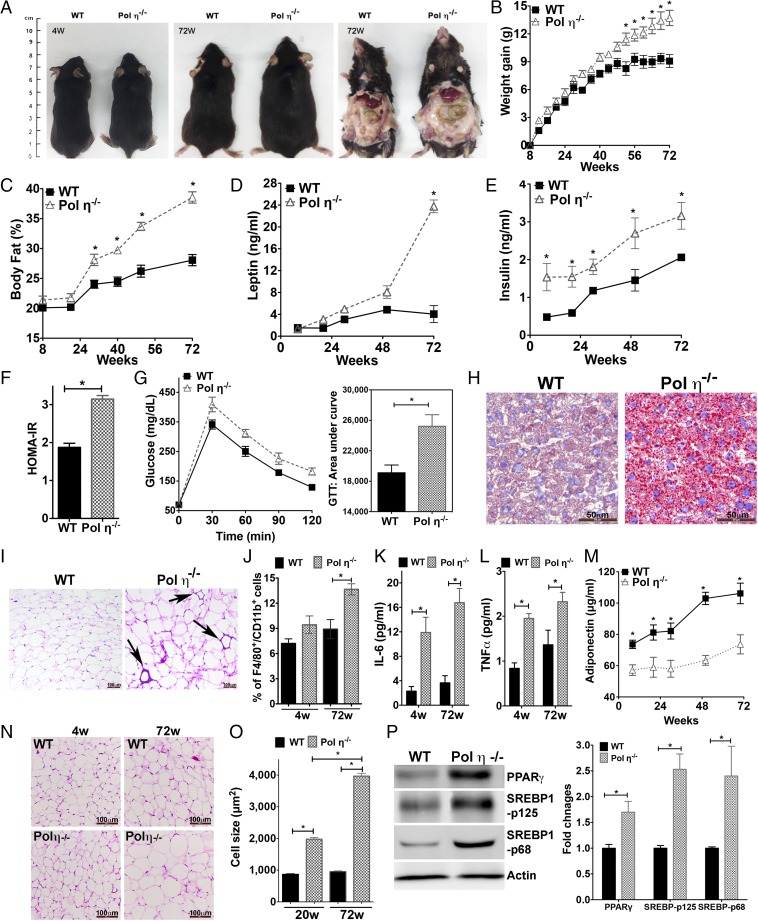
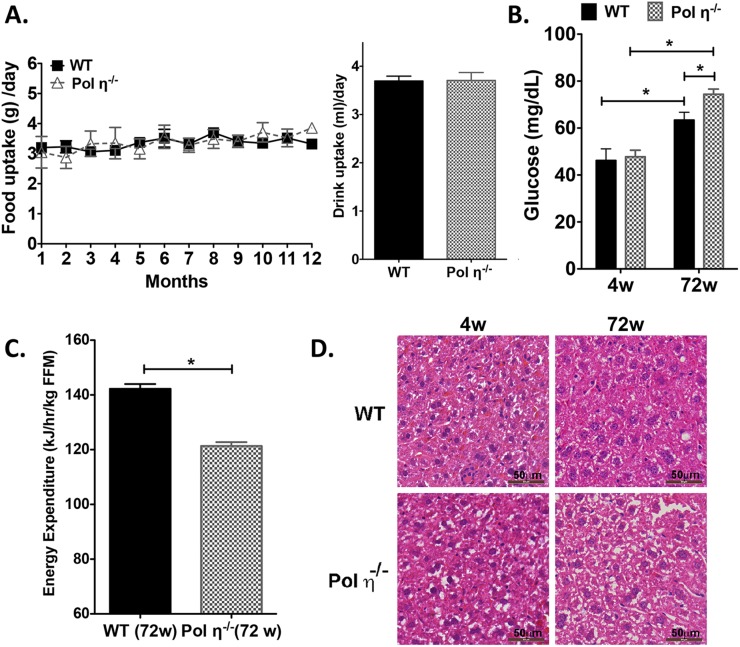
Compared with littermate WT mice, pol η−/− mice gained more weight with age, particularly after 48 wk, with no genotype difference in food or water consumption (Fig. 1 A–C and Fig. S1A). Autopsies revealed increased visceral fat encasing the abdominal organs of pol η−/− mice (Fig. 1A). By 72 wk, pol η−/− mice had gained an average of 55% more weight than WT littermates (14.0 g vs. 9.0 g, respectively; Fig. 1B), with 37.5% more body fat (38.5% vs. 28.0%, respectively; Fig. 1C). Pol η−/− mice also developed hyperleptinemia (Fig. 1D), hyperinsulinemia (Fig. 1E), higher blood glucose (Fig. S1B), higher homeostasis model assessment of insulin resistance (HOMA-IR) (Fig. 1F), reduced energy expenditure (Fig. S1C), and reduced glucose tolerance (Fig. 1G) compared with WT littermates. Hepatic steatosis was also apparent in the pol η−/− mice, as evidenced by enlarged and light-colored livers (Fig. 1A), increased micro- and macrovesicles (Fig. S1D), and increased Oil Red O staining (Fig. 1H).
Fig. 1.
Pol η−/− mice develop metabolic abnormalities. (A) Autopsy of WT and pol η−/− mice at 4 (4W) and 72 (72W) wk of age; (B) body weight gain (n = 12); (C) body fat percentages (n = 12); (D) circulating leptin and (E) insulin levels; (F) HOMA-IR (n = 8); (G) glucose tolerance test (GTT) with area under curve (AUC) (n = 8); (H) liver stained with Oil Red O (Scale bars: 50 μM); (I) H&E staining of adipose macrophage infiltration; (J) F4/80+/CD11b+-positive cells (n = 6) in adipocytes from mice at 72 wk (w) of age; (K) IL-6; (L) TNF-α; (M) adiponectin in plasma (n = 8); (N) H&E staining of visceral fat histological sections; (O) quantitation of adipocyte size (n = 400); and (P) expression of PPAR-γ, SREBP1-p125, and SREBP1-p68 subunits. Histological pictures and blots are representative of six independent experiments. The graphical data, which are shown as the mean ± SEM, were analyzed by the Student t test (*P < 0.05).
Fig. S1.
Metabolic abnormalities in pol η−/− mice. (A) Food and drinking water uptake of WT and pol η−/− mice fed a normal chow diet (n = 12). (B) Fasting plasma glucose concentrations in 4- and 72-wk-old mice (n = 8). (C) Energy expenditure of WT and pol η−/− mice (n = 12). (D) H&E staining of liver tissues from mice fed normal chow (4 and 72 wk of age). FFM, fat-free mass; w, week; The data, which are shown as the mean ± SEM, were analyzed by the Student t test (*P < 0.05 vs. the corresponding WT value).
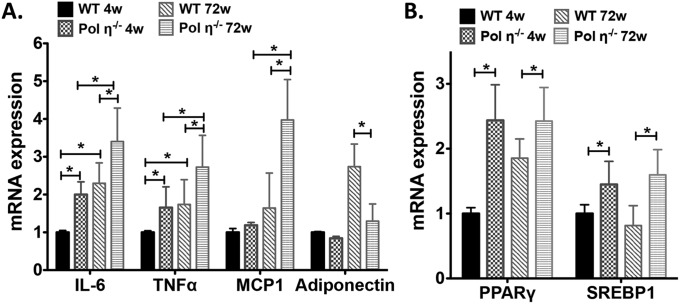
Infiltration of macrophages into adipose tissue is an established characteristic of obesity (16), which was apparent in the adipose tissue of pol η−/− mice, as evidenced by crown-like structures in histological sections (Fig. 1I) and an increased number of F4/80+/CD11b+-positive cells compared with WT mice (17) (Fig. 1J). Consistent with these findings, the inflammatory cytokines IL-6, TNF-α, and monocyte chemoattractant protein-1 (MCP-1) were increased and the antiinflammatory cytokine adiponectin (16) was decreased in the plasma and adipocytes (Fig. 1 K–M and Fig. S2A) of pol η−/− mice.
Fig. S2.
Real-time PCR analysis of relative mRNA expression in mouse adipocytes. (A) Relative mRNA expression of IL-6, TNF-α, MCP-1, and adiponectin in mouse adipocytes. (B) Real-time PCR analysis of relative mRNA expression of PPAR-γ and SREBP1 in mouse adipocytes. The data, which are shown as the mean ± SEM (n = 6), were analyzed by the Student t test (*P < 0.05 vs. the corresponding WT value).
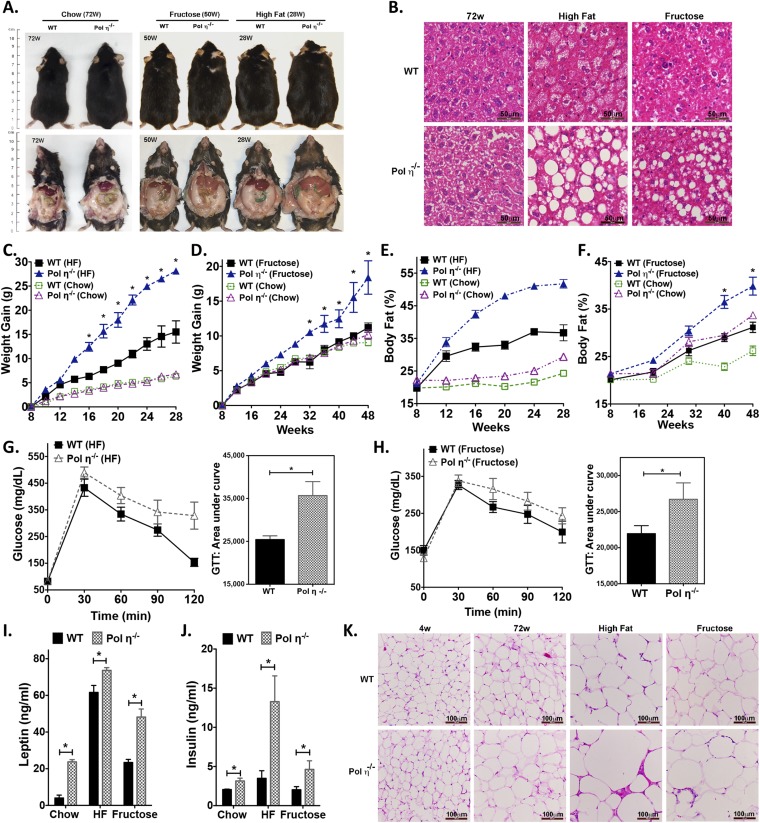
The adipocytes from pol η−/− mice developed hypertrophy with age (4.6-fold larger than WT at 72 wk old; Fig. 1 N and O) and exhibited elevated expression of the master adipogenic regulator genes SREBP1 and PPAR-γ (18) (Fig. 1P and Fig. S2B). The administration of diets high in fat or fructose promoted greater obesity and exacerbated the metabolic abnormalities in the pol η−/− mice relative to their WT littermates (Fig. S3), which further indicated that pol η−/− mice are prone to the development of metabolic abnormalities. Together, these characteristics of obesity with concomitant development of glucose intolerance and reduced insulin sensitivity in the pol η−/− mice suggest a preventive role for pol η in the onset of metabolic abnormalities.
Fig. S3.
High-fat and high-fructose diets accelerate metabolic abnormalities in pol η−/− mice. (A) Image and autopsy of WT and pol η−/− mice fed normal chow (4 and 72 wk), a high-fat diet (28 wk), or a high-fructose diet (50 wk). (B) H&E staining of liver tissues from mice with different diets. (C) Weight gain in mice fed a high-fat (HF) diet or regular chow. (D) Weight gain in mice fed a high-fructose diet or regular chow. (E) Body fat content in mice fed a high-fat diet or regular chow. (F) Body fat content in mice fed a high-fructose diet or regular chow. Glucose tolerance test (GTT) results in mice fed a high-fat diet (G) or high-fructose diet (H) (n = 10). Leptin (I) and insulin (J) in plasma from mice fed a high-fat diet or a high-fructose diet (n = 8). (K) H&E staining of adipose tissues from mice fed normal chow, a high-fat diet, or a high-fructose diet. The data, which are shown as the mean ± SEM, were analyzed by the Student t test (*P < 0.05 vs. the corresponding WT value).
Increased DNA Breaks and DNA Damage Response in Pol η−/− Mice.
To our knowledge, there is no information in the literature as to how a deficiency of a DNA lesion bypass polymerase causes metabolic abnormalities. Autopsy and histopathological analysis indicated that visceral adipose tissue accumulation was the most prominent change in major organs between pol η−/− and WT mice (Fig. 1 A–C). In addition to its vital role in energy storage, adipose tissue plays essential roles in the immune response and the secretion of hormones and cytokines. Adipose tissue is closely associated with metabolic dysfunction, inflammation, and aging-related health issues.
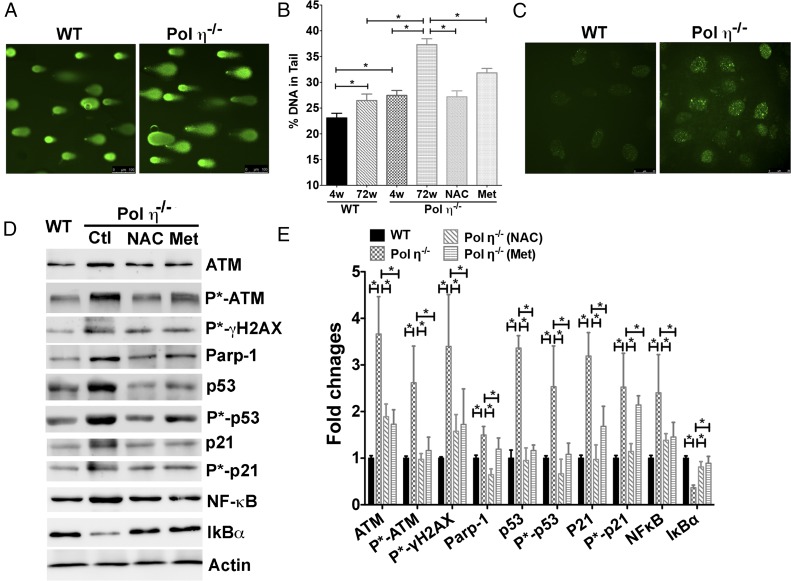
Previous studies demonstrated that ROS are selectively increased in the adipose tissue in obese mice (19), which implies a higher amount of DNA damage in adipose tissue and a potential linkage between oxidative DNA damage, fat accumulation, and obesity. However, it is not clear whether increased DNA damage can be a causal factor for obesity development. We therefore postulated that increased genome instability in adipose tissues, due to pol η ablation, leads to the development of the observed metabolic disorders in pol η−/− mice. To test this hypothesis, an alkaline comet assay was performed, and, indeed, the results indicated greater DNA damage in pol η−/− adipocytes as early as 4 wk of age compared with pol η−/− adipocytes from WT mice of the same age (Fig. 2 A and B). These results were further supported by increased staining of 8-oxoG (13) and a higher amount of DNA double-strand breaks, as indicated by phosphorylated γH2AX (20) in the adipose tissue from pol η−/− mice (Fig. 2 C–E and Fig. S4). Concurrently, up-regulation of DNA damage response proteins, including ATM, poly[ADP-ribose] polymerase 1 (PARP-1), p53, and p21, at the protein, mRNA, and phosphorylation levels, was observed in adipocytes from pol η−/− mice (Fig. 2 D and E and Fig. S5A).
Fig. 2.
Elevated DNA damage and DNA damage responses in the adipocytes from pol η−/− mice. (A) Alkaline comet assay. (Scale bars: 100 μM.) (B) Quantitation of comet assay (n = 200). (C) Immunofluorescence staining of phosphorylated γH2AX. (Scale bars: 25 μM.) DNA damage protein expression (D) and quantitation (E) in WT, pol η−/− adipocyte control (Ctl), and pol η−/− adipocytes treated with NAC or Met (n = 6). The data, which are shown as the mean ± SEM, were analyzed by one-way ANOVA (*P < 0.05).
Fig. S4.
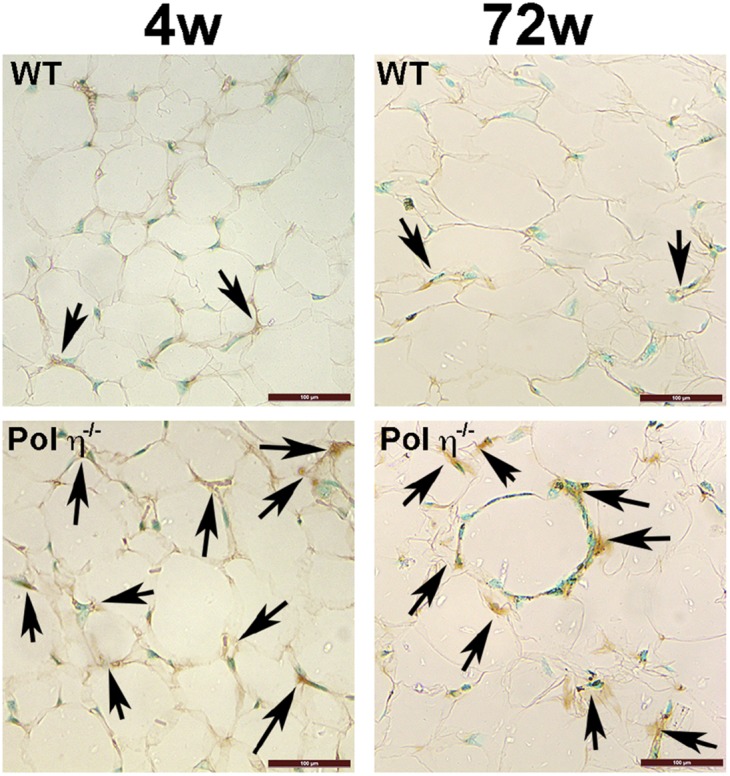
Immunohistochemistry of 8-oxoG (arrows) in adipose specimens from WT and pol η−/− mice. (Scale bars: 100 μM.)
Fig. S5.
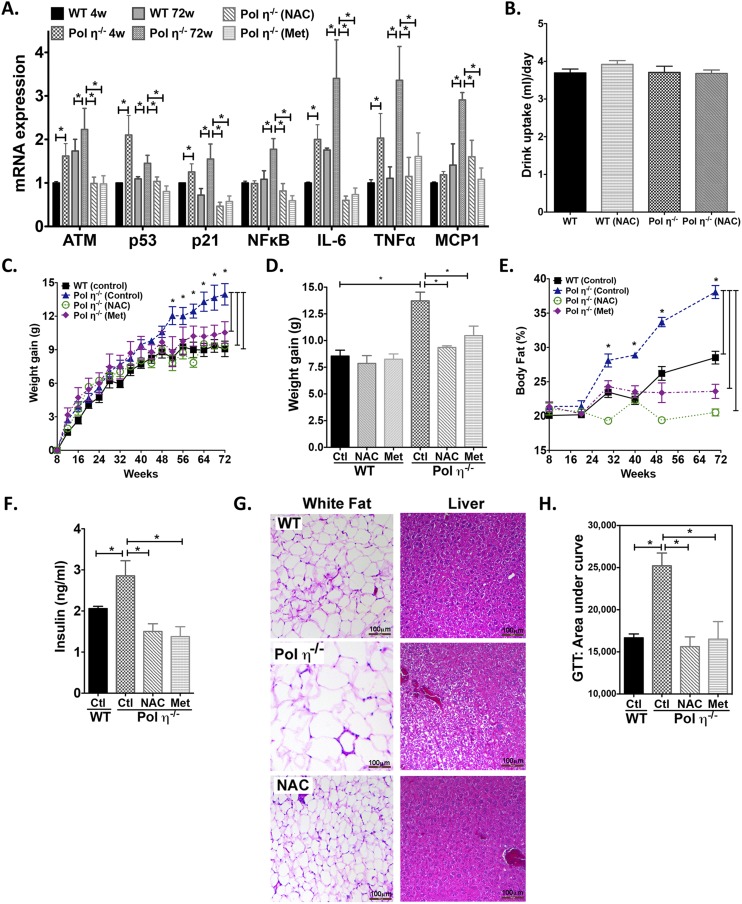
NAC and Met suppressed DNA damage and metabolic abnormalities in pol η−/− mice. (A) mRNA expression of ATM, p53, p21, NF-κB, IL-6, TNF-α, and MCP-1 in the adipocytes of 4- and 72-wk-old mice treated with NAC or Met. (B) Drinking water uptake of WT and Pol η−/− mice fed a regular chow diet with or without NAC. NAC and Met suppressed body weight gain (C and D), body fat (E), plasma insulin (F), hypertrophy and hepatic steatosis (G), and glucose intolerance (H) (n = 10). Ctl, control. The data, which are shown as the mean ± SEM, were analyzed by one-way ANOVA (*P < 0.05 vs. the corresponding control value of 72-wk-old mice).
Activation of the DNA damage response has been demonstrated to up-regulate the inflammatory response through the master regulator of inflammation gene NF-κB (21). The observed up-regulation of ATM, p53, and PARP-1 in the pol η−/− mice may induce up-regulation of NF-κB via IL-6 and TNF-α (21), which would provide an explanation for the elevated inflammatory responses observed in pol η−/− mice (Fig. 1 J and K). Indeed, expression of NF-κB (p65) at both the protein and mRNA levels was higher in adipocytes from pol η−/− mice (Fig. 2 D and E and Fig. S5A). Concomitantly, the expression of IκBα, an inhibitor of NF-κB (22), was reduced (Fig. 2 D and E). These findings indicate that ablation of pol η increases the amount of DNA damage and DNA damage response, which contributes to the elevated inflammatory responses of pol η−/− mice. In addition, IL-6 and TNF-α increase oxidative stress, which is likely to induce additional DNA damage (16), and subsequently propagate a vicious cycle between DNA damage and inflammation.
DNA Damage-Mediated Adipocyte Senescence in Pol η−/− Mice.
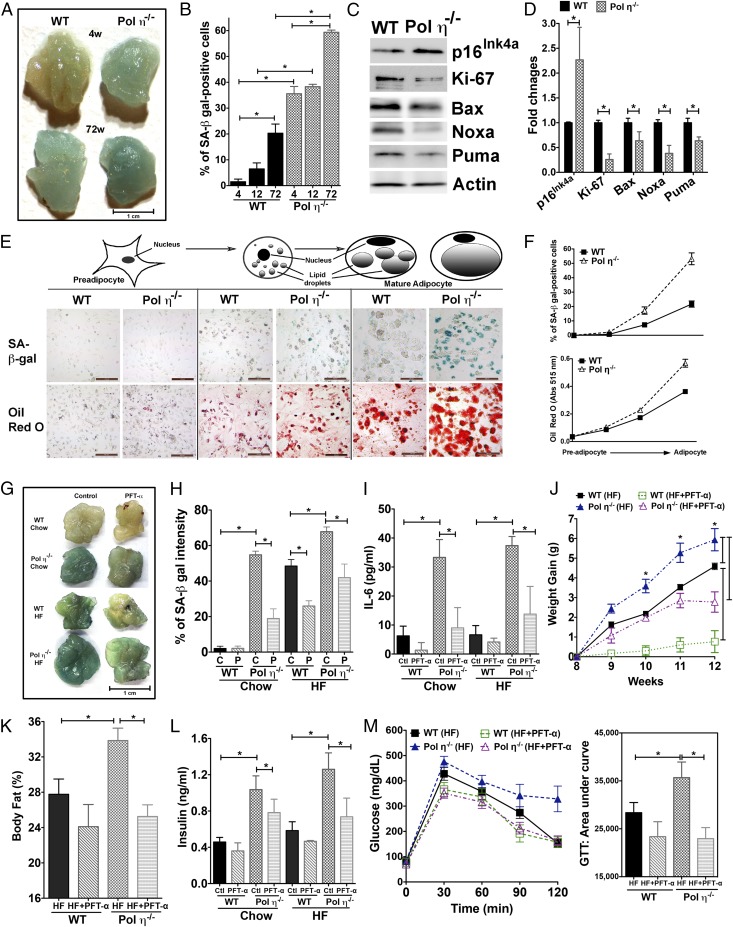
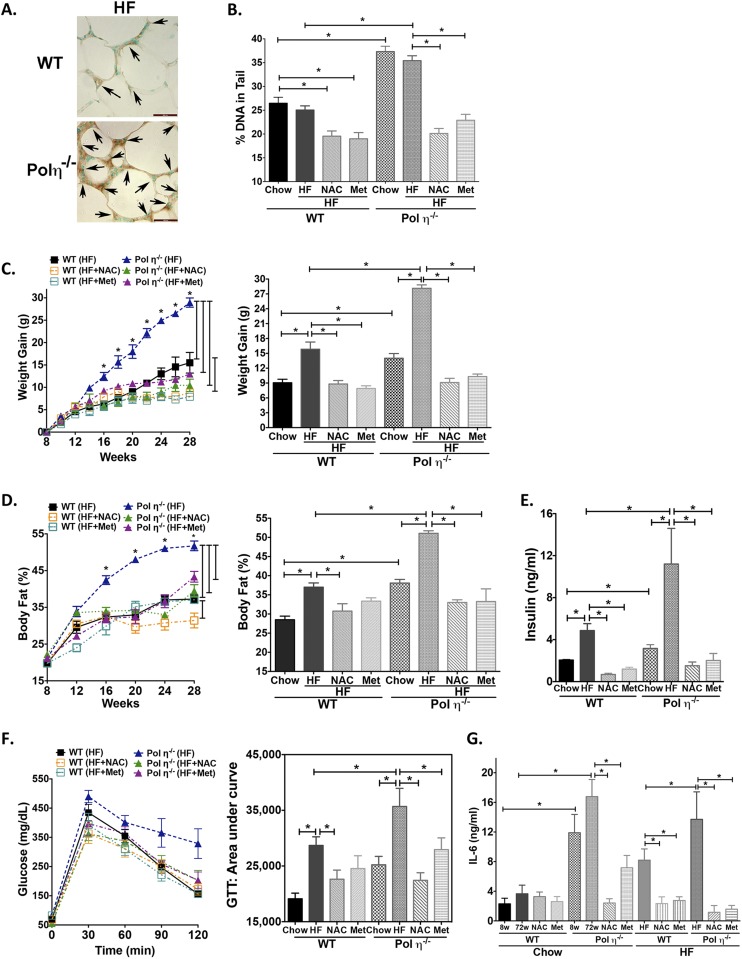
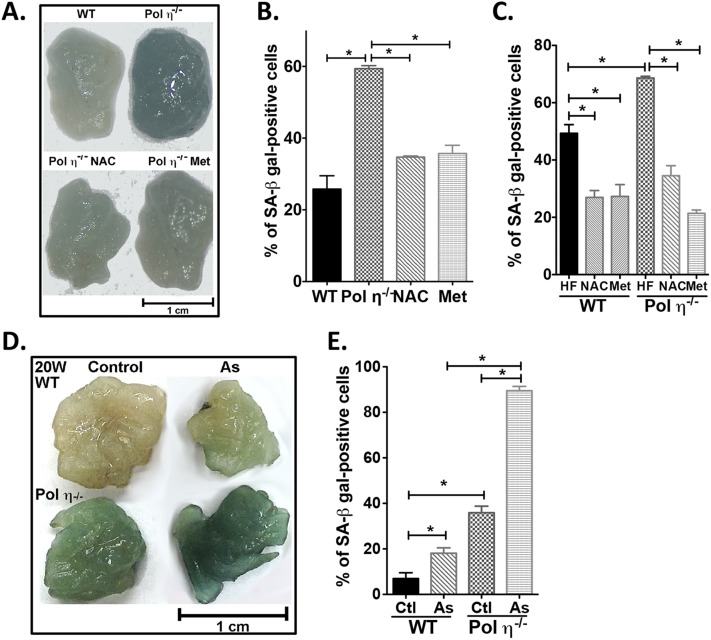
We next addressed how elevated DNA damage and inflammatory responses lead to the observed metabolic abnormalities in pol η−/− mice. As shown in Fig. 2, adipocytes from pol η−/− mice exhibited a persistently higher level of DNA damage and DNA damage response in contrast to WT mice. Persistent DNA damage is causally involved in cellular senescence (23) and in the senescence-associated secretory phenotype (SASP) that results in the secretion of inflammatory cytokines IL-6, TNF-α, and MCP-1 (24). The observed adipocyte hypertrophy; up-regulation of p53 and p21; and higher circulating levels of IL-6, TNF-α, and MCP-1 observed with pol η−/− mice are established characteristics of senescence (Figs. 1 J, K, M, and N and 2 D and E and Fig. S5A). A previous report indicated that obese human subjects have more senescent cells in their s.c. adipose tissue (25), implying a correlation between adipocyte senescence and obesity. To determine the senescent status in the adipose tissues, two cellular senescence markers, senescence-associated (SA) β-gal activity and p16Ink4a expression, were examined (25). Notably, as early as 4 wk of age, which is before the onset of obesity, and up to 72 wk of age, the adipose tissue of pol η−/− mice displayed significantly greater amounts of SA–β-gal activity and p16Ink4a expression compared with WT mice (Fig. 3 A–D). These data indicate that senescence in adipose tissue precedes the development of metabolic abnormalities in pol η−/− mice. Concomitantly, reduced expression of the proliferation marker Ki-67 and apoptosis markers Bax, Noxa, and Puma (26) was observed (Fig. 3 C and D), suggesting decreased proliferation and decreased apoptosis in the adipose tissue from pol η−/− mice compared with WT. The role of DNA damage and adipose tissue cell senescence on metabolic dysfunction was further supported by the exacerbation of the metabolic abnormalities with a high-fat diet study. The high-calorie diet produced a similar amount of DNA damage and prominent elevation of SA–β-gal activity within 20 wk compared with the regular chow diet after 72 wk in mice of both genotypes (Fig. S6).
Fig. 3.
Cellular senescence in adipose tissues and metabolic abnormalities. (A and B) SA–β-gal activity and quantitation from WT or pol η−/− mice at different ages (n = 8). (Scale bar: 1 cm.) (C and D) Expression of senescent and apoptotic proteins and quantitation (n = 6). PFT-α suppressed adipose senescence and metabolic abnormalities. (E and F) SA–β-gal activity (Top) and Oil Red O staining (Bottom) of SVF (mainly preadipocytes) and mature adipocytes through the differentiation process. (Scale bars: 200 μM.) SA–β-gal activity and quantitation (n = 6) (G and H), IL-6 (I), body weight gain (J), body fat (K), plasma insulin (L), and GTT analysis (n = 6) (M) are shown. C, control; HF, high fat; P, PFT-α.The graphical data were shown as the mean ± SEM. The data were analyzed by one-way ANOVA (*P < 0.05).
Fig. S6.
NAC and Met suppressed DNA damage and metabolic abnormalities in pol η−/− mice fed high-fat diets. (A) Immunohistochemistry of 8-oxoG (arrows) in adipose specimens from WT and pol η−/− mice fed an HF diet. (Scale bars: 100 μM.) (B) Quantitation of alkaline comet assay of the adipocytes obtained from mice fed an HF diet with NAC or Met for 20 wk (n = 200) or normal chow for 72 wk. (C) Body weight gain for mice fed a regular chow or HF diet with or without NAC. Body fat (D), plasma insulin (E), glucose intolerance (F), and plasma IL-6 level (G) are shown. The data, which are shown as the mean ± SEM (n = 10), were analyzed by one-way ANOVA (*P < 0.05 vs. the corresponding control values).
Adipose tissue consists of a complex mixture of adipocytes, preadipocytes, macrophages, neutrophils, lymphocytes, endothelial cells, and stem cells (25). The differentiation of preadipocytes into mature adipocytes plays a key role in the development of obesity (25). Because the mature adipocytes are responsible for lipid storage, we hypothesized that pol η deficiency induces senescence mainly in the mature adipocytes of adipose tissue. To test this hypothesis, we monitored the SA–β-gal activity through the differentiation of preadipocytes to mature adipocytes. Whereas no apparent SA–β-gal activity was detected in preadipocytes from mice of both genotypes, differentiation of these cells into mature adipocytes resulted in increases in SA–β-gal activity and lipid accumulation with preadipocytes from pol η−/− mice (Fig. 3 E and F). These findings suggest that mature adipocytes are the cells that become senescent and accumulate lipid in the adipose tissue of pol η−/− mice, suggesting senescent adipocytes play a causative role in the development of obesity in pol η−/− mice.
Suppression of Adipocyte Senescence Alleviates Metabolic Abnormalities.
Pol η has the ability to handle various oxidative DNA lesions, including lipid peroxidation products that impede the progression of DNA replication (13, 14). Both pol η and p53 are required for recovery from DNA damage-stalled DNA replication forks (27). In the pol η-deficient XP-V cells, p53 plays a major role in mediating the downstream cellular events in response to DNA damage (27). The observed up-regulation and activation of p53 (Fig. 2 D and E) in the adipose tissue of pol η−/− mice also support adipose senescence results (Fig. 3 A and B). More importantly, p53 activation is essential for the establishment of cell senescence in adipose tissue and required for the development of insulin resistance (28). We therefore hypothesize that suppression of p53 activity will be a reasonable approach to examine the importance of adipocyte senescence in the development of metabolic abnormalities. This hypothesis was tested with the p53 inhibitor pifithrin-α (PFT-α) (29). PFT-α treatment exhibited a more significant inhibitory effect on senescence in the adipose tissue of pol η−/− mice (Fig. 3 G–I) compared with WT mice. Similarly, PFT-α also has a more profound impact in reducing the body weight, body fat accumulation, and circulating levels of insulin, and it caused a marked improvement in glucose tolerance in pol η−/− mice (Fig. 3 J–M). These results demonstrate the importance of p53 activation in mediating adipocyte senescence and suggest a critical role of adipocyte senescence in the observed metabolic abnormalities in pol η−/− mice.
Magnitude of the DNA Damage Affects Adipocyte Senescence and Severity of Metabolic Abnormalities.
To test further whether DNA damage is causative for the development of metabolic abnormalities in pol η−/− mice, the antioxidant N-acetylcysteine (NAC) was administered to mice as a way to reduce oxidative stress and oxidative DNA lesions (30). NAC significantly reduced the amount of DNA damage, as measured by the comet assay and the activation of ATM, γ-H2AX, p53, p21, and NF-κB. NAC also attenuated adipocyte senescence and secretion of SASP IL-6, TNF-α, and MCP-1 (Fig. 2 B, D, and E and Fig. S5A), and reduced adipocyte hypertrophy. Moreover, with similar uptake (Fig. S5B), NAC attenuated and suppressed the metabolic abnormalities in pol η−/− mice with no apparent impact on the WT mice (Fig. S5 C–H). The latter is likely due to a low amount of endogenous DNA damage in the WT mice fed a regular chow diet. Similarly, administration of metformin (Met), the drug used to treat diabetes (31), also suppressed the activation of the DNA damage response, the increase in inflammatory factors, and the metabolic abnormalities in the pol η−/− mice, perhaps because it enhances antioxidant defenses and reduces inflammation (32) (Fig. 2 D and E and Fig. S5). Furthermore, both NAC and Met reduced the DNA lesions and metabolic abnormalities that were induced by a high-fat diet in both WT and pol η−/− mice (Fig. S6).
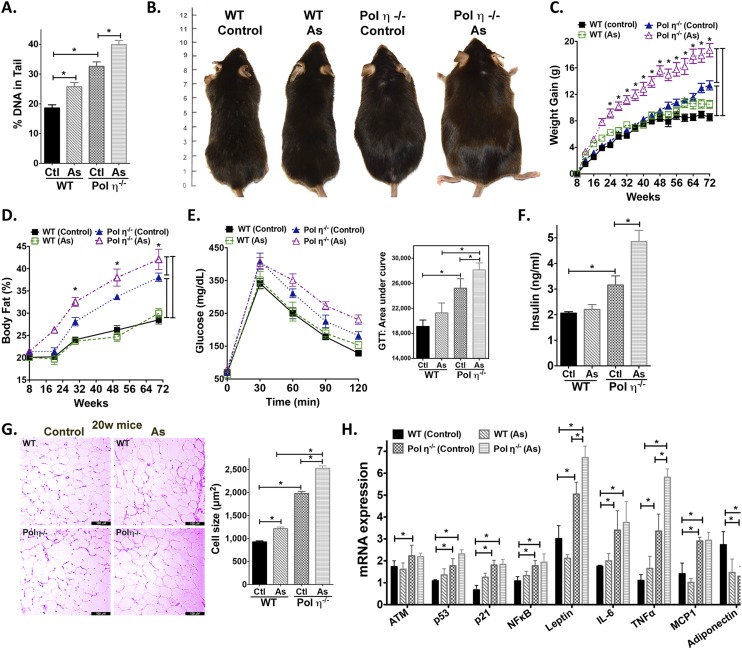
In contrast to the positive effects of antioxidants, sodium arsenite, a well-established oxidative stress inducer (33), increased DNA lesions, elevated adipocyte senescence, and promoted metabolic dysfunction in pol η−/− mice (Figs. S7 and S8). These findings support the notion that endogenous DNA damage is causative of the observed obesity and metabolic abnormalities of pol η−/− mice. The opposite effects of antioxidants (NAC or Met) (Figs. S5 and S8) and oxidative stress inducers (a high-fat diet or sodium arsenite) (Figs. S6–S8) reinforce the importance of adipocyte senescence in responding to DNA damage and the onset of metabolic abnormalities in pol η−/− mice. Notably, NAC and Met also suppressed DNA damage and the metabolic changes induced by a high-fat diet in WT mice, suggesting that metabolic abnormalities may be a general response to elevated DNA damage (Fig. S6B). In addition, because cell senescence promotes aging (25) and Met improves life span (32), our data support the evidence that Met defers the aging process (32).
Fig. S7.
Sodium arsenite increased DNA damage and exacerbated the metabolic syndrome in pol η−/− mice. (A) Quantitation of alkaline comet assay in adipocytes obtained from mice treated with sodium arsenite. Image of mice (B), body weight gain (C), body fat (D), glucose intolerance (E), plasma insulin (F), sizes of adipocytes and quantitation (G) (n = 400), and real-time PCR analysis of mRNA levels of DNA damage response proteins and cytokines in adipocytes from WT and pol η−/− mice and pol η−/− mice treated with As (H) (n = 8). (Scale bars: 100 μM.) As, sodium arsenite. The data, which are shown as the mean ± SEM, were analyzed by one-way ANOVA (*P < 0.05 vs. the corresponding control values).
Fig. S8.
NAC and Met reduce senescence, whereas sodium arsenite promotes senescence in mouse adipose tissues. (A–C) SA–β-gal activity and quantitation from WT or pol η−/− mice fed normal chow or a high-fat diet with or without NAC and Met. (D and E) SA–β-gal activity and quantitation (n = 8) from adipocytes of mice treated with or without arsenite at 20 wk of age. The graphical data are shown as the mean ± SEM. The data were analyzed by one-way ANOVA (*P < 0.05).
Impact of Pol η on Cellular Senescence and Adipogenesis Using Knockdown and Salvage Studies with Cells in Culture.
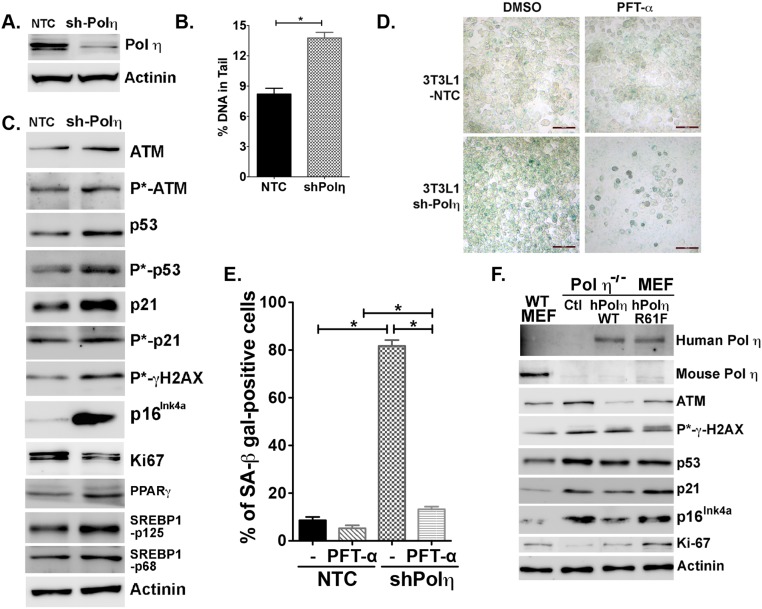
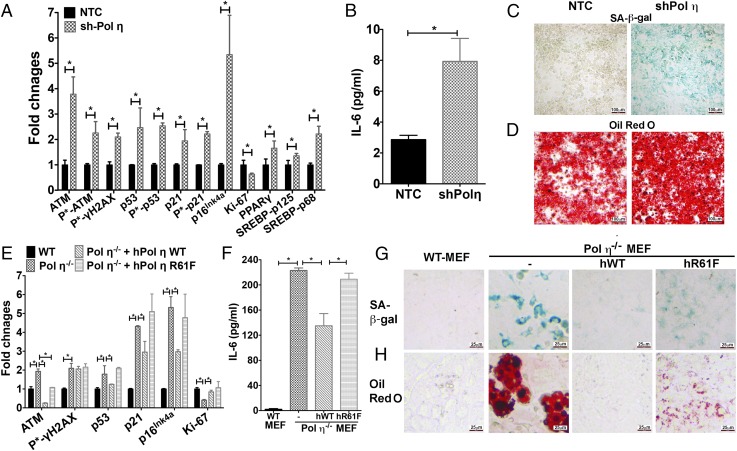
To confirm further that lack of pol η activity is responsible for the cell senescence and metabolic changes observed in pol η−/− mice, two additional systems were used. First, pol η expression was down-regulated by the transfection of pol η-specific shRNA into NIH 3T3L1 cells (3T3L1-shPol η) (Fig. S9A). The 3T3L1-shPol η cells exhibited elevated amounts of DNA damage (Fig. S9B) and increased activation of ATM, p53, p21, γ-H2AX, and p16Ink4a expression, but they exhibited reduced expression of Ki-67 (Fig. 4A and Fig. S9C), increased secretion of IL-6 (Fig. 4B), and greater activity of SA–β-gal than 3T3L1-NTC-shRNA–transfected cells (Fig. 4C). Furthermore, the elevated SA–β-gal activity in the 3T3L1-shPol η cells was suppressed by PFT-α (Fig. S9 D and E). The 3T3L1-pol η-shRNA–transfected cells also displayed up-regulated levels of SREBP1 and PPAR-γ and accumulated more lipid droplets (Fig. 4 A and D). Second, the effect of pol η was examined with a salvage study by independently transfecting pol η−/− mouse embryo fibroblast (MEF) cells with vectors that express human WT pol η or an R61F mutant form of human pol η with reduced polymerase activity (34). The expression of WT-pol η reduced the DNA damage response, secretion of IL-6, SA–β-gal activity, and accumulation of lipid droplets (Fig. 4 E–H and Fig. S9E). By contrast, the expression of the less active pol η mutant R61F (34) only partially reduced these parameters (Fig. 4 E–H and Fig. S9F). These findings suggest that the DNA lesion bypass activity of pol η protects adipocytes from early adipocyte senescence and lipid accumulation. In addition, because MEF cells were derived from embryos, the elevated amount of DNA damage and SA–β-gal activity in the primary pol η−/− MEF cells compared with WT cells further supports the notion that chronic DNA damage-mediated senescence, which occurs before the accumulation of body fat, creates conditions that lead to obesity and metabolic abnormalities.
Fig. S9.
Pol η expression, DNA damage, cell senescence, and lipid accumulation in 3T3L1 and MEF cell systems. (A) Down-regulation of pol η with a nontarget control (NTC) or anti-pol η shRNA (shPol η) in 3T3L1 cells. (B) Quantitation of the alkaline comet assay. (C) Expression of DNA damage, senescence, and adipogenic protein markers and quantitation. (D) PFT-α inhibited senescence in 3T3L1-shPol η cells. Images are on the same scale. (Scale bars: 100 μM.) Fraction of cells positive for SA–β-gal (senescent) cells (E) compared with the total number of viable cells with or without PFT-α treatment (F). Levels of pol η, DNA damage response, and senescence proteins in WT, pol η−/−, pol η−/−-hPol η WT, and pol η−/−-hPol η R61F MEF cells.
Fig. 4.
Correlation between pol η expression, DNA damage, cell senescence, and lipid accumulation in 3T3L1 and MEF cell systems. (A–D) 3T3L1cells. (A) Quantitation of expression and activation of DNA damage, senescence, and adipogenic protein markers. (B) IL-6 secretion. (C) SA–β-gal activity. (D) Oil Red O staining (n = 6). (E–H) MEF cells. (E) Quantitation of expression and activation of DNA damage, senescence, and adipogenic protein markers in WT, pol η−/−, pol η−/−-hPol η WT, and pol η−/−-hPol η R61F MEF cells. (F) IL-6 secretion (n = 6). (G) SA–β-gal activity. (H) Oil Red O staining. The images presented were in the same scale. The graphical data are shown as the mean ± SEM. The data were analyzed by the Student t test (*P < 0.05).
The association between tumorigenesis and reduced genome integrity, due to exposure to exogenous or endogenous DNA damaging agents or genetic defects in DNA repair/replication enzymes, is well documented for many tissues (35). However, the potential impact of genomic integrity on adipose tissue has received little attention, at least in part because adipose tissue tumors are usually benign. Adipose tissue is vital for energy homeostasis and serves as an essential endocrine and immune organ (25). Adipose tissue is the main site for lipid peroxidation and acts as a major “sink” to store and handle free radical-induced peroxidation products (36). Oxidative DNA lesions produced by lipid peroxidation products block DNA replicative polymerases and stall the progression of DNA replication (13, 14), which triggers cell cycle arrest and leads to different cellular responses, depending on the magnitude of DNA damage. Mild DNA damage causes temporary pausing of the cell cycle to allow the DNA repair system to repair the damage. Medium or severe DNA damage induces cellular senescence or cell death (apoptosis), which also depends on the tissue type. Our results support previous studies that have shown pol η bypasses oxidative DNA lesions (13, 14) because pol η−/− mice exhibit an increased amount of DNA lesions and elevated DNA damage responses. The increase in SA–β-gal activity; up-regulation of p53, p16, and p21; and increased SASP circulating and cellular levels of IL-6 and TNF-α that occur at a very early age in pol η−/− mice provide evidence for a causative role of adipocyte senescence in obesity and the development of insulin resistance. These results also imply that senescence is the primary response to DNA damage in adipose tissue, which may explain the low incidence of malignant cancer in adipose tissue, because cellular senescence counteracts tumorigenesis. Although increased inflammatory responses, including infiltration of macrophages into the adipose tissue and increased levels of IL-6 or TNF-α, are commonly observed in adipose tissue from obese subjects or mouse models (37), these observations may be a consequential phenomenon, because tissue samples were harvested from subjects or mice with an established obesity phenotype. Deficiency of the DNA repair enzyme Neil1 or OGG1 also induces the metabolic syndrome and obesity in mice (3, 4), at least in part because of impaired mitochondrial function due to DNA damage (3, 4). Given the essential role of mitochondria in energy and ROS production, it will be worthwhile to investigate the mitochondrial function of these DNA repair/replication mice at different ages to understand its correlation with the development of the metabolic syndrome.
In summary, our findings suggest that pol η plays an important role in maintaining genome stability and preventing cellular senescence in adipose tissue. This study extends the function of pol η from its established role in suppressing tumorigenesis in sun-exposed skin to reducing the negative effects of endogenous DNA damage on adipose tissue metabolism. It would be important to investigate the detailed mechanisms of how the deficiency of pol η increased DNA damage in adipose tissue and the types of lesions that contribute to the observed metabolic abnormalities. It is not clear from the available literature whether patients with XP-V are prone to the development of obesity and the metabolic syndrome. Given that variation in the expression level of the XP-V gene affects the sensitivity to DNA-damaging agents in various tissues (10, 38–40), an epidemiological study will be necessary to examine the correlation between the pol η expression level and the metabolic syndrome. In addition to pol η, other translesion synthesis polymerases have been shown to handle various types of DNA lesions (41), and it will be interesting to determine whether KO mice for other lesion bypass polymerases are prone to obesity and metabolic abnormalities. The current results also suggest that senescence in adipose tissue caused by chronic DNA damage plays a causative role in the development of metabolic abnormalities. Our data with mice suggest that adipocyte senescence plays an important role in the development of obesity. Because senescent preadipocytes are present in severely obese subjects (25), the molecular mechanism responsible for senescence cells in adipose tissue requires additional study. Our model of adipose tissue senescence and obesity due to DNA damage provides an additional testable paradigm for other DNA repair enzyme-deficient mice that develop obesity, such as Neil1 and OGG1 (3, 4).
Studies have been conducted with pol η−/− mice to determine the importance of pol η on mutation frequency, carcinogenesis, and somatic hypermutation of Ig genes (42–44). Most of the studies were performed with mice at an age (2–6 mo) at which the metabolic abnormalities observed in the present study could have been easily missed (42–44). Mice were followed for 24 mo in one study, but the focus was on mutagenesis, and neither body weights nor metabolic abnormalities were reported (45). The metabolic abnormalities that occur in pol η−/− mice develop with age, and the phenotype is less severely affected than in the leptin-deficient (ob/ob) or leptin-receptor–mutated (db/db) mouse model (46, 47). The findings with pol η−/− mice suggest that the vulnerability for metabolic abnormalities is increased by a loss of genome integrity with age. Our findings also suggest that DNA damage-induced adipocyte senescence and metabolic abnormalities are not limited to genetic defects due to DNA damage repair or response enzymes. A high-fat or high-sugar diet and environmental toxicants that have a direct or indirect impact on genome integrity may also cause obesity and the metabolic syndrome by inducing DNA damage and adipocyte senescence. On the other hand, diets that are rich in antioxidant components may prevent oxidative DNA lesions and the development of senescent adipocytes, which may prevent the development of obesity and the metabolic syndrome in response to proinflammatory diets and environmental toxins. These findings, together with other DNA repair enzyme-defective mouse models (3, 4, 6–8), suggest that reduction of genome integrity, regardless of whether it is induced by defective DNA repair or exogenous agents, contributes causatively to the development of the metabolic syndrome. Given that most people become overweight or moderately obese with age rather than severely obese (48), the mechanistic relationship between loss of genome integrity and development of the metabolic syndrome with age needs to be further studied. New insight may also be gained into the apparent link between obesity and cancer.
Materials and Methods
Animals.
All animal experimental protocols were approved by the Institutional Animal Care and Use Committee, Indiana University School of Medicine. WT C57BL/6 mice were purchased from The Jackson Laboratory. Pol η−/− mice were obtained from the National Cancer Institute (B6;129-Polhtm1Rak/NCI) and backcrossed for 12 generations with WT C57BL/6 mice. All experiments were conducted with male littermates maintained in the animal facility at 25 °C with a 12-h light/dark cycle. For body weight gain and body fat percentage measurements, mice were weighed weekly, and weight gain was calculated by subtracting the original weight at 8 wk of age from the weight of the individual mice. Body fat content was analyzed using dual-energy X-ray absorptiometry scanning (PIXImus β mouse densitometer; Lunar Corp.). Treatments were started when mice were 8 wk of age, with a normal chow diet, high-fat diet (Harlan Laboratories, Inc.), or high-fructose diet (normal chow with 20% fructose in drinking water). Agents, including NAC (1 mg/mL; wt/vol), Met (1.5 mg/mL; wt/vol), or sodium arsenite (2.5 mg/L; wt/vol), were administered through the drinking water. PFT-α (2.2 mg/kg; wt/body wt; Sigma–Aldrich) was injected i.p. three times a week for 4 wk. For histological analysis, mice were euthanized with CO2, and tissues were harvested and fixed in 4% paraformaldehyde (PFA). Samples were subjected to H&E staining for visualization. The cross-sectional area of fat tissue was used to measure the size of adipocytes utilizing ImageJ software (NIH). For Oil Red O staining, fresh liver tissue was immersed and frozen in optimal cutting temperature compound, followed by sectioning and staining with Oil Red O and Harris hematoxylin (49). For energy expenditure measurement, mice were individually housed in metabolic chambers (Lab Master; TSE Systems). Oxygen consumption, respiratory exchange ratio, and food/drink intake were recorded and calculated as previously described (50, 51).
Blood Glucose and Glucose Tolerance Test.
Mice were fasted overnight before a glucose tolerance test was performed. Blood glucose was measured using a glucometer (Contour; Bayer Healthcare) at 0, 30, 60, 90, and 120 min after i.p. injection of glucose (2 mg/g). The data were analyzed by one-way ANOVA using GraphPad Prism 5.0 software (GraphPad Software), and the area under the curve was calculated by the trapezoid method.
ELISA.
Mice were fasted overnight, and plasma samples were collected from a facial vein for ELISA analyses using ultrasensitive mouse leptin and insulin ELISA kits (Crystal Chem, Inc.). The mouse IL-6 and TNF-α kits were purchased from Biolegend, Inc., and the mouse adiponectin ELISA kit was obtained from Life Technologies Invitrogen. The HOMA-IR was calculated from the product of fasting insulin concentration (micro-international units per milliliter) and plasma glucose (milligrams per deciliter) divided by 405 (52).
Isolation of Adipocytes and Macrophage Detection.
Briefly, collected fat pads were minced and digested with type I collagenase before centrifugation using similar procedures as described (53). The pellet is the stromal vascular fraction (SVF), and the floating cells were collected as the mature adipocyte fraction. The mature adipocyte fraction was collected and incubated with Alexa Fluor 488-conjugated anti-mouse F4/80 and R-PE–conjugated anti-mouse CD11b (Molecular Probes, Life Technologies) before being analyzed by flow cytometry (FACSCalibur; BD Biosciences). Cells stained with both F4/80+ and CD11b+ were defined as the macrophage fraction. The amount of macrophages was calculated as the percentage of F4/80+/CD11b+ among all live cells.
Preparation of Protein Lysates and mRNA for Real-Time PCR.
Adipose tissues were homogenized with modified radioimmunoprecipitation assay buffer, followed by centrifugation at 4 °C. The fat layer was removed, and cell lysates were subjected to Western blot analysis. Total RNA was isolated from mature adipose tissue fractions using TRIzol (Molecular Research Center, Inc.), and cDNA was prepared using a QuantiTect Reverse Transcription kit and a QuantiFast SYBR Green PCR kit (both from Qiagen). Real-time PCR was performed using a StepOne Plus Real-Time PCR System (Applied Biosystems). The mouse primers were designed and validated using a QuantiTect Primer Assay System (Qiagen). Relative mRNA expression represents the target gene mRNA level compared with the corresponding control mRNA level.
Western Blot Analysis and Immunofluorescence Staining.
Whole-cell lysates (50 μg) were resolved by SDS/PAGE and transferred onto nitrocellulose membranes (Bio-Rad) before being incubated with primary antibodies, followed by addition of HRP-conjugated secondary antibody (Jackson Immuno Research Lab). Specific proteins were detected using SuperSignal West Femto chemiluminescence substrates (Thermo Scientific) and documented with a Fujifilm LAS-4000 Image Analyzer (GE Life Science). The primary antibodies used for Western blotting were the following anti-mouse antibodies: anti-ATM, anti–phospho-γ-H2AX, and anti–Parp-1 antibodies from Cell Signaling Technology; anti–phospho-ATM (Ser1981) and anti–Ki-67 antibodies from Millipore; anti-p53, anti–phospho-p53 (Ser15), anti-p21, anti–phospho-p21, anti–PPAR-γ, anti-Bax, anti-Noxa, anti-Puma, anti-Actinin, and anti-Actin antibodies from Sigma–Aldrich; and anti-p16Ink4a from Abcam; anti–SREBP1-p68, anti–SREBP1-p125, anti–NF-κB-p65, anti–phospho-NF-κB-p65, anti-IκBα, and anti–phospho-IκBα antibodies from Santa Cruz Biotechnology. The samples derived from the same experiment, and the blots were processed in parallel. Loading controls, positive and negative controls, and molecular markers were run on the same blot, and the loading controls were used for normalization. The quantitation of protein expression represents relative protein level compared with the corresponding control after normalization with actin or actinin (ImageJ software). Blots are representative of six independent experiments. For immunofluorescence staining, cells were fixed with 4% PFA, followed by incubation in permeabilization buffer (0.5% saponin, 0.1% BSA, and 1% NaN3 in PBS). The cells were then stained with rabbit anti-mouse phospho-γ-H2AX and DyLight488–anti-rabbit IgG (Jackson Immune Research laboratory) before monitoring under a Leica florescence microscope (Leica DMI6000B) using Leica imaging LAS.AF software. The images represent results from four independent experiments.
Single-Cell Gel Electrophoresis Assay (Comet Assay) and Immunohistochemistry.
Adipocytes isolated from the adipose tissue of WT and pol η−/− mice (53) were subjected to a single-cell gel electrophoresis assay (Trevigen, Inc.). The data, which were analyzed by CometScore 1.5 software (Triek Corp.), are presented as the percentage of DNA in the tail. For detection of 8-oxoG, the fixed adipose tissue sections were deparaffinized and rehydrated before being incubated with mouse anti–8-oxoG antibody (Trevigen, Inc.), followed by incubation with biotin-conjugated anti-mouse IgG. The 3.3′-diaminobenzidine (Thermo Scientific) reaction was used to visualize the bound secondary antibody. The sections were counterstained with methyl green for the cell nucleus. Images were acquired using a Leica microscope (DM2500) and Leica imaging LAS software.
SA–β-Gal Staining and Apoptosis Assessment.
SA–β-gal activity in visceral adipose tissues from WT and pol η−/− mice was determined using an SA–β-gal staining kit from Cell Signaling Technology. The percentage of cells positive for SA–β-gal was quantitated as described previously (28).
Cell Culture.
Murine 3T3-L1 cells (American Type Culture Collection) were transfected with nontarget shRNA control or shRNA (Sigma–Aldrich) to generate 3T3L1-NTC and 3T3-sh-pol η cell lines. Embryos from WT and pol η−/− mice were harvested on day 13.5 for the generation of MEF cells (54). The established pol η−/− MEF cells were transfected with either WT human pol η (hPol η WT) or the R61F mutant form of human pol η (hPol η R61F) (55). The protein expression level of pol η was examined by Western blot analysis with anti-human or anti-mouse pol η antibodies from Biorbyt. The harvested SVF cells from mice adipose tissue, 3T3L1 transfectants, and MEF cells were cultured and differentiated into adipocytes (56), and then examined for SA–β-gal staining and Oil Red O staining.
Statistical Analyses.
The staining images and blots represent results from four to six independent experiments. The graphical data, which are shown as the mean ± SEM, were analyzed by one-way ANOVA for multiple comparison tests or by the Student t test for individual pairwise comparisons. The threshold for statistical significance was P < 0.05 vs. the corresponding control values. Analyses were performed with statistical software (GraphPad Prism 5.0).
Acknowledgments
We thank Dr. Richard Honkanen (University of South Alabama) for suggestions and comments during the study. This study was supported, in part, by NIH Grant R01 CA 112446 (to K.-m.C.) and a Veterans Affairs Merit Award (to R.A.H.).
Footnotes
The authors declare no conflict of interest.
This article is a PNAS Direct Submission.
This article contains supporting information online at www.pnas.org/lookup/suppl/doi:10.1073/pnas.1506954112/-/DCSupplemental.
References
- 1.Korwek Z, Alster O. 2014. [The role of the DNA damage response in apoptosis and cell senescence.] Postepy Biochem 60(2):248–262. Polish.
- 2.Ishida T, Ishida M, Tashiro S, Yoshizumi M, Kihara Y. 2014. Role of DNA damage in cardiovascular disease. Circ J 78(1):42–50.
- 3.Vartanian V, et al. The metabolic syndrome resulting from a knockout of the NEIL1 DNA glycosylase. Proc Natl Acad Sci USA. 2006;103(6):1864–1869. doi: 10.1073/pnas.0507444103. [DOI] [PMC free article] [PubMed] [Google Scholar]
- 4.Sampath H, et al. 8-Oxoguanine DNA glycosylase (OGG1) deficiency increases susceptibility to obesity and metabolic dysfunction. PLoS One. 2012;7(12):e51697. doi: 10.1371/journal.pone.0051697. [DOI] [PMC free article] [PubMed] [Google Scholar]
- 5.Sampath H, et al. Variable penetrance of metabolic phenotypes and development of high-fat diet-induced adiposity in NEIL1-deficient mice. Am J Physiol Endocrinol Metab. 2011;300(4):E724–E734. doi: 10.1152/ajpendo.00387.2010. [DOI] [PMC free article] [PubMed] [Google Scholar]
- 6.Karakasilioti I, et al. DNA damage triggers a chronic autoinflammatory response, leading to fat depletion in NER progeria. Cell Metab. 2013;18(3):403–415. doi: 10.1016/j.cmet.2013.08.011. [DOI] [PMC free article] [PubMed] [Google Scholar]
- 7.Schneider JG, et al. ATM-dependent suppression of stress signaling reduces vascular disease in metabolic syndrome. Cell Metab. 2006;4(5):377–389. doi: 10.1016/j.cmet.2006.10.002. [DOI] [PubMed] [Google Scholar]
- 8.Fang EF, et al. Defective mitophagy in XPA via PARP-1 hyperactivation and NAD(+)/SIRT1 reduction. Cell. 2014;157(4):882–896. doi: 10.1016/j.cell.2014.03.026. [DOI] [PMC free article] [PubMed] [Google Scholar]
- 9.Masutani C, et al. Xeroderma pigmentosum variant (XP-V) correcting protein from HeLa cells has a thymine dimer bypass DNA polymerase activity. EMBO J. 1999;18(12):3491–3501. doi: 10.1093/emboj/18.12.3491. [DOI] [PMC free article] [PubMed] [Google Scholar]
- 10.Thakur M, et al. DNA polymerase eta undergoes alternative splicing, protects against UV sensitivity and apoptosis, and suppresses Mre11-dependent recombination. Genes Chromosomes Cancer. 2001;32(3):222–235. doi: 10.1002/gcc.1186. [DOI] [PubMed] [Google Scholar]
- 11.Chen YW, Cleaver JE, Hanaoka F, Chang CF, Chou KM. A novel role of DNA polymerase eta in modulating cellular sensitivity to chemotherapeutic agents. Mol Cancer Res. 2006;4(4):257–265. doi: 10.1158/1541-7786.MCR-05-0118. [DOI] [PubMed] [Google Scholar]
- 12.Rey L, et al. Human DNA polymerase eta is required for common fragile site stability during unperturbed DNA replication. Mol Cell Biol. 2009;29(12):3344–3354. doi: 10.1128/MCB.00115-09. [DOI] [PMC free article] [PubMed] [Google Scholar]
- 13.Haracska L, Yu SL, Johnson RE, Prakash L, Prakash S. Efficient and accurate replication in the presence of 7,8-dihydro-8-oxoguanine by DNA polymerase eta. Nat Genet. 2000;25(4):458–461. doi: 10.1038/78169. [DOI] [PubMed] [Google Scholar]
- 14.Yang IY, Hashimoto K, de Wind N, Blair IA, Moriya M. Two distinct translesion synthesis pathways across a lipid peroxidation-derived DNA adduct in mammalian cells. J Biol Chem. 2009;284(1):191–198. doi: 10.1074/jbc.M806414200. [DOI] [PMC free article] [PubMed] [Google Scholar]
- 15.Lin Q, et al. Increased susceptibility to UV-induced skin carcinogenesis in polymerase eta-deficient mice. Cancer Res. 2006;66(1):87–94. doi: 10.1158/0008-5472.CAN-05-1862. [DOI] [PubMed] [Google Scholar]
- 16.Sell H, Habich C, Eckel J. Adaptive immunity in obesity and insulin resistance. Nat Rev Endocrinol. 2012;8(12):709–716. doi: 10.1038/nrendo.2012.114. [DOI] [PubMed] [Google Scholar]
- 17.Austyn JM, Gordon S. F4/80, a monoclonal antibody directed specifically against the mouse macrophage. Eur J Immunol. 1981;11(10):805–815. doi: 10.1002/eji.1830111013. [DOI] [PubMed] [Google Scholar]
- 18.Miard S, Fajas L. Atypical transcriptional regulators and cofactors of PPARgamma. Int J Obes. 2005;29(Suppl 1):S10–S12. doi: 10.1038/sj.ijo.0802906. [DOI] [PubMed] [Google Scholar]
- 19.Furukawa S, et al. Increased oxidative stress in obesity and its impact on metabolic syndrome. J Clin Invest. 2004;114(12):1752–1761. doi: 10.1172/JCI21625. [DOI] [PMC free article] [PubMed] [Google Scholar]
- 20.Burma S, Chen BP, Murphy M, Kurimasa A, Chen DJ. ATM phosphorylates histone H2AX in response to DNA double-strand breaks. J Biol Chem. 2001;276(45):42462–42467. doi: 10.1074/jbc.C100466200. [DOI] [PubMed] [Google Scholar]
- 21.Piret B, Schoonbroodt S, Piette J. The ATM protein is required for sustained activation of NF-kappaB following DNA damage. Oncogene. 1999;18(13):2261–2271. doi: 10.1038/sj.onc.1202541. [DOI] [PubMed] [Google Scholar]
- 22.Jacobs MD, Harrison SC. Structure of an IkappaBalpha/NF-kappaB complex. Cell. 1998;95(6):749–758. doi: 10.1016/s0092-8674(00)81698-0. [DOI] [PubMed] [Google Scholar]
- 23.Fumagalli M, Rossiello F, Mondello C, d’Adda di Fagagna F. Stable cellular senescence is associated with persistent DDR activation. PLoS One. 2014;9(10):e110969. doi: 10.1371/journal.pone.0110969. [DOI] [PMC free article] [PubMed] [Google Scholar]
- 24.Rodier F, et al. 2009. Persistent DNA damage signalling triggers senescence-associated inflammatory cytokine secretion. Nat Cell Biol 11(8):973–979, and correction (2009) 10:1272.
- 25.Tchkonia T, et al. Fat tissue, aging, and cellular senescence. Aging Cell. 2010;9(5):667–684. doi: 10.1111/j.1474-9726.2010.00608.x. [DOI] [PMC free article] [PubMed] [Google Scholar]
- 26.Athar M, Back JH, Kopelovich L, Bickers DR, Kim AL. Multiple molecular targets of resveratrol: Anti-carcinogenic mechanisms. Arch Biochem Biophys. 2009;486(2):95–102. doi: 10.1016/j.abb.2009.01.018. [DOI] [PMC free article] [PubMed] [Google Scholar]
- 27.Cleaver JE, et al. Polymerase eta and p53 jointly regulate cell survival, apoptosis and Mre11 recombination during S phase checkpoint arrest after UV irradiation. DNA Repair (Amst) 2002;1(1):41–57. doi: 10.1016/s1568-7864(01)00004-0. [DOI] [PubMed] [Google Scholar]
- 28.Minamino T, et al. A crucial role for adipose tissue p53 in the regulation of insulin resistance. Nat Med. 2009;15(9):1082–1087. doi: 10.1038/nm.2014. [DOI] [PubMed] [Google Scholar]
- 29.Komarov PG, et al. A chemical inhibitor of p53 that protects mice from the side effects of cancer therapy. Science. 1999;285(5434):1733–1737. doi: 10.1126/science.285.5434.1733. [DOI] [PubMed] [Google Scholar]
- 30.De Flora S, Izzotti A, D’Agostini F, Balansky RM. Mechanisms of N-acetylcysteine in the prevention of DNA damage and cancer, with special reference to smoking-related end-points. Carcinogenesis. 2001;22(7):999–1013. doi: 10.1093/carcin/22.7.999. [DOI] [PubMed] [Google Scholar]
- 31.Rojas LB, Gomes MB. Metformin: An old but still the best treatment for type 2 diabetes. Diabetol Metab Syndr. 2013;5(1):6. doi: 10.1186/1758-5996-5-6. [DOI] [PMC free article] [PubMed] [Google Scholar]
- 32.Martin-Montalvo A, et al. Metformin improves healthspan and lifespan in mice. Nat Commun. 2013;4:2192. doi: 10.1038/ncomms3192. [DOI] [PMC free article] [PubMed] [Google Scholar]
- 33.Flora SJ. Arsenic-induced oxidative stress and its reversibility. Free Radic Biol Med. 2011;51(2):257–281. doi: 10.1016/j.freeradbiomed.2011.04.008. [DOI] [PubMed] [Google Scholar]
- 34.Katafuchi A, et al. Critical amino acids in human DNA polymerases eta and kappa involved in erroneous incorporation of oxidized nucleotides. Nucleic Acids Res. 2010;38(3):859–867. doi: 10.1093/nar/gkp1095. [DOI] [PMC free article] [PubMed] [Google Scholar]
- 35.Bartsch H, Dally H, Popanda O, Risch A, Schmezer P. Genetic risk profiles for cancer susceptibility and therapy response. Recent Results Cancer Res. 2007;174:19–36. doi: 10.1007/978-3-540-37696-5_2. [DOI] [PubMed] [Google Scholar]
- 36.Murdolo G, et al. Oxidative stress and lipid peroxidation by-products at the crossroad between adipose organ dysregulation and obesity-linked insulin resistance. Biochimie. 2013;95(3):585–594. doi: 10.1016/j.biochi.2012.12.014. [DOI] [PubMed] [Google Scholar]
- 37.Bai Y, Sun Q. Macrophage recruitment in obese adipose tissue. Obes Rev. 2015;16(2):127–136. doi: 10.1111/obr.12242. [DOI] [PMC free article] [PubMed] [Google Scholar]
- 38.Zhou W, et al. Expression of DNA translesion synthesis polymerase η in head and neck squamous cell cancer predicts resistance to gemcitabine and cisplatin-based chemotherapy. PLoS One. 2013;8(12):e83978. doi: 10.1371/journal.pone.0083978. [DOI] [PMC free article] [PubMed] [Google Scholar]
- 39.Teng KY, et al. DNA polymerase η protein expression predicts treatment response and survival of metastatic gastric adenocarcinoma patients treated with oxaliplatin-based chemotherapy. J Transl Med. 2010;8:126. doi: 10.1186/1479-5876-8-126. [DOI] [PMC free article] [PubMed] [Google Scholar]
- 40.Ceppi P, et al. 2009. Polymerase eta mRNA expression predicts survival of non-small cell lung cancer patients treated with platinum-based chemotherapy. Clin Cancer Res 15(3):1039–1045.
- 41.Broyde S, Wang L, Rechkoblit O, Geacintov NE, Patel DJ. Lesion processing: High-fidelity versus lesion-bypass DNA polymerases. Trends Biochem Sci. 2008;33(5):209–219. doi: 10.1016/j.tibs.2008.02.004. [DOI] [PMC free article] [PubMed] [Google Scholar]
- 42.Delbos F, Aoufouchi S, Faili A, Weill JC, Reynaud CA. DNA polymerase eta is the sole contributor of A/T modifications during immunoglobulin gene hypermutation in the mouse. J Exp Med. 2007;204(1):17–23. doi: 10.1084/jem.20062131. [DOI] [PMC free article] [PubMed] [Google Scholar]
- 43.Martomo SA, Saribasak H, Yokoi M, Hanaoka F, Gearhart PJ. Reevaluation of the role of DNA polymerase theta in somatic hypermutation of immunoglobulin genes. DNA Repair (Amst) 2008;7(9):1603–1608. doi: 10.1016/j.dnarep.2008.04.002. [DOI] [PMC free article] [PubMed] [Google Scholar]
- 44.Stallons LJ, McGregor WG. Translesion synthesis polymerases in the prevention and promotion of carcinogenesis. J Nucleic Acids. 2010 doi: 10.4061/2010/643857. [DOI] [PMC free article] [PubMed] [Google Scholar]
- 45.Busuttil RA, Lin Q, Stambrook PJ, Kucherlapati R, Vijg J. Mutation frequencies and spectra in DNA polymerase eta-deficient mice. Cancer Res. 2008;68(7):2081–2084. doi: 10.1158/0008-5472.CAN-07-6274. [DOI] [PubMed] [Google Scholar]
- 46.Chen H, et al. Evidence that the diabetes gene encodes the leptin receptor: Identification of a mutation in the leptin receptor gene in db/db mice. Cell. 1996;84(3):491–495. doi: 10.1016/s0092-8674(00)81294-5. [DOI] [PubMed] [Google Scholar]
- 47.Pelleymounter MA, et al. Effects of the obese gene product on body weight regulation in ob/ob mice. Science. 1995;269(5223):540–543. doi: 10.1126/science.7624776. [DOI] [PubMed] [Google Scholar]
- 48.Finkelstein EA, et al. Obesity and severe obesity forecasts through 2030. Am J Prev Med. 2012;42(6):563–570. doi: 10.1016/j.amepre.2011.10.026. [DOI] [PubMed] [Google Scholar]
- 49.Novikoff AB, Novikoff PM, Rosen OM, Rubin CS. Organelle relationships in cultured 3T3-L1 preadipocytes. J Cell Biol. 1980;87(1):180–196. doi: 10.1083/jcb.87.1.180. [DOI] [PMC free article] [PubMed] [Google Scholar]
- 50.Weir JB. New methods for calculating metabolic rate with special reference to protein metabolism. J Physiol. 1949;109(1-2):1–9. doi: 10.1113/jphysiol.1949.sp004363. [DOI] [PMC free article] [PubMed] [Google Scholar]
- 51.Bruss MD, Khambatta CF, Ruby MA, Aggarwal I, Hellerstein MK. Calorie restriction increases fatty acid synthesis and whole body fat oxidation rates. Am J Physiol Endocrinol Metab. 2010;298(1):E108–E116. doi: 10.1152/ajpendo.00524.2009. [DOI] [PMC free article] [PubMed] [Google Scholar]
- 52.Matthews DR, et al. Homeostasis model assessment: Insulin resistance and beta-cell function from fasting plasma glucose and insulin concentrations in man. Diabetologia. 1985;28(7):412–419. doi: 10.1007/BF00280883. [DOI] [PubMed] [Google Scholar]
- 53.Fernyhough ME, et al. Primary adipocyte culture: Adipocyte purification methods may lead to a new understanding of adipose tissue growth and development. Cytotechnology. 2004;46(2-3):163–172. doi: 10.1007/s10616-005-2602-0. [DOI] [PMC free article] [PubMed] [Google Scholar]
- 54.Lei Y. Generation and culture of mouse embryonic fibroblasts. Methods Mol Biol. 2013;1031:59–64. doi: 10.1007/978-1-62703-481-4_7. [DOI] [PubMed] [Google Scholar]
- 55.Chen YW, et al. Human DNA polymerase eta activity and translocation is regulated by phosphorylation. Proc Natl Acad Sci USA. 2008;105(43):16578–16583. doi: 10.1073/pnas.0808589105. [DOI] [PMC free article] [PubMed] [Google Scholar]
- 56.Elmendorf JS, Chen D, Pessin JE. Guanosine 5′-O-(3-thiotriphosphate) (GTPgammaS) stimulation of GLUT4 translocation is tyrosine kinase-dependent. J Biol Chem. 1998;273(21):13289–13296. doi: 10.1074/jbc.273.21.13289. [DOI] [PubMed] [Google Scholar]


